Social media plays a major role in brand growth today. Businesses use social platforms to reach customers, build awareness, drive traffic, and generate sales. However, many teams still struggle to measure the real value of their social efforts. They post content daily, run ads, engage with users, and hope for results. But without the right measurement, they cannot track progress or improve performance.Social Media ROI KPI Dashboard in Google Sheets
This is where a Social Media ROI KPI Dashboard in Google Sheets becomes a game-changer. It gives you one powerful place to track all key metrics, understand your performance, and make smart decisions. The dashboard shows how your content performs, how much you spend, and how much you earn. With this information, you can grow faster and use your social media budget wisely.Social Media ROI KPI Dashboard in Google Sheets
What Is a Social Media ROI KPI Dashboard in Google Sheets?
Click to Buy Social Media ROI KPI Dashboard in Google Sheets
A Social Media ROI KPI Dashboard in Google Sheets is a ready-to-use reporting tool that tracks every important social media metric. It captures engagement, cost, conversions, traffic, reach, and revenue. Because of this, you can measure real performance and see if your social media activities bring true value.
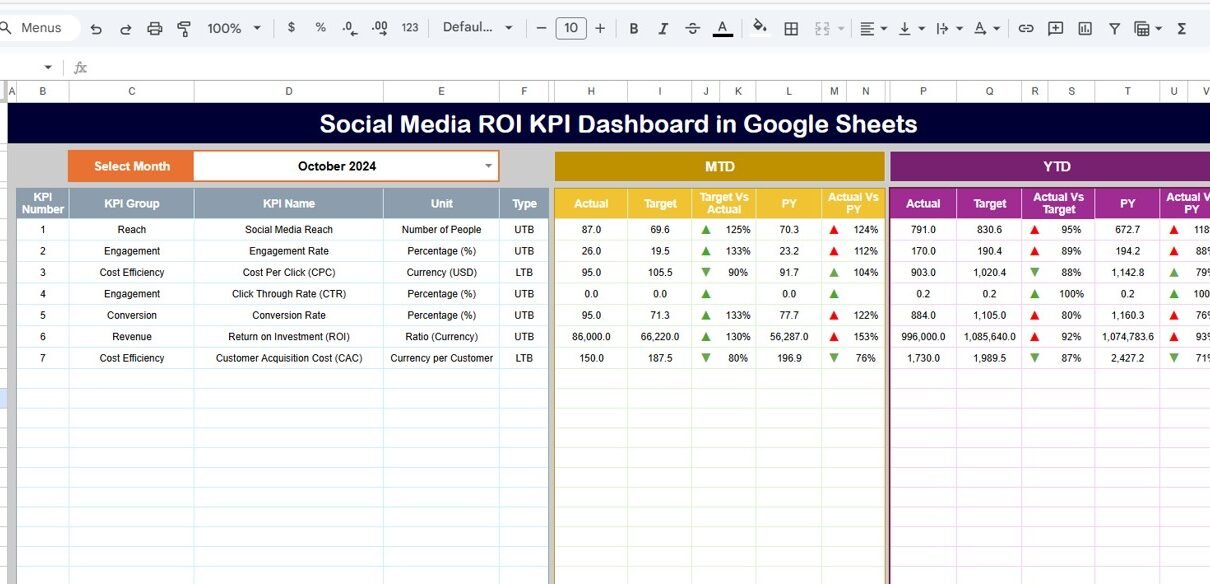
The dashboard displays your monthly performance (MTD), yearly performance (YTD), targets, and previous-year results. It also shows trend charts, KPI details, and progress indicators. As soon as you update your actual data, the visual dashboard updates automatically.
You can use this dashboard to track:
-
Organic social media performance
-
Paid social media campaigns
-
Influencer marketing impact
-
Brand visibility
-
Lead generation
-
Sales from campaigns
-
ROI from every social media activity
Since it is made in Google Sheets, you enjoy benefits like:
-
Cloud access
-
Easy collaboration
-
Auto-calculation
-
Clean visuals
-
Customization for any business
This dashboard works perfectly for digital marketing teams, social media managers, agencies, entrepreneurs, and anyone who wants clear performance tracking.
Key Features of the Social Media ROI KPI Dashboard in Google Sheets
Your dashboard contains 6 powerful worksheets, each playing an important role in building insights. Let’s walk through all these components one by one.
1. Dashboard Sheet Tab – Main KPI Dashboard
This is the main sheet where you can see all your KPIs in one place. The dashboard looks clean, simple, and easy to read. You can select the month from the dropdown in cell D3, and the entire dashboard updates instantly.
The dashboard uses conditional formatting with up/down arrows, which helps you quickly understand:
-
Green arrow ↑ → Performance improved
-
Red arrow ↓ → Performance declined
Because of this real-time comparison, you can take the right decisions without reading long reports.

Click to Buy Social Media ROI KPI Dashboard in Google Sheets
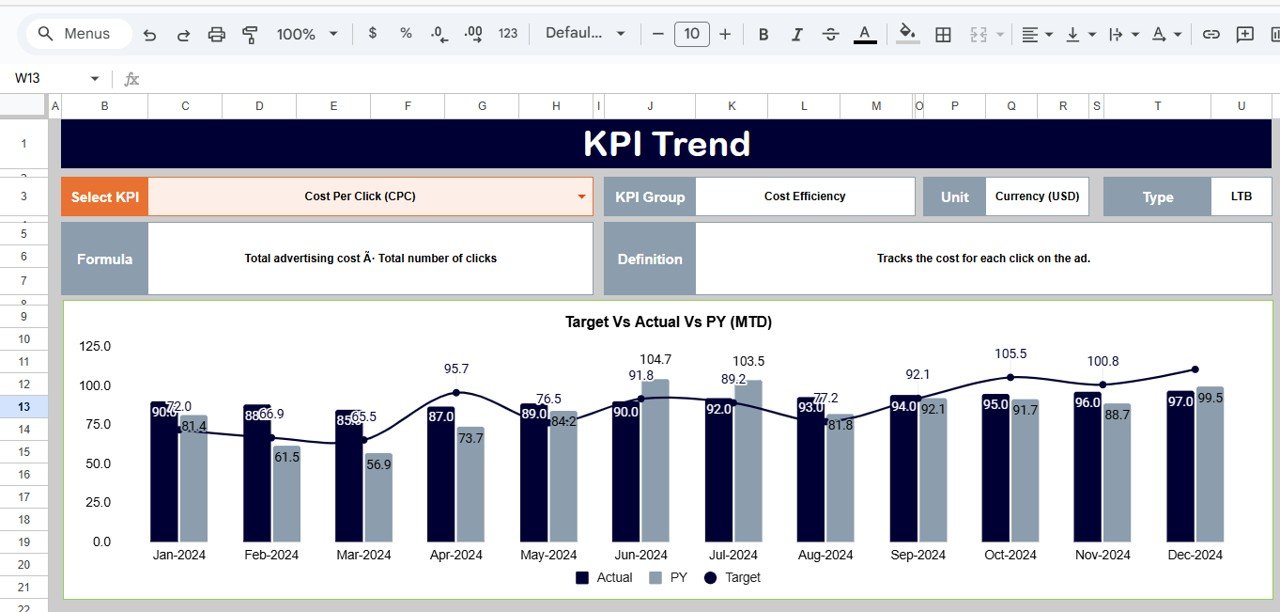
2. KPI Trend Sheet Tab – Dynamic KPI Analysis
Trend analysis helps you understand how your KPI behaves over time. On this sheet, you select the KPI from the dropdown in cell C3, and the sheet displays:
- KPI Group
- Unit of Measurement
- KPI Type (Upper the Better or Lower the Better)
- KPI Formula
- KPI Definition
You also see a trend chart that shows the movement of the KPI through the year. This helps you monitor improvements, declines, and seasonal changes.
Click to Buy Social Media ROI KPI Dashboard in Google Sheets
For example:
-
If engagement rate falls in certain months, you can fix your content strategy.
-
If CPC rises, you can optimize campaigns.
-
If ROI drops, you can review your spending.
The trend sheet supports data-driven decisions.
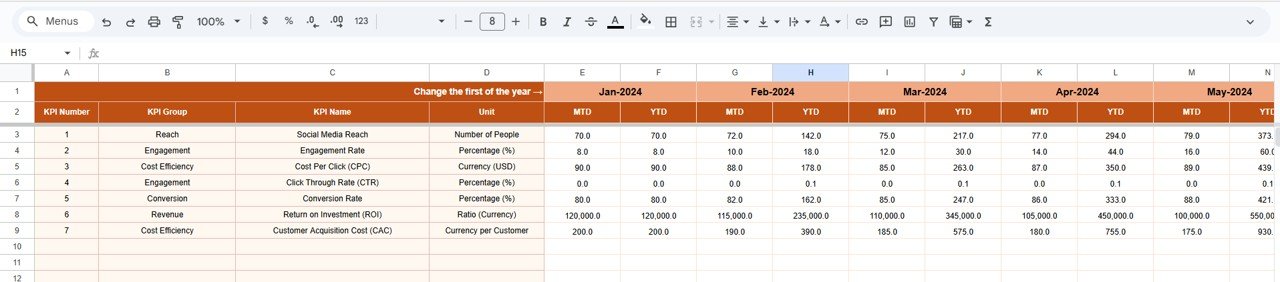
Actual Number Sheet Tab – Enter Real Performance Data
This is where you enter your actual numbers. You update:
✔ MTD Actual
✔ YTD Actual
You can select the month from cell E1, and the sheet automatically changes the values shown for that month.
This sheet is the heart of your dashboard because all KPI numbers come from here.
Click to Buy Social Media ROI KPI Dashboard in Google Sheets
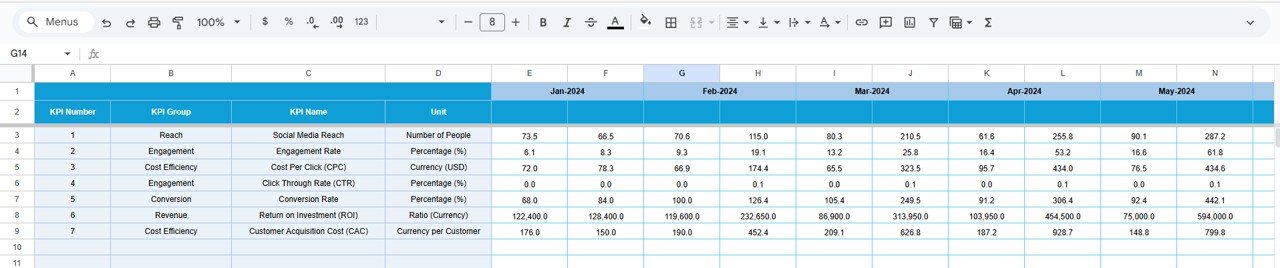
Target Sheet Tab – Enter Target Numbers
Your dashboard becomes meaningful only when you compare actual performance with expected performance. This sheet stores your MTD and YTD targets for every KPI.
Examples of targets:
-
Engagement rate: 4%
-
CTR: 1.8%
-
Qualified leads: 250
-
Revenue from campaigns: $50,000
You can set monthly and yearly targets in advance and monitor real performance against them.
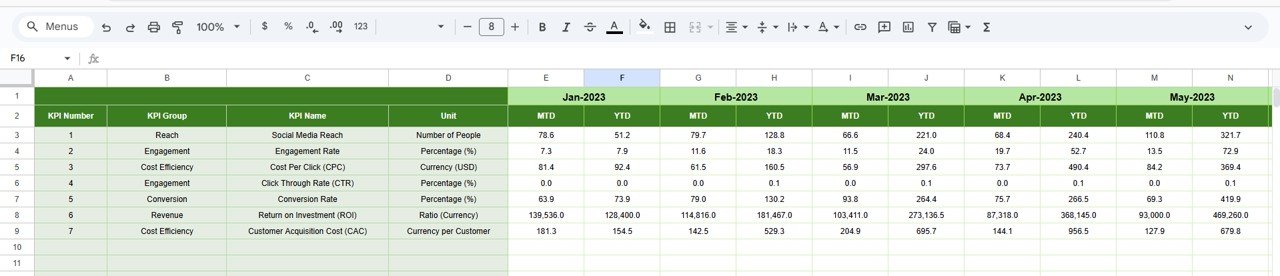
Previous Year Number Sheet Tab – Enter Last Year’s Data
You enter your previous-year (PY) numbers in this sheet. This helps you measure year-over-year improvement.
For example:
-
If last year your CPC was $0.60 and this year it is $0.45, you improved.
-
If your revenue last year was $40,000 and this year it is $55,000, you grew.
PY comparison is important because it shows long-term progress.
Click to Buy Social Media ROI KPI Dashboard in Google Sheets
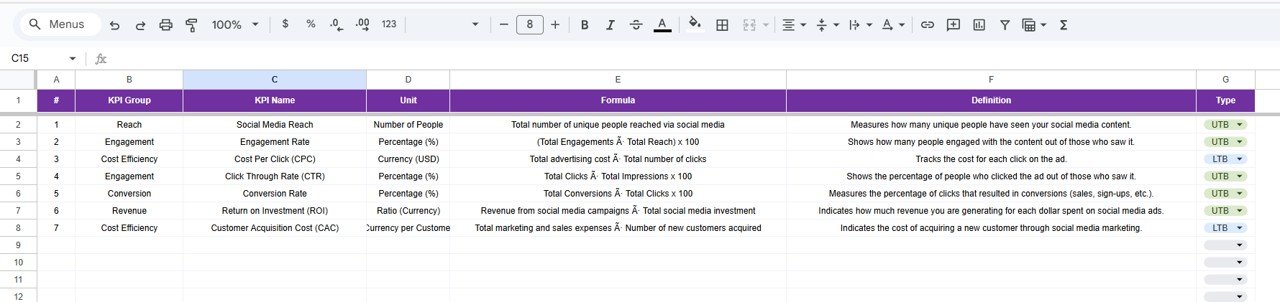
6. KPI Definition Sheet Tab – List of All KPIs
This sheet captures the complete details of every KPI.
It includes:
- KPI Name
KPI Group
Unit
Formula
Definition
Type (UTB / LTB)
This sheet becomes a learning guide for new team members. It also helps managers review KPI logic during reporting.
Click to Buy Social Media ROI KPI Dashboard in Google Sheets
Advantages of Using a Social Media ROI KPI Dashboard
Let us explore why this dashboard becomes a must-have for marketers.
- Helps You Track Real Performance: You can see exactly what works and what doesn’t.
- Improves Content Strategy: Trends show which posts perform better, helping you refine your content.
- Saves Time; The dashboard updates automatically; no manual reporting.
- Drives Better Decisions: You compare actual vs target and previous year to understand progress.
- Increases ROI; When you track performance daily, you improve ROI faster.
Best Practices for Using This Dashboard
Follow these best practices for accurate reporting.
- Update Data Daily or Weekly: Frequent updates keep insights accurate.
- Set Realistic Targets; Targets must match your brand size and audience.
- Track Both Organic and Paid Performance; Organic engagement + paid ads = complete picture.
- Review Trends Monthly: Trends help you fix issues early.
- Compare with Previous Year: Year-over-year growth shows long-term success.
- Use Clear KPI Definitions; Clear definitions improve team understanding.
Conclusion
Click to Buy Social Media ROI KPI Dashboard in Google Sheets
The Social Media ROI KPI Dashboard in Google Sheets is one of the most powerful tools for digital marketers today. It gives you complete visibility into engagement, conversions, costs, traffic, and revenue. Because of its structured design, you can track monthly and yearly progress, compare targets, and review trends easily. With this dashboard, you make better decisions, optimize your content, reduce cost, and improve ROI across all platforms.
Start using this dashboard today and bring clarity, direction, and growth to your social media strategy.
Frequently Asked Questions (FAQs)
1. What is the purpose of this Social Media ROI Dashboard?
It helps you measure engagement, conversions, costs, and revenue across all social media platforms.
2. Can I customize the KPIs?
Yes, you can add or remove KPIs based on your business goals.
3. Does the dashboard support multiple platforms?
Yes. You can track Facebook, Instagram, YouTube, LinkedIn, X, TikTok, or any other platform.
4. How often should I update data?
Weekly updates are ideal, but daily updates give more accuracy.
5. Can beginners use this dashboard?
Yes. The design is simple, clean, and easy to use.
Visit our YouTube channel to learn step-by-step video tutorials
Youtube.com/@NeotechNavigators
Watch the step-by-step video Demo:
Click to Buy Social Media ROI KPI Dashboard in Google Sheets