In the fast-paced world of logistics, efficiency and accuracy define success. Tracking performance across multiple supply chain functions — from order fulfillment to delivery time — is essential. The Supply Chain – Logistics KPI Scorecard in Google Sheets is a ready-to-use performance monitoring tool that allows businesses to evaluate, visualize, and optimize logistics operations efficiently.Supply Chain – Logistics KPI Scorecard in Google Sheets
In this article, we’ll explore its features, advantages, best practices, and how it can transform your logistics performance management.Supply Chain – Logistics KPI Scorecard in Google Sheets
What Is a Supply Chain – Logistics KPI Scorecard in Google Sheets?
A Supply Chain KPI Scorecard is a structured reporting tool that displays the performance of critical logistics metrics in a visual and interactive way. It helps you identify trends, compare actual results against targets, and make data-driven decisions to improve performance.
Built in Google Sheets, this scorecard provides real-time access, easy collaboration, and automation of calculations, making it an ideal solution for logistics teams, supply chain managers, and operations leaders.
Key Features of the Logistics KPI Scorecard
Click to Buy Supply Chain – Logistics KPI Scorecard in Google Sheets
This Google Sheets Scorecard includes several powerful sheets and features:
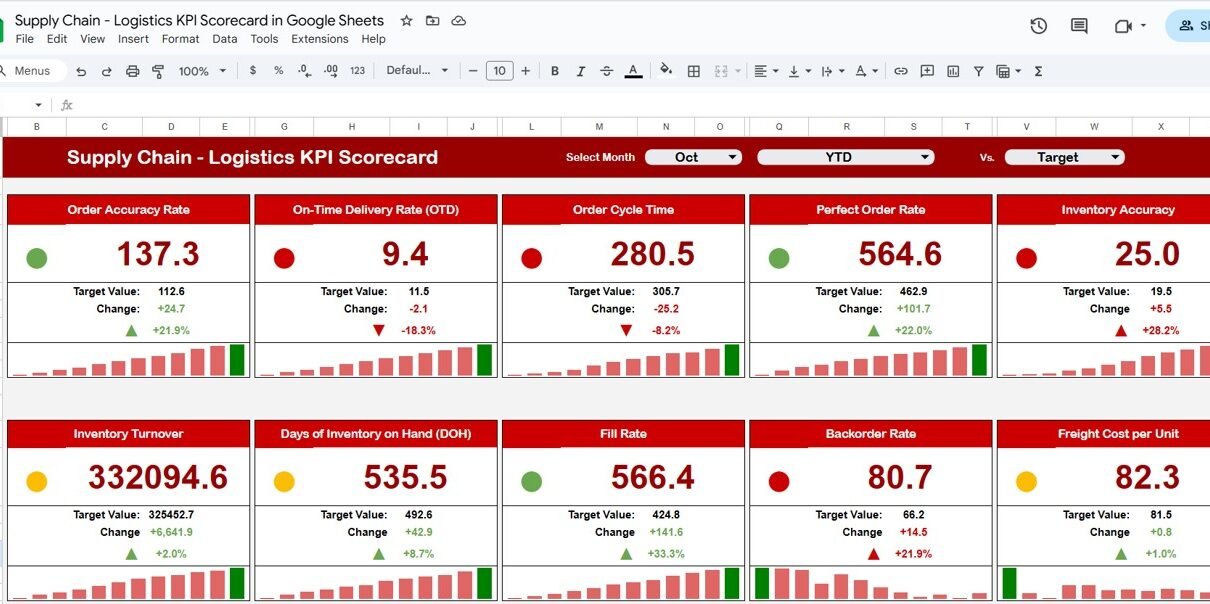
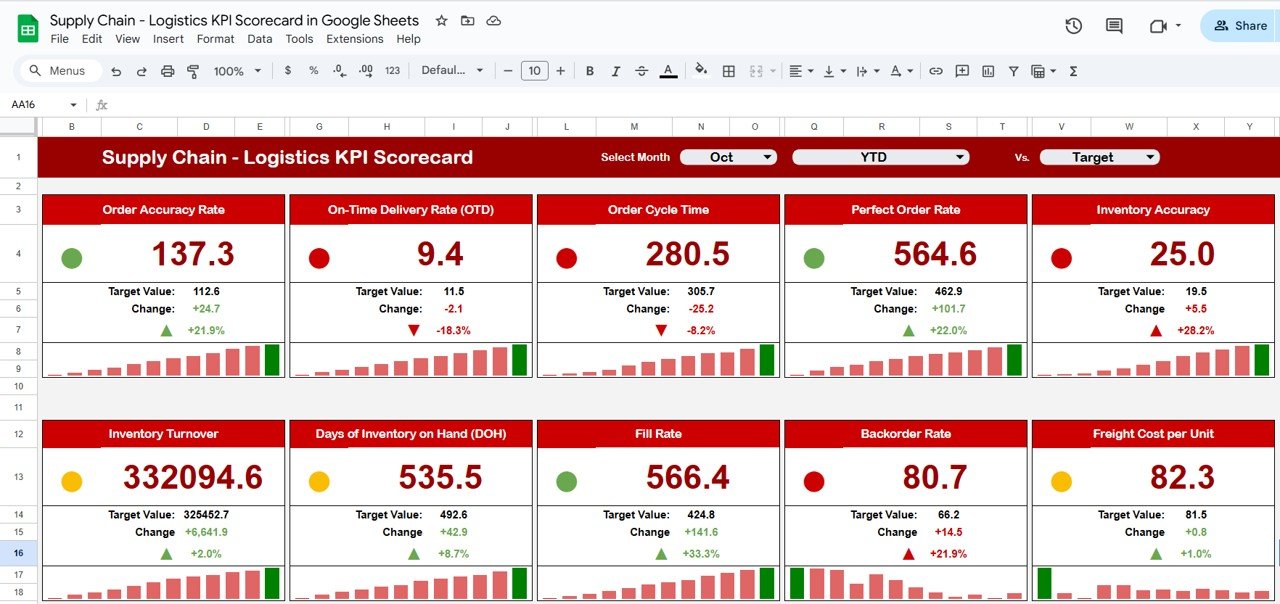
1. Dashboard Sheet Tab
This is the main view where you can analyze performance in a single glance.
Highlights:
Month Dropdown (Range D3): Choose any month to see that month’s data.
Automatic Updates: All KPIs, charts, and indicators update dynamically.
Traffic Light Indicators: Each KPI shows performance status using green (good), yellow (average), or red (poor) indicators.
Trend Arrows: Display percentage change vs. target or previous period.
MTD & YTD View:
- MTD (Month-To-Date): Analyze performance for the current month.
- YTD (Year-To-Date): Review cumulative yearly performance.
The dashboard gives instant visibility into all logistics KPIs, helping managers act quickly.
Click to Buy Supply Chain – Logistics KPI Scorecard in Google Sheets
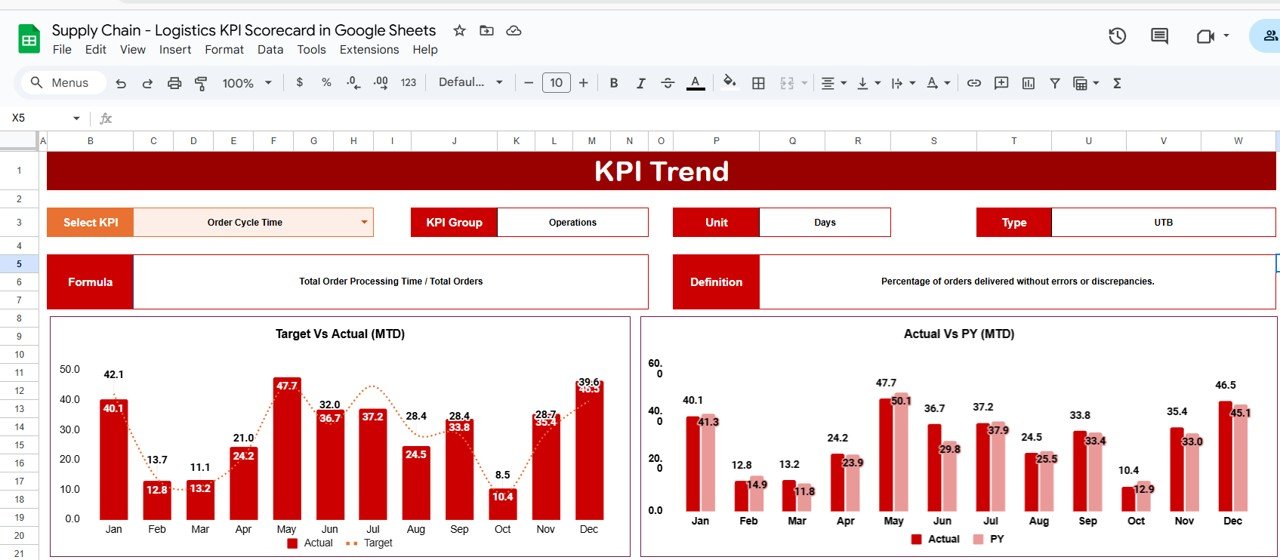
2. KPI Trend Sheet Tab
This sheet provides deeper analysis and trend visualization for each KPI.
Features:
-
KPI Selection Dropdown (Cell C3) to choose any KPI for analysis.
Displays the following for each KPI:
- KPI Group
- Unit of Measurement
- Performance Type — Lower-the-Better (LTB) or Upper-the-Better (UTB)
- Formula and Definition
Trend Chart showing KPI progression over time.
This helps track historical performance and identify areas for improvement.
Click to Buy Supply Chain – Logistics KPI Scorecard in Google Sheets
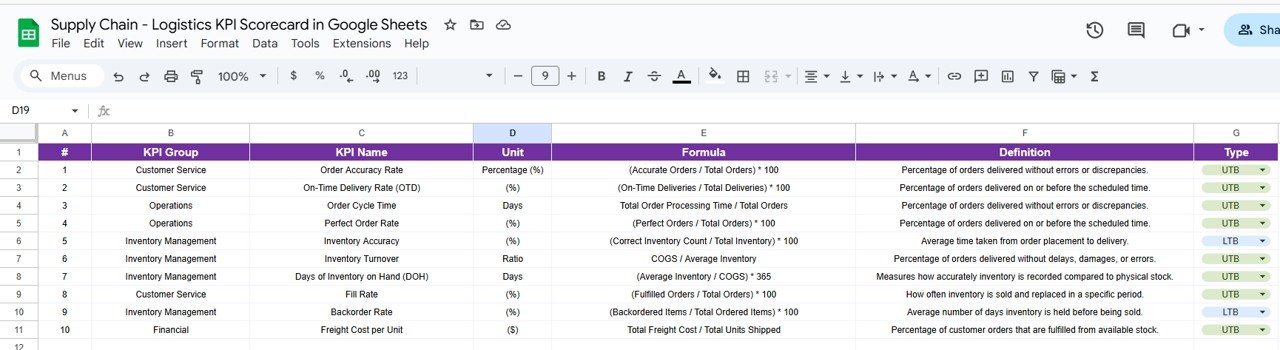
3. KPI Definition Sheet Tab
This sheet documents all KPI details in a structured format.
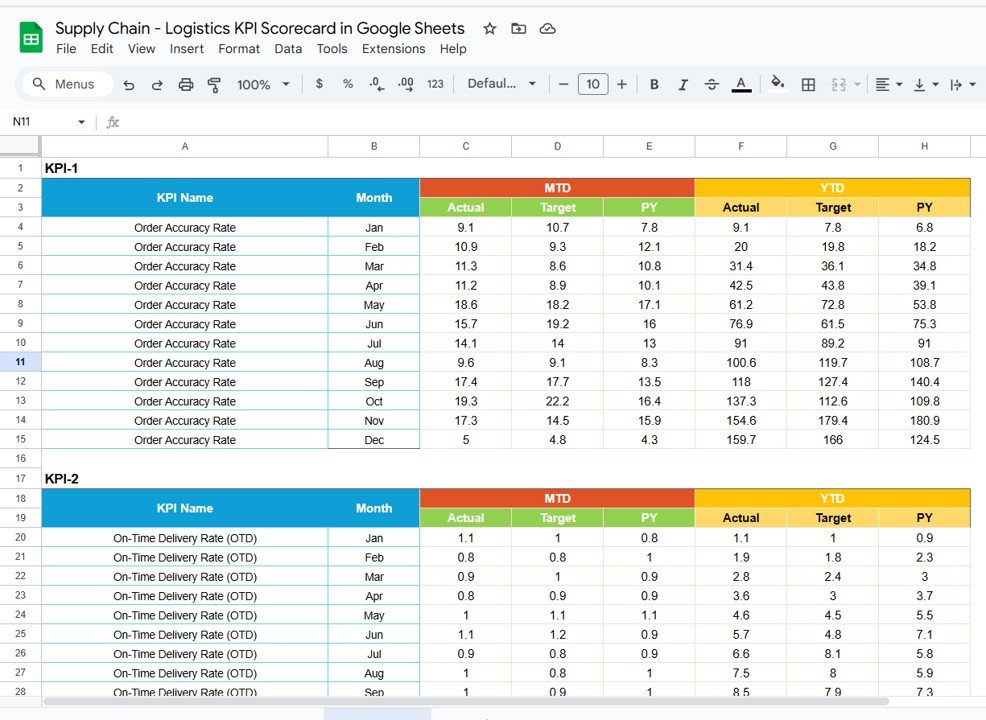
4. Data Input Sheet Tab
This sheet is where you record all monthly KPI data.
-
Enter MTD and YTD actual numbers for each KPI.
-
Update monthly to keep the dashboard live and accurate.
-
All charts and indicators refresh automatically when new data is entered.
Click to Buy Supply Chain – Logistics KPI Scorecard in Google Sheets
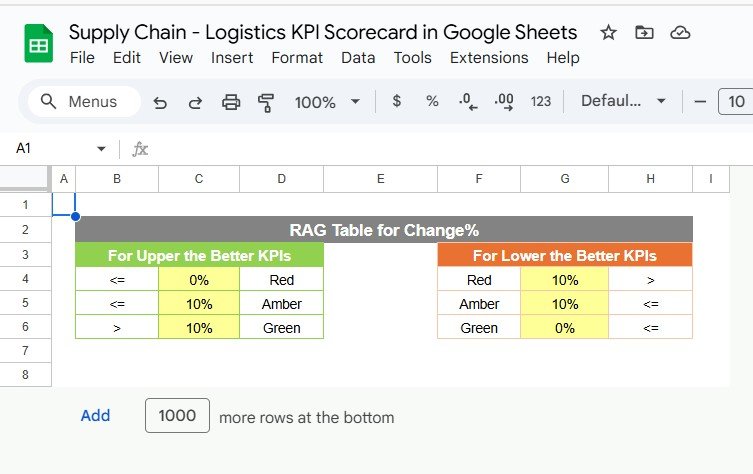
5. Color Settings Sheet Tab
You can define conditional formatting thresholds here:
-
Green Zone: Performance meets or exceeds target.
-
Yellow Zone: Acceptable but needs improvement.
-
Red Zone: Below target; requires immediate action.
This ensures quick visual interpretation of performance metrics.
Click to Buy Supply Chain – Logistics KPI Scorecard in Google Sheets
Advantages of Using the Logistics KPI Scorecard
-
📊 Centralized Performance View: All logistics KPIs in one sheet.
-
🔄 Automated Calculations: No manual tracking errors.
-
🎯 Target Comparison: View performance against targets instantly.
-
📈 MTD & YTD Analysis: Track both short-term and long-term trends.
-
🔍 Data Transparency: Shared Google Sheet ensures visibility for all stakeholders.
-
⚡ Actionable Insights: Identify inefficiencies and take immediate corrective actions.
Best Practices for Using the Scorecard
-
Define KPIs Clearly: Use the KPI Definition sheet to ensure everyone understands each metric.
-
Update Data Consistently: Input monthly actuals on time for accurate analysis.
-
Set Realistic Targets: Keep targets challenging but achievable.
-
Review Trends Regularly: Use the KPI Trend sheet for continuous improvement tracking.
-
Align KPIs with Strategy: Ensure all tracked metrics support broader business goals.
-
Visualize Performance: Use conditional formatting and charts to communicate results effectively.
Why Use Google Sheets for a KPI Scorecard?
Click to Buy Supply Chain – Logistics KPI Scorecard in Google Sheets
-
Real-Time Collaboration: Multiple users can update and view data simultaneously.
-
Cloud-Based: Access your scorecard anytime, anywhere.
-
Customizable: Add KPIs, modify formulas, or change color thresholds easily.
-
No Additional Software: Google Sheets requires no installation or complex setup.
Frequently Asked Questions (FAQs)
Q1: Can I add more KPIs to this scorecard?
Yes, you can expand the KPI Definition and Data Input sheets with new KPIs anytime.
Q2: How often should I update the data?
Update monthly for MTD data and quarterly or yearly for YTD performance tracking.
Q3: Can I share this scorecard with my team?
Yes, as it’s built in Google Sheets, you can easily share it with your entire logistics team.
Q4: Does the scorecard support visual performance indicators?
Yes, it includes traffic lights and arrows for instant visual analysis.
Q5: Can I modify formulas or performance thresholds?
Absolutely. All formulas and thresholds are editable in the KPI Definition and Color Settings sheets.Supply Chain – Logistics KPI Scorecard in Google Sheets
Conclusion
Click to Buy Supply Chain – Logistics KPI Scorecard in Google Sheets
The Supply Chain – Logistics KPI Scorecard in Google Sheets is a powerful, ready-to-use tool for tracking logistics performance efficiently. By combining data visualization, trend tracking, and automation, it enables businesses to monitor KPIs such as on-time delivery, cost efficiency, and order accuracy — all from one simple dashboard.Supply Chain – Logistics KPI Scorecard in Google Sheets
Visit our YouTube channel to learn step-by-step video tutorials
Youtube.com/@NeotechNavigators
Watch the step-by-step video Demo:
Click to Buy Supply Chain – Logistics KPI Scorecard in Google Sheets