Supply chain management plays a critical role in modern business success. Companies must manage suppliers, warehouses, shipping methods, product categories, and delivery performance efficiently. However, many organizations still rely on scattered spreadsheets and manual reports. As a result, decision-makers struggle to track performance, identify delays, and maintain operational visibility.Supply Chain Management Dashboard in Google Sheets
Therefore, businesses increasingly adopt centralized analytics dashboards that transform raw data into actionable insights.
The Supply Chain Management Dashboard in Google Sheets provides a powerful yet simple solution. It combines automation, visualization, and interactive filtering into a single platform that helps organizations monitor orders, deliveries, returns, and supplier performance in real time.Supply Chain Management Dashboard in Google Sheets
In this article, we will explain the structure, features, benefits, and best practices of the Supply Chain Management Dashboard in Google Sheets and show how it improves operational decision-making.Supply Chain Management Dashboard in Google Sheets
What Is a Supply Chain Management Dashboard in Google Sheets?
Click to Buy Supply Chain Management Dashboard in Google Sheets
A Supply Chain Management Dashboard in Google Sheets is an interactive reporting system designed to monitor supply chain KPIs using dynamic charts, slicers, and automated calculations.
Instead of analyzing multiple files, users access all supply chain insights from one centralized dashboard.
The dashboard helps organizations:
- Track order performance
- Monitor on-time deliveries
- Analyze returned orders
- Evaluate supplier efficiency
- Compare warehouse performance
- Study product category trends
Because Google Sheets works in the cloud, teams collaborate and access data anytime from anywhere.
Why Is Supply Chain Visibility Important?
Supply chains involve multiple moving parts. Suppliers, logistics teams, warehouses, and customers must work together smoothly.
Without visibility:
- Delivery delays increase
- Inventory planning becomes difficult
- Supplier performance declines
- Customer satisfaction drops
However, dashboards solve these challenges by presenting real-time performance metrics clearly.
Key Benefits of Supply Chain Visibility
- Faster decision-making
- Improved delivery performance
- Better supplier evaluation
- Reduced operational risks
- Enhanced customer satisfaction
Overview of the Supply Chain Management Dashboard
Click to Buy Supply Chain Management Dashboard in Google Sheets
This dashboard contains multiple analytical pages designed for deep performance analysis.
Below, we explain each section.
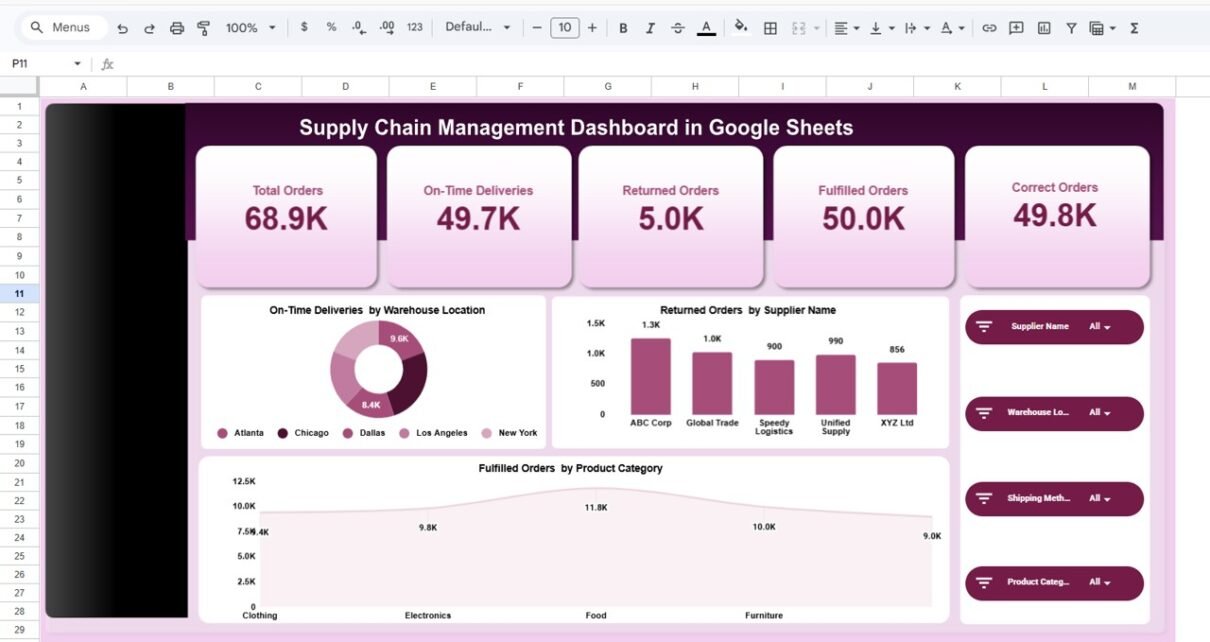
Main Dashboard Overview Page
The Overview Page provides a high-level summary of supply chain performance.
KPI Cards Displayed
At the top, five KPI cards instantly show performance metrics:
- Total Orders — 68.9K
- On-Time Deliveries — 49.7K
- Returned Orders — 5.0K
- Fulfilled Orders — 50.0K
- Correct Orders — 49.8K
These indicators allow managers to understand operational health immediately.
Charts Included
- On-Time Deliveries by Warehouse Location
- Returned Orders by Supplier
- Fulfilled Orders by Product Category
Interactive Filters
Users can filter analysis using:
- Supplier Name
- Warehouse Location
- Shipping Method
- Product Category
Therefore, users quickly drill into specific operational areas.

Click to Buy Supply Chain Management Dashboard in Google Sheets
Supplier Analysis Page
The Supplier Analysis page evaluates supplier performance.
Key Visuals
- Returned Orders by Supplier
- On-Time Deliveries by Supplier
- Correct Orders by Supplier
- Fulfilled Orders Trend

Click to Buy Supply Chain Management Dashboard in Google Sheets
Warehouse Location Analysis
The Warehouse Location Analysis page focuses on distribution efficiency.
Metrics Analyzed
- Returned Orders by Warehouse
- On-Time Deliveries by Warehouse
- Correct Orders by Warehouse
- Fulfilled Orders Comparison
Managers easily identify which warehouse performs best and where operational improvements are required.

Click to Buy Supply Chain Management Dashboard in Google Sheets
Product Category Analysis
The Product Category Analysis page analyzes demand and performance by product type.
Key Insights
- Returned Orders by Product Category
- On-Time Deliveries by Category
- Correct Orders by Category
- Fulfillment Performance Trends
This helps businesses optimize inventory planning and product strategy.

Click to Buy Supply Chain Management Dashboard in Google Sheets
Search & Data Exploration Page
The Search Page allows users to explore raw transaction data.
Features
- Keyword search functionality
- Column-based filtering
- Total record counter
- Detailed transaction view
Displayed fields include:
- Record ID
- Date
- Supplier Name
- Warehouse Location
- Shipping Method
- Product Category
- Orders and delivery metrics
Therefore, users validate dashboard insights using detailed data records.

Click to Buy Supply Chain Management Dashboard in Google Sheets
Advantages of Supply Chain Management Dashboard in Google Sheets
Cloud-Based Accessibility
Access dashboards from anywhere.
Real-Time Collaboration
Teams work simultaneously.
Interactive Filtering
Analyze data dynamically.
Automated Reporting
Charts update automatically.
Cost-Effective Solution
No expensive software required.
Easy Customization
Modify KPIs and visuals easily.
Improved Decision-Making
Clear visuals simplify analysis.
Best Practices for the Supply Chain Management Dashboard in Google Sheets
Click to Buy Supply Chain Management Dashboard in Google Sheets
- Maintain consistent data entry formats
- Update records daily or weekly
- Focus on actionable KPIs
- Monitor trends instead of isolated data points
- Train users on dashboard filters
- Review supplier performance regularly
- Validate data accuracy frequently
Who Can Use This Dashboard?
This dashboard benefits:
- Supply chain managers
- Logistics companies
- Procurement teams
- Warehouse supervisors
- Operations analysts
- Retail businesses
- Manufacturing companies
Conclusion
Click to Buy Supply Chain Management Dashboard in Google Sheets
Modern supply chains require visibility, speed, and accuracy. Without structured analytics, organizations struggle to maintain efficiency and customer satisfaction.
The Supply Chain Management Dashboard in Google Sheets provides a practical and powerful solution by combining KPI monitoring, interactive analytics, and detailed data exploration into one system.
By using this dashboard, businesses can:
- Improve delivery performance
- Optimize supplier management
- Enhance warehouse efficiency
- Reduce returns
- Make data-driven decisions confidently
Ultimately, this dashboard transforms supply chain data into strategic business intelligence.
Frequently Asked Questions (FAQs)
Click to Buy Supply Chain Management Dashboard in Google Sheets
1. What is a Supply Chain Dashboard?
It is an analytics tool that tracks logistics and operational KPIs in one interface.
2. Can beginners use this dashboard?
Yes. Anyone familiar with Google Sheets can use it easily.
3. Does the dashboard update automatically?
Yes. Charts update automatically when data changes.
4. Can I customize KPIs?
Yes. You can modify metrics based on business needs.
Visit our YouTube channel to learn step-by-step video tutorials
Youtube.com/@NeotechNavigators
Watch the step-by-step video tutorial:
Click to Buy Supply Chain Management Dashboard in Google Sheets