Running a fitness studio successfully requires tracking multiple metrics, from membership growth and attendance to revenue and trainer performance. The Fitness Studio KPI Dashboard in Google Sheets provides a ready-to-use, interactive solution for monitoring key performance indicators (KPIs) and making data-driven decisions.
In this article, we’ll explain the features, benefits, and best practices for using this dashboard.
Get the Fitness Studio KPI Dashboard in Google Sheets
What Is a Fitness Studio KPI Dashboard?
A Fitness Studio KPI Dashboard consolidates all essential fitness studio metrics into a single Google Sheets file. It allows managers to track monthly and yearly performance, compare actuals against targets, and identify trends.
Key benefits include:
-
Tracking MTD (Month-to-Date) and YTD (Year-to-Date) performance
-
Comparing current performance with previous year data
-
Identifying top-performing trainers, memberships, and programs
-
Visualizing KPIs with conditional formatting, charts, and cards
Key Features of the Fitness Studio KPI Dashboard
This dashboard consists of 6 worksheets designed to provide comprehensive performance insights:
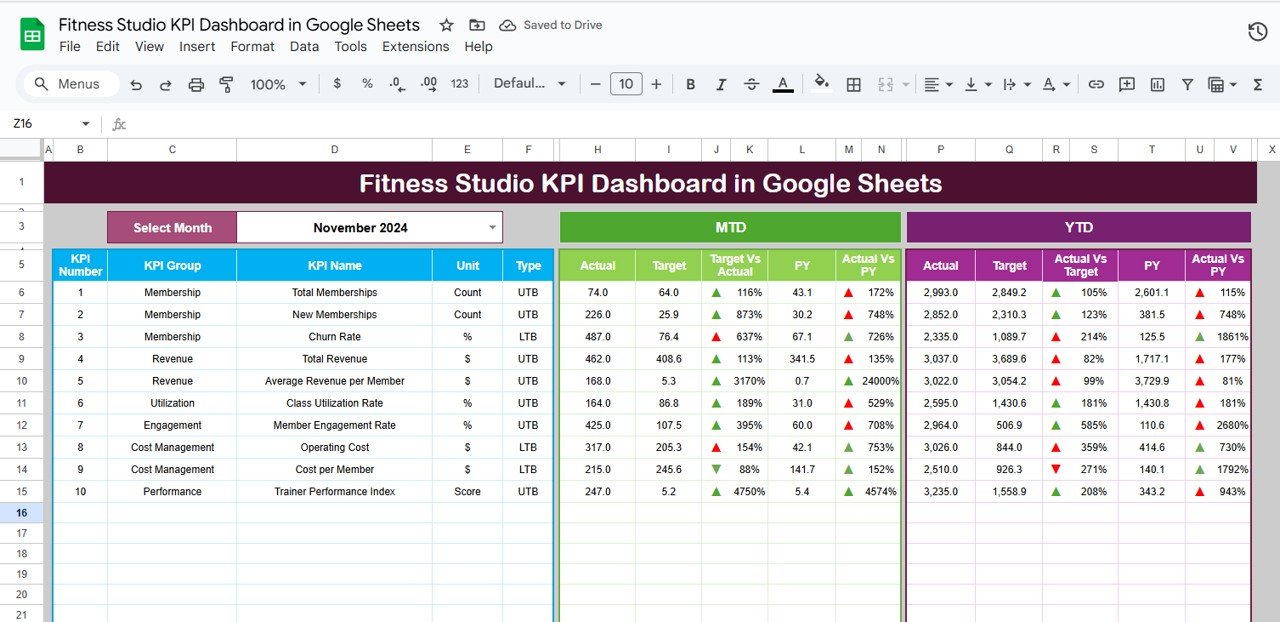
1. Dashboard Sheet Tab
The Dashboard Sheet is the main page where all KPI information is displayed:
Cards:
-
Total Memberships
-
Active Members
-
Average Session Attendance
-
Revenue
-
Trainer Performance Score
Charts:
-
Membership Growth by Month
-
Attendance Trends by Program
-
Revenue by Membership Type
-
Trainer Performance by Class
Features:
-
Dropdown to select the month (Range D3) dynamically updates all data
-
Conditional formatting arrows to indicate performance vs targets and previous year
2. KPI Trend Sheet Tab
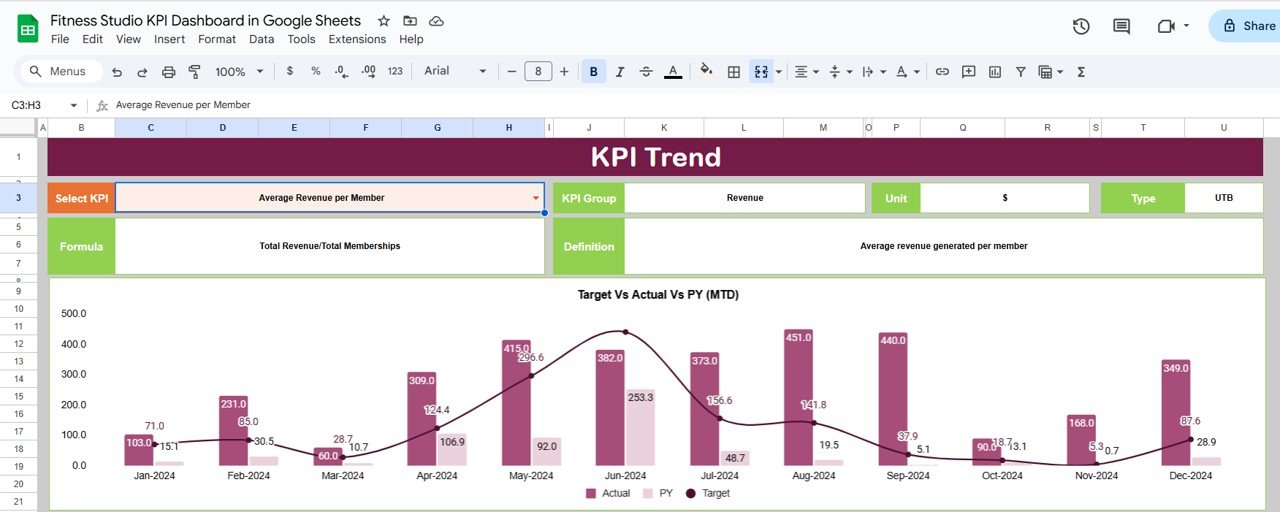
The KPI Trend Sheet provides detailed analysis of each KPI:
-
Select a KPI from the dropdown (Range C3)
-
Displays KPI Group, Unit, Type (Upper-the-Better or Lower-the-Better)
-
Shows KPI formula and definition
-
Tracks trends over time to identify areas of improvement
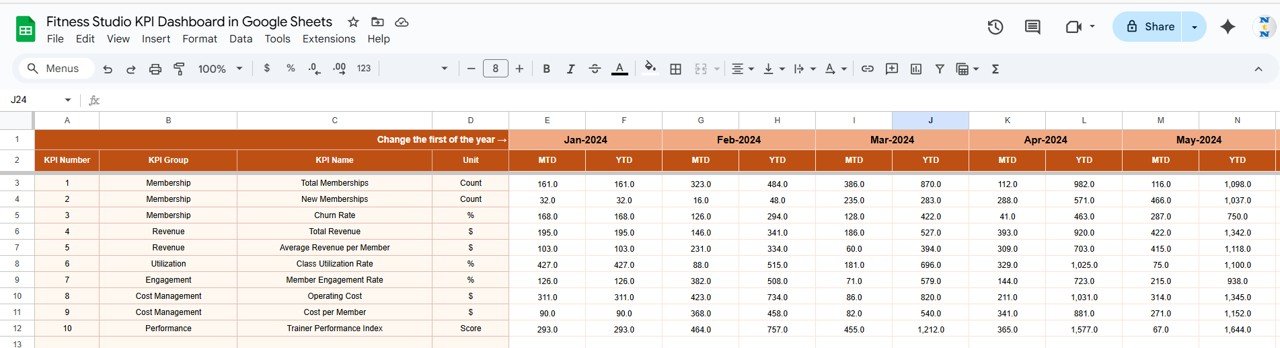
3. Actual Number Sheet Tab
-
Enter actual MTD and YTD numbers for each KPI
-
Change the first month of the year in Range E1 to update calculations
-
Ensures dashboard reflects real-time performance metrics
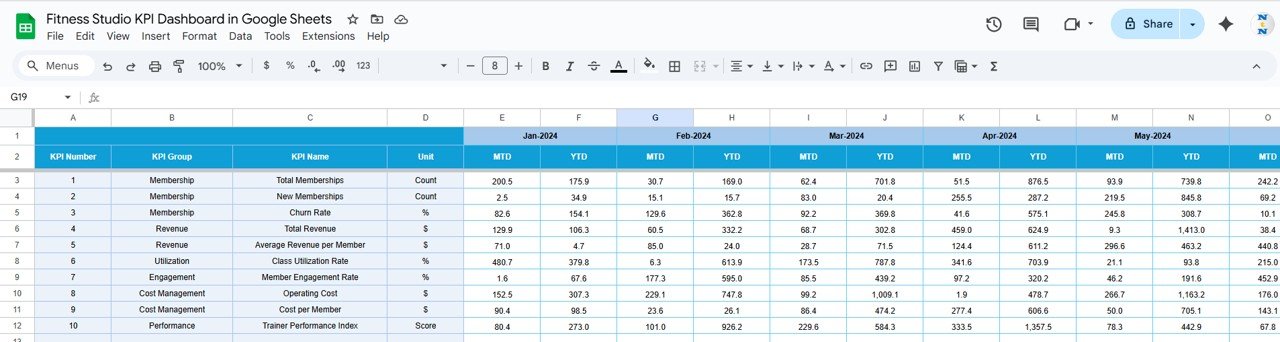
4. Target Sheet Tab
-
Enter monthly and yearly targets for each KPI
-
Compare actual performance with goals to monitor success
-
Supports both MTD and YTD tracking
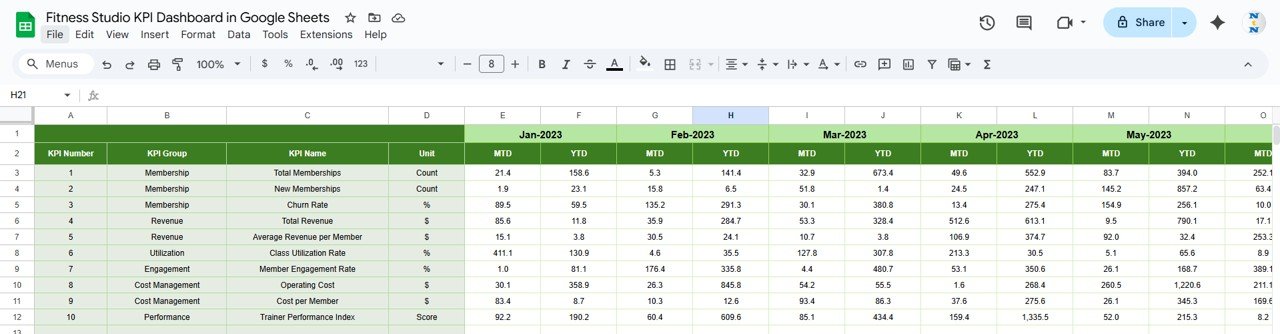
5. Previous Year Number Sheet Tab
-
Enter previous year numbers for all KPIs
-
Enables year-over-year comparisons
-
Provides historical context for decision-making
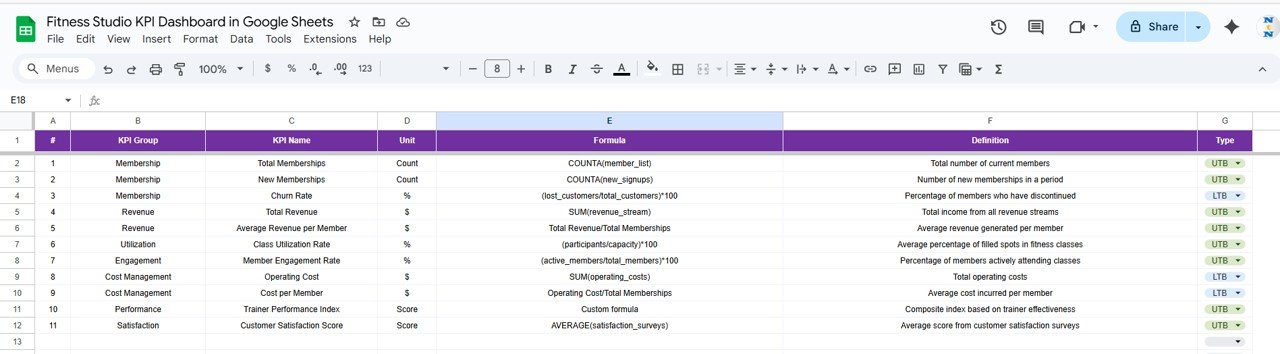
6. KPI Definition Sheet Tab
-
List KPI Name, Group, Unit, Formula, Definition, and Type (Upper-the-Better or Lower-the-Better)
-
Acts as a reference to maintain consistency in measurement and reporting
Examples of KPIs in a Fitness Studio Dashboard
-
Total Memberships (Upper-the-Better)
-
Active Members (%) (Upper-the-Better)
-
Revenue ($) (Upper-the-Better)
-
Average Session Attendance (Upper-the-Better)
-
Trainer Performance Score (Upper-the-Better)
-
Member Retention Rate (%) (Upper-the-Better)
-
Class Utilization Rate (%) (Upper-the-Better)
Each KPI should have a defined unit, formula, and type (Upper or Lower the Better) for accurate tracking.
Advantages of Using the Dashboard
-
Centralized Data: Track all studio KPIs in one place
-
Visual Insights: Charts and cards provide instant understanding
-
Track Trends: Analyze performance MTD, YTD, and year-over-year
-
Identify Underperforming Areas: Detect low attendance classes or underperforming trainers
-
Customizable: Add or remove KPIs as needed
-
Data-Driven Decisions: Optimize studio operations and improve member engagement
Best Practices for Using the Dashboard
-
Update Actuals Regularly: Keep the dashboard accurate by entering monthly data
-
Set Clear Targets: Define realistic targets for memberships, revenue, and attendance
-
Track Retention Rates: Monitor retention to identify churn and improve engagement
-
Analyze Trainer Performance: Use KPI trends to support or train staff
-
Segment Metrics by Program or Location: Identify high-performing classes or branches
-
Use Conditional Formatting: Highlight areas that need immediate attention
How the Dashboard Helps Studio Managers
-
Optimize Class Schedules: Understand attendance patterns
-
Increase Membership Engagement: Track active members and retention
-
Boost Revenue: Monitor revenue trends and adjust pricing or promotions
-
Enhance Trainer Performance: Identify top performers and support improvement areas
-
Plan Marketing Campaigns: Focus on programs or memberships that drive growth
Want to build KPI dashboards like this step by step? The Excel Pivot Tables & Dashboards course on NextGenTemplates Academy walks you through it with practice files.
Get the Fitness Studio KPI Dashboard in Google Sheets
Frequently Asked Questions (FAQs)
Q1: Can I add new KPIs to the dashboard?
Yes, the dashboard is fully customizable. Add or remove KPIs in the KPI Definition sheet and update actuals and targets accordingly.
Q2: Can this dashboard track multiple studio locations?
Absolutely. Include a location column in the data sheet to track metrics by branch.
Q3: How often should I update data?
Monthly updates are recommended, though weekly updates can provide more real-time insights.
Q4: Can I track trends over time?
Yes, the KPI Trend sheet provides month-by-month and year-to-date analysis.
Q5: Do I need advanced Excel knowledge to use this dashboard?
No, it’s ready-to-use with clear input fields and prebuilt charts.
Conclusion
The Fitness Studio KPI Dashboard in Google Sheets is a comprehensive tool for tracking memberships, attendance, revenue, and trainer performance. By consolidating data into a single, interactive dashboard, fitness studio managers can make data-driven decisions, improve operations, and enhance member engagement.