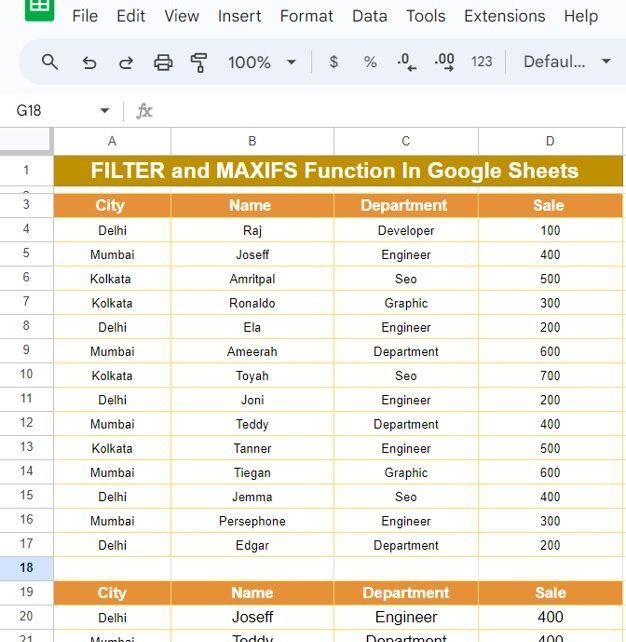
Hello, spreadsheet wizards! Have you ever found yourself sifting through heaps of data, wishing there was a simpler way to calculate averages for specific groups? Well, you’re in luck! Today, we’re diving into the AVERAGEIF Formula In Google Sheets. This handy tool is perfect for zeroing in on the data that really matters, making your […]
Tag: data analysis
DGET Function in Google Sheets: A Practical Example
Welcome to our blog post! Today, we’re diving into the fascinating world of Google Sheets and exploring how to use the DGET Function in Google Sheets to pull specific data from a range. If you’ve ever wondered how to extract a precise piece of information from a table, you’re in the right place. Let’s break […]
Visualize Like a Pro: Ultimate Gauge Chart Guide in Google Sheet!
Hey there! Ready to turn your Google Sheets into a powerful dashboard? Well, you’re in luck because today we’re diving into the world of Ultimate Gauge Chart Guide in Google Sheet! These charts are not just cool to look at; they’re incredibly useful for visualizing data like service levels. So, let’s get started and show […]
Pivot Table Guide for Google Sheets
Pivot tables are a powerful tool in Google Sheets, enabling users to summarize, analyze, explore, and present data comprehensively. This article is Pivot Table Guide for Google Sheets creating, using, and optimizing pivot tables in Google Sheets, leveraging straightforward examples and practical tips. What is a Pivot Table in Google Sheets? A pivot table is […]


