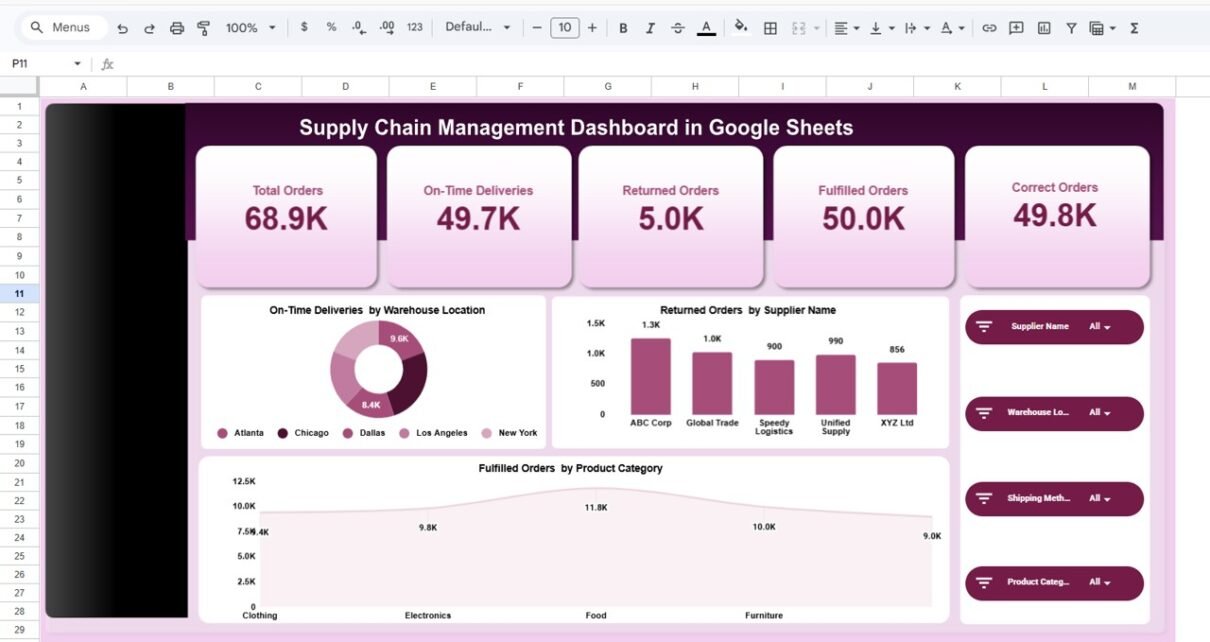
Managing order cycle time is one of the most important responsibilities in supply chain operations. When you measure order cycle time correctly, you understand how fast your business processes customer orders, how well your team handles delays, and how efficiently your supply chain performs from end to end. Today, many companies still track cycle times […]
Tag: KPI Dashboard Template
Freight Cost KPI Dashboard in Google Sheets
Managing freight costs remains one of the biggest challenges in logistics and supply chain operations. Transport rates change often, fuel prices rise without warning, and delays create additional expenses. When teams track this information manually, they struggle to identify trends, compare monthly performance, and take quick action. However, a Freight Cost KPI Dashboard in Google […]
Rehabilitation Center KPI Dashboard in Google Sheets
Running a rehabilitation center is not just about providing quality care — it’s also about measuring and improving outcomes, managing operations efficiently, and ensuring sustainability. To achieve these goals, having access to real-time performance insights is essential. That’s where the Rehabilitation Center KPI Dashboard in Google Sheets becomes a game-changer. This ready-to-use, interactive dashboard enables […]
Substance Abuse Center KPI Dashboard in Google Sheets
Managing and improving the performance of a Substance Abuse Treatment Center requires precise tracking of key metrics such as admissions, relapse rates, counselor workload, patient recovery progress, and resource utilization. Without structured data analysis, decision-making can easily become reactive rather than proactive. That’s where the Substance Abuse Center KPI Dashboard in Google Sheets comes in. […]
Mental Health Services KPI Dashboard in Google Sheets
Managing mental health services involves tracking complex data — patient progress, staff workload, service quality, and treatment outcomes. Without structured data visualization, teams may miss early warning signs or operational inefficiencies. That’s why the Mental Health Services KPI Dashboard in Google Sheets is a game-changer. This interactive and ready-to-use dashboard helps healthcare professionals, administrators, and […]
Meal Prep Business KPI Dashboard in Google Sheets
Running a meal prep business can be exciting, rewarding, and challenging — all at once. From managing daily orders and customer preferences to controlling food costs and delivery efficiency, there are countless metrics to monitor. Without the right tools, keeping track of these numbers can become a full-time job. That’s why the Meal Prep Business […]
Craft Brewery KPI Dashboard in Google Sheets
Running a successful craft brewery takes more than creativity and passion for beer — it requires precise data tracking, smart decision-making, and efficient performance monitoring. With competition growing and production costs fluctuating, brewery owners and managers need real-time visibility into their operations. That’s where the Craft Brewery KPI Dashboard in Google Sheets becomes a game-changer. […]
Fan Engagement KPI Dashboard in Google sheets
In today’s digital era, fans are not just spectators—they are active participants who shape the success of sports teams, entertainment brands, musicians, and content creators. Measuring and improving fan engagement is essential for sustaining long-term loyalty and growth. The Fan Engagement KPI Dashboard in Google Sheets provides a simple yet powerful way to track engagement […]
Subscription Box KPI Dashboard in Google Sheets
Managing a subscription box business requires keeping track of multiple key metrics, from subscriber growth to retention rates, revenue per subscriber, and fulfillment efficiency. The Subscription Box KPI Dashboard in Google Sheets is a ready-to-use tool that centralizes all performance metrics, helping subscription box businesses monitor, analyze, and optimize their operations.Subscription Box KPI Dashboard in […]


