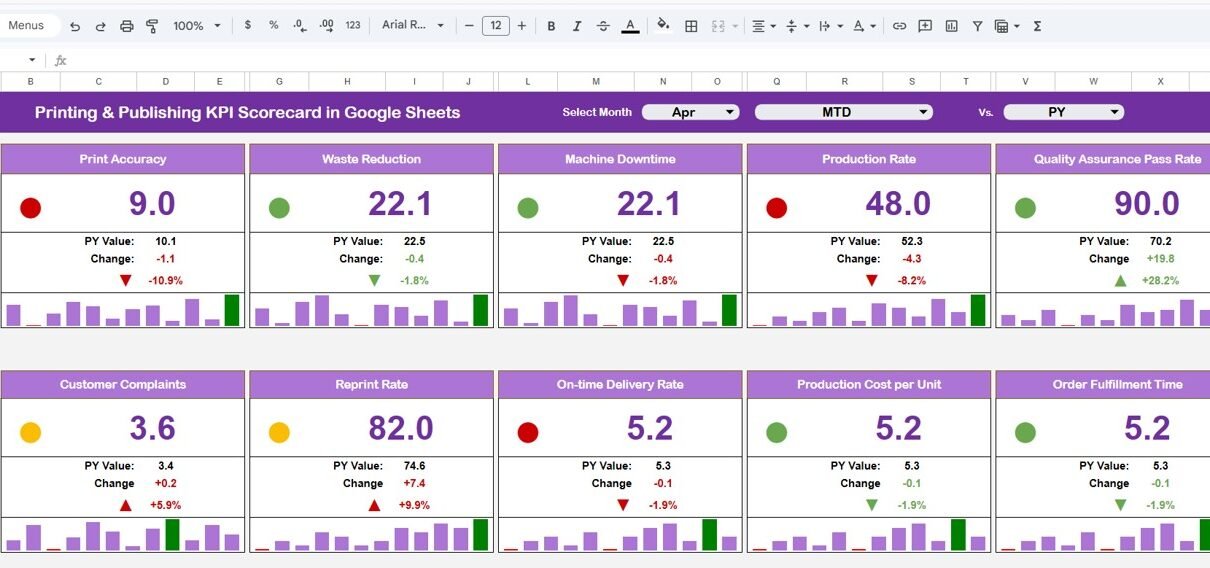
This ready-to-use template helps you monitor 10 important sports KPIs in one interactive scorecard. Furthermore, it allows you to switch between MTD (Month-to-Date) and YTD (Year-to-Date) views instantly. Therefore, you gain full control over athlete and team performance. What Is a Sports KPI Scorecard in Google Sheets? A Sports KPI Scorecard in Google Sheets is […]
Tag: MTD YTD dashboard
Freelancer KPI Dashboard in Google Sheets
Freelancing gives you freedom. However, freedom without structure creates confusion. Many freelancers work hard every month, yet they still struggle to measure growth clearly. As a result, income becomes unstable, productivity drops, and long-term planning suffers. So, how can you manage your freelance business like a professional company? The answer is simple. You need a […]
After-Sales Service KPI Dashboard in Google Sheets
Customer relationships do not end after a sale. In fact, they begin there. However, many businesses struggle to track service performance effectively. As a result, customer satisfaction drops, complaints increase, and retention suffers. So, how can you monitor service quality, response time, resolution rate, and team efficiency in one centralized system? You need an After-Sales […]
Aerospace KPI Scorecard in Google Sheets
The aerospace industry demands precision, compliance, and operational excellence. Every delay affects contracts. Every defect impacts safety. Every missed target reduces profitability. Therefore, aerospace companies must track performance with clarity and discipline. However, many organizations still depend on scattered spreadsheets. As a result, managers struggle to compare targets. Moreover, leadership teams fail to detect performance […]
Crisis Response KPI Dashboard in Google Sheets
During emergencies, incidents, or unexpected disruptions, organizations must respond quickly, accurately, and efficiently. Whether it is a natural disaster, IT outage, security incident, health emergency, or operational crisis, decision-makers need real-time visibility into response performance. However, many teams still rely on manual reports, scattered spreadsheets, or delayed updates, which slow down critical actions. That is […]
Revenue Growth KPI Dashboard in Google Sheets
Every business wants to grow consistently, improve revenue quality, and understand what drives performance. Because markets shift fast and customer behavior changes often, leaders need real-time insights that support quick and confident decisions. A Revenue Growth KPI Dashboard in Google Sheets does exactly that. It turns raw financial numbers into simple visuals, clear comparisons, and […]
Freight Cost KPI Dashboard in Google Sheets
Managing freight costs remains one of the biggest challenges in logistics and supply chain operations. Transport rates change often, fuel prices rise without warning, and delays create additional expenses. When teams track this information manually, they struggle to identify trends, compare monthly performance, and take quick action. However, a Freight Cost KPI Dashboard in Google […]
Project Management KPI Scorecard in Google Sheets
Tracking the success of multiple projects requires consistent performance monitoring. The Project Management KPI Scorecard in Google Sheets is a ready-to-use template designed to simplify performance tracking using visual scorecards, dynamic indicators, and trend analysis.Project Management KPI Scorecard in Google Sheets In this article, we’ll explain how this KPI Scorecard works, its key features, advantages, […]
Winery KPI Dashboard in Google Sheets
Managing a winery requires monitoring multiple aspects such as production, sales, inventory, and distribution. The Winery KPI Dashboard in Google Sheets provides a ready-to-use solution for tracking key performance indicators (KPIs), analyzing trends, and making data-driven decisions. In this article, we’ll explain the features, advantages, best practices, and frequently asked questions about this winery dashboard. […]
Resource Allocation Dashboard in Google Sheets
Effective resource management is critical for project success. The Resource Allocation Dashboard in Google Sheets helps managers track resource utilization, allocation, and productivity efficiently. This ready-to-use dashboard provides real-time insights to optimize workforce allocation across departments, projects, and roles.Resource Allocation Dashboard in Google Sheets In this article, we will explain the key features, benefits, and […]


