In today’s fast-changing education and workforce development landscape, vocational training institutes play a vital role in equipping students with industry-ready skills. These institutes handle massive amounts of performance data — from student enrollment and attendance to certification success rates and placement outcomes. However, managing and analyzing these metrics manually can become time-consuming and error-prone. That’s […]
Tag: Performance Tracking
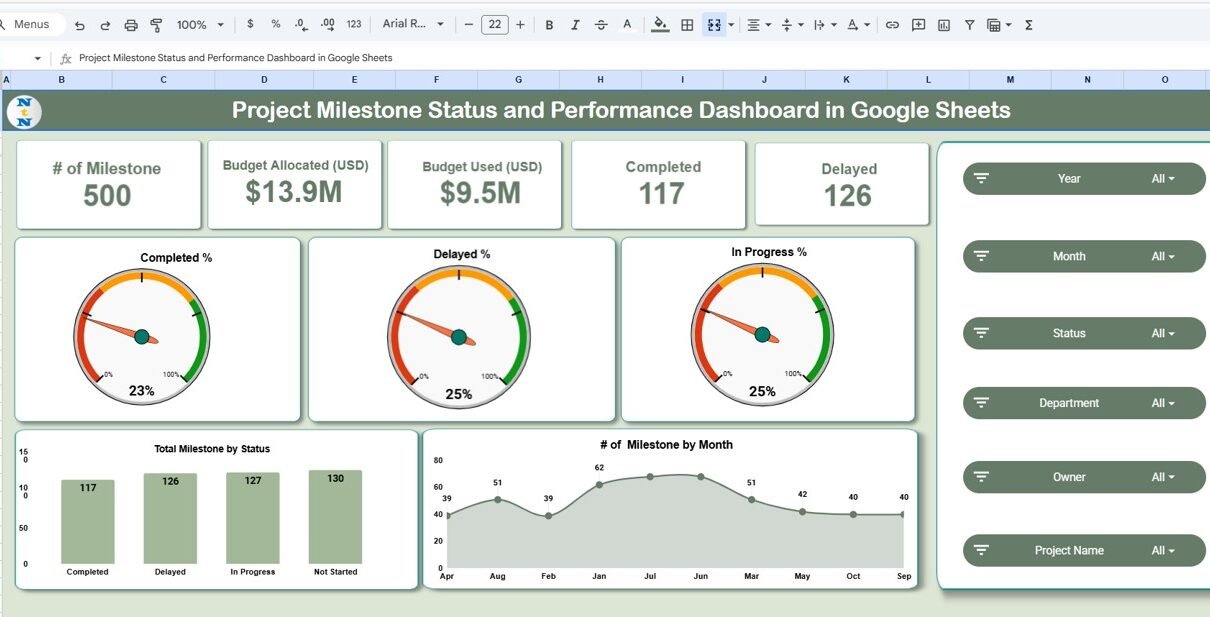
Project Milestone Status and Performance Dashboard in Google Sheets
Managing multiple project milestones can be challenging without proper visibility into progress, budgets, and delays. The Project Milestone Status and Performance Dashboard in Google Sheets is a ready-to-use tool designed to simplify project tracking and performance management.Project Milestone Status and Performance Dashboard in Google Sheets This dashboard provides a structured, visual representation of milestones across […]
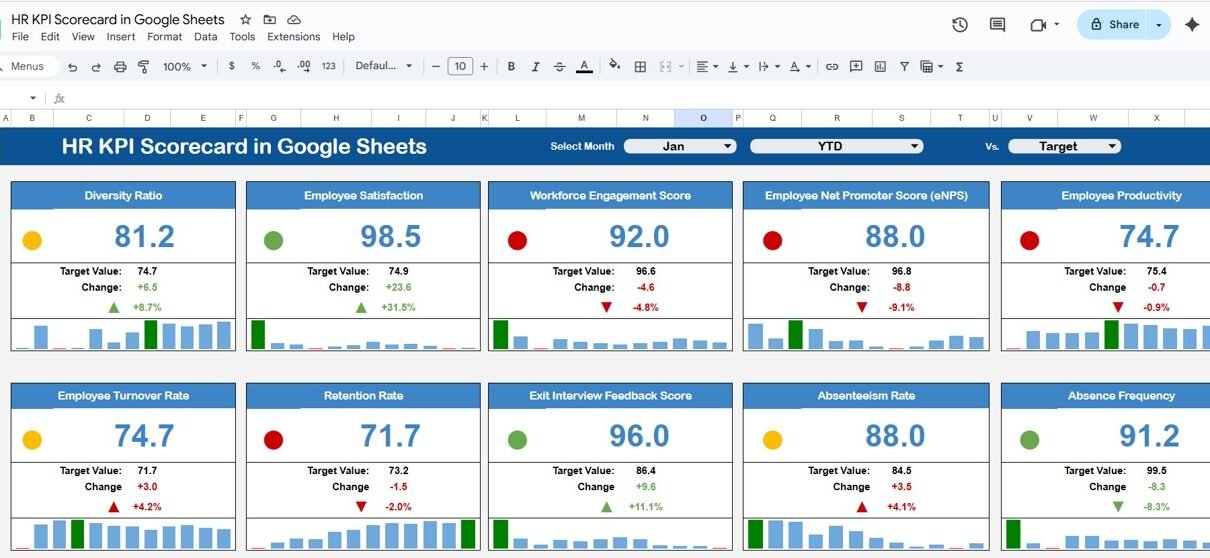
HR KPI Scorecard in Google Sheets
Human Resources (HR) plays a critical role in the success of any organization. Monitoring key metrics such as employee turnover, training effectiveness, recruitment efficiency, and employee engagement is essential for informed decision-making. The HR KPI Scorecard in Google Sheets provides a ready-to-use template to track, analyze, and visualize HR performance in a structured and easy-to-understand […]
Performance Review Calendar in Google Sheets
Performance reviews are a critical part of any organization’s HR strategy. They help assess employee productivity, identify skill gaps, and plan career growth. Managing these reviews, especially for large teams, can be challenging without a centralized system. A Performance Review Calendar in Google Sheets provides an efficient solution to organize, schedule, and track performance evaluations. […]
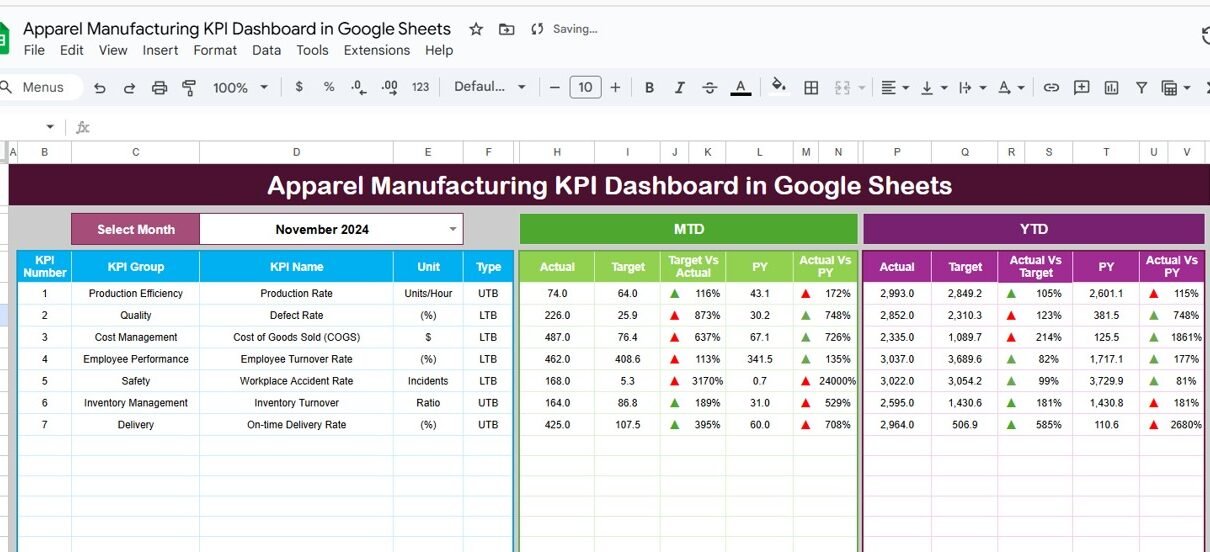
Apparel Manufacturing KPI Dashboard in Google Sheets
In the highly competitive apparel manufacturing industry, keeping track of key performance indicators (KPIs) is essential for maximizing efficiency, reducing costs, and maintaining high-quality standards. That’s why we have developed the Apparel Manufacturing KPI Dashboard in Google Sheets — a ready-to-use, easy-to-customize tool to help manufacturers monitor their crucial metrics effectively.Apparel Manufacturing KPI Dashboard in […]
Market Research KPI Dashboard in Google Sheets
Market research is crucial for businesses to understand consumer behavior, market trends, and make data-driven decisions. The Market Research KPI Dashboard in Google Sheets is designed to streamline the analysis and tracking of various key performance indicators (KPIs) for market research purposes. This dashboard includes multiple worksheets and metrics to help you monitor performance, set […]
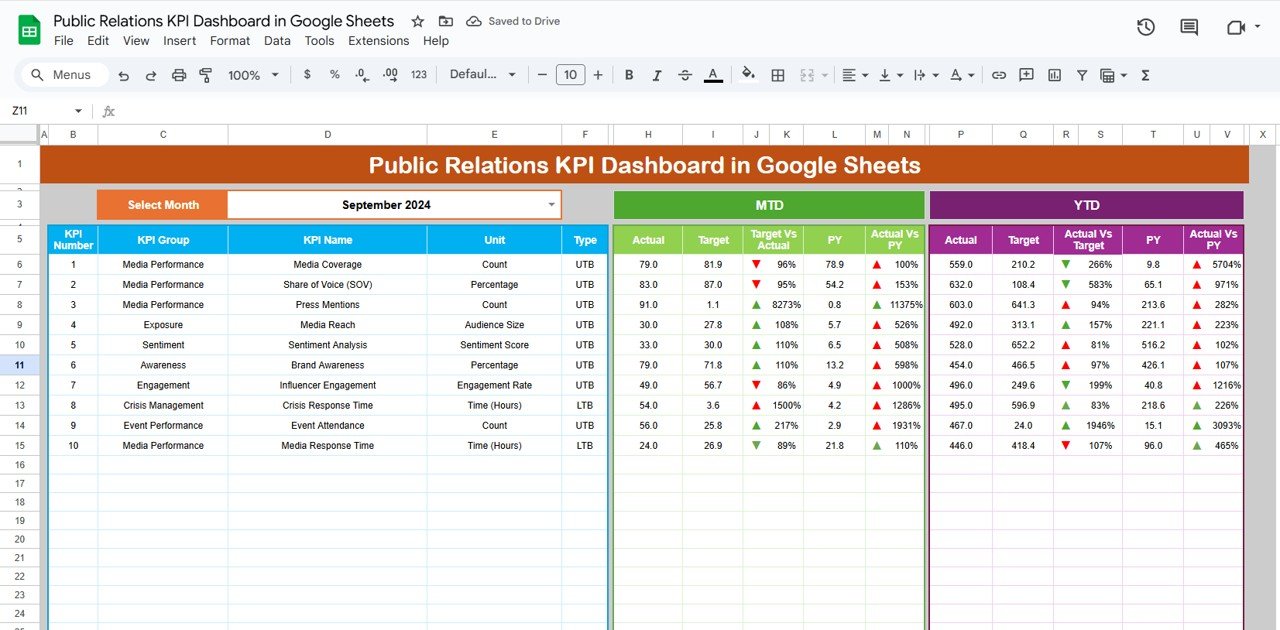
Public Relations KPI Dashboard in Google Sheets
Tracking the effectiveness of your public relations (PR) campaigns is crucial to achieving brand visibility and improving stakeholder relationships. The Public Relations KPI Dashboard in Google Sheets is a ready-to-use template that helps you track key performance indicators (KPIs) related to your PR efforts. This dashboard provides a clear overview of your PR campaigns and […]
Document Management KPI Dashboard in Google Sheets
In today’s fast-paced business environment, document management is critical for maintaining organizational efficiency. The Document Management KPI Dashboard in Google Sheets is an essential tool that helps organizations track key performance indicators (KPIs) related to document processing, storage, and retrieval. This article will explain the key features of the Document Management KPI Dashboard, how it […]
Enterprise Resource Planning KPI Dashboard in Google Sheets
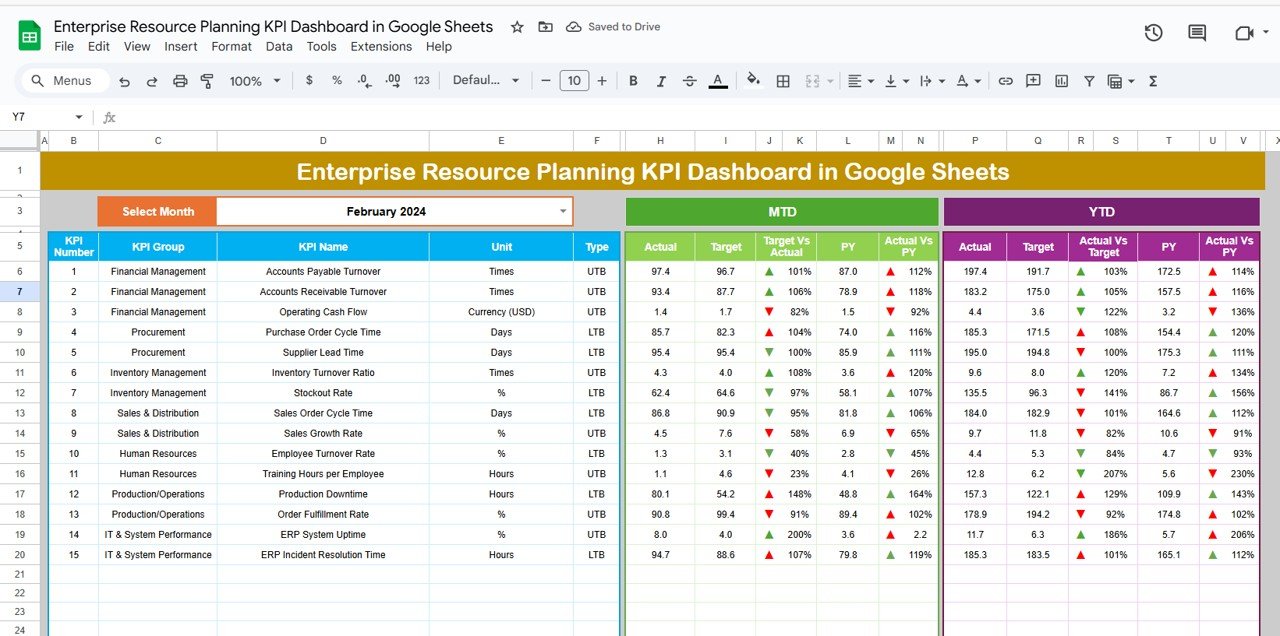
Managing an enterprise involves overseeing a vast array of processes, from finance and sales to human resources and supply chain operations. Enterprise Resource Planning (ERP) systems integrate these processes into a unified system. To track and monitor the effectiveness of an ERP system, it’s essential to measure specific key performance indicators (KPIs). The Enterprise Resource […]
Humanitarian Aid KPI Dashboard in Google Sheets
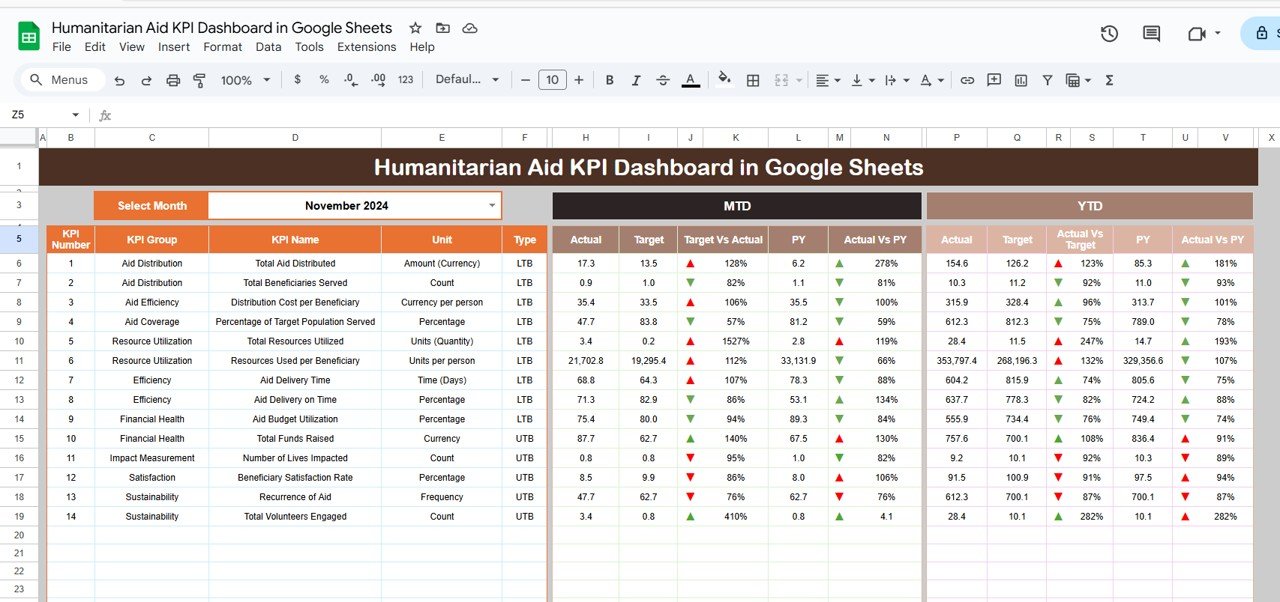
Humanitarian aid organizations play a critical role in delivering support to communities in need. Tracking the performance of these aid initiatives is essential to ensure that resources are allocated efficiently, goals are met, and the impact is maximized. The Humanitarian Aid KPI Dashboard in Google Sheets is an essential tool for measuring the effectiveness of […]
