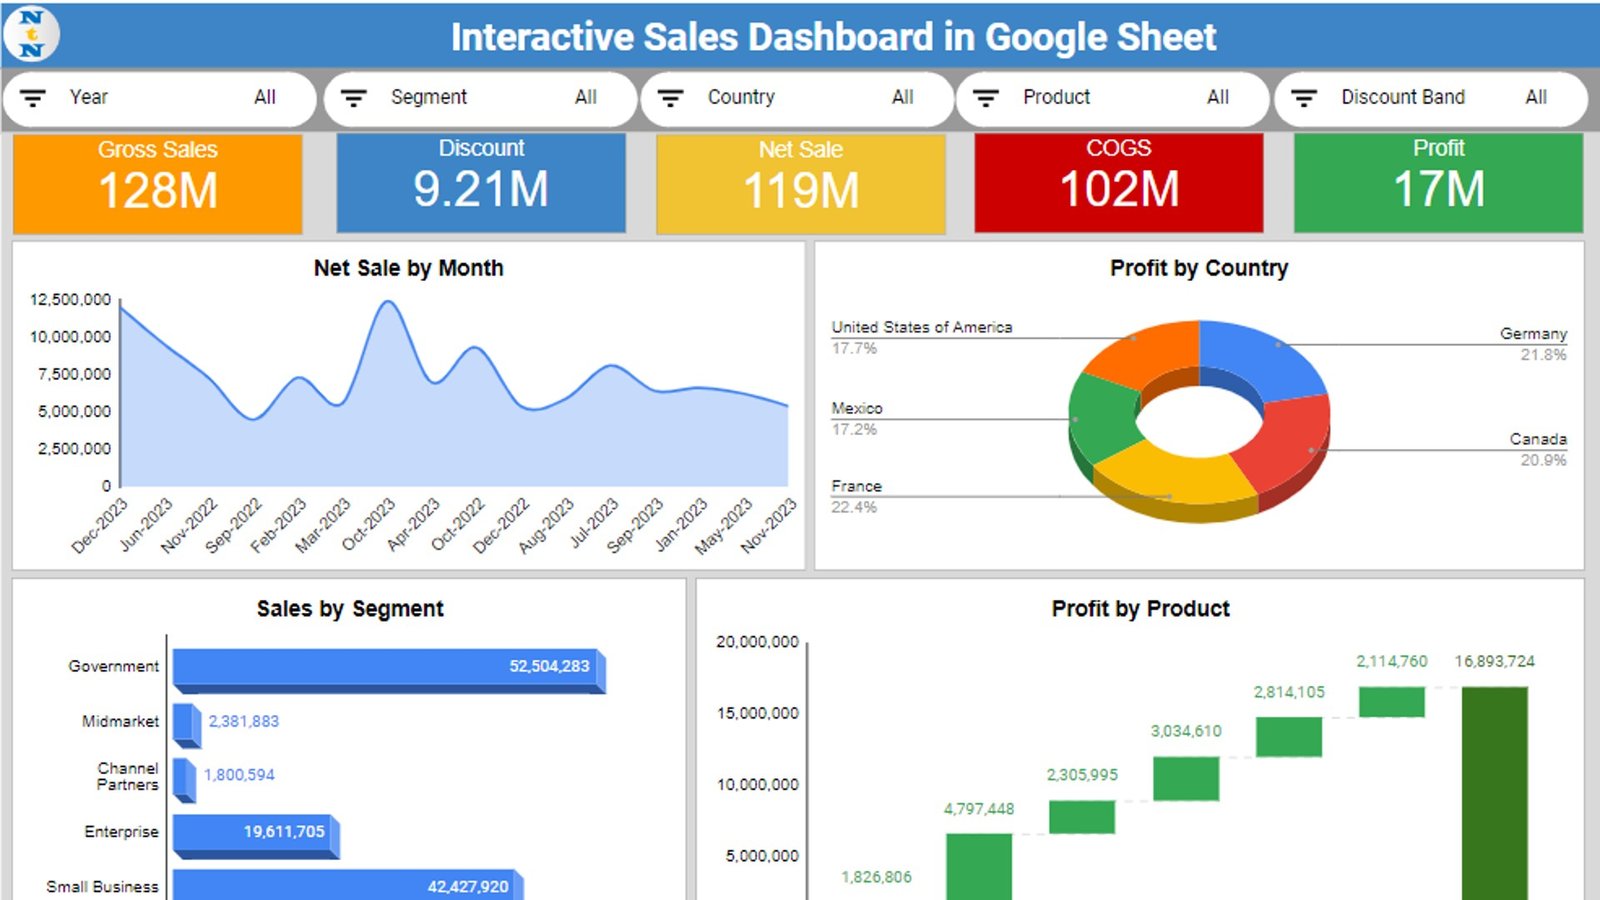
In today’s fast-paced data-driven world, businesses need efficient tools to analyze and visualize information quickly. Google Sheets is one such tool that offers both flexibility and functionality when it comes to data management and visualization. One of its powerful features is the ability to create dynamic dashboards, which help decision-makers track performance, trends, and other […]

Tag: Performance Tracking
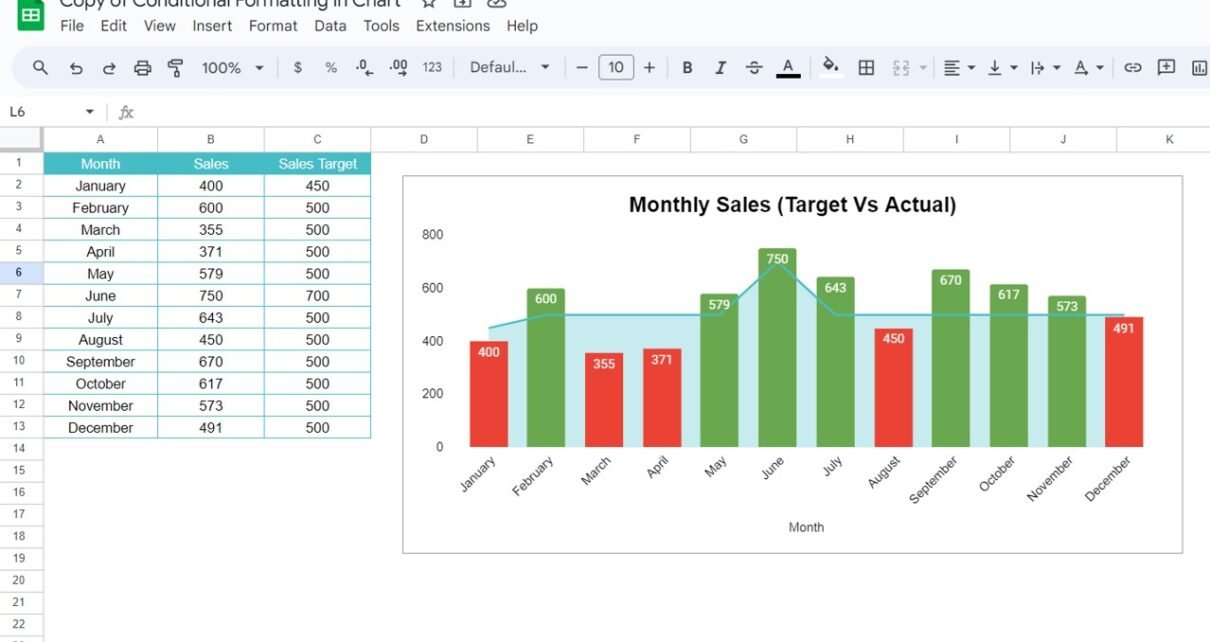
Conditional formatting in Google Sheet Chart
In the bustling world of business analytics, visual data representation isn’t just about showing numbers; it’s about telling a story. Google Sheets offers a powerful tool—Conditional formatting in Google Sheet Chart—that helps you narrate this story more effectively. Whether it’s a sales dashboard or a daily report, understanding how to apply conditional formatting can transform […]
Sales KPI dashboard in Google Sheet
In this article, we have explained our latest google sheet template Sales KPI Dashboard. In today’s fast-paced business environment, tracking and analyzing sales performance is crucial for any organization. Out latest template of Sales KPI Dashboard in Google Sheets offers a dynamic and accessible way to visualize your sales data. It empowers your Sales team […]