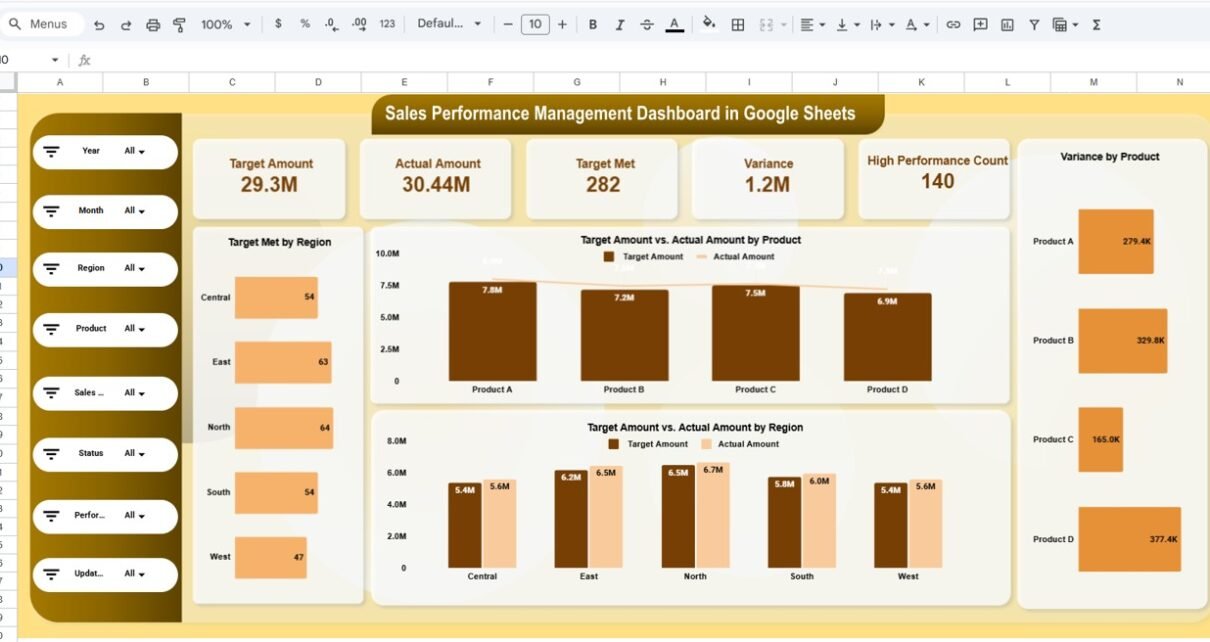
The AR-VR Industry KPI Dashboard in Google Sheets is an essential tool for businesses in the augmented reality (AR) and virtual reality (VR) industries. It provides a powerful way to track key performance indicators (KPIs) that measure business success across various aspects of AR and VR development and operations. In this article, we’ll walk you […]
Tag: revenue tracking
Petroleum Industry KPI Dashboard in Google Sheets
The petroleum industry relies heavily on efficient operations, safety management, and profitability metrics. To ensure that business goals are met, it’s essential to track key performance indicators (KPIs). The Petroleum Industry KPI Dashboard in Google Sheets is a powerful tool designed to help industry professionals track and measure vital performance metrics in real-time. This dashboard […]
Mobile App Performance KPI Dashboard in Google Sheets
A Mobile App Performance KPI Dashboard is a tool used by developers, product managers, and marketers to monitor key metrics and evaluate the performance of a mobile application. The dashboard consolidates essential data from various areas such as user acquisition, retention, in-app activities, and revenue generation. By tracking KPIs, teams can assess the app’s success, […]
Music Industry KPI Dashboard in Google Sheets
In this article, we will explore how to create a Music Industry KPI Dashboard in Google Sheets. This dashboard template is ready to use and designed to track the key performance indicators (KPIs) for the music industry. Below are the key features and functions of the dashboard. Key Features of the Music Industry KPI Dashboard […]
Finance KPI Dashboard in Google Sheets
In today’s fast-paced financial environment, companies must stay on top of their performance by continuously monitoring key metrics. The most effective way to manage these metrics is through a Finance KPI Dashboard. In this article, we’ll explore how a Finance KPI Dashboard in Google Sheets can streamline financial tracking, making it easier for businesses to […]