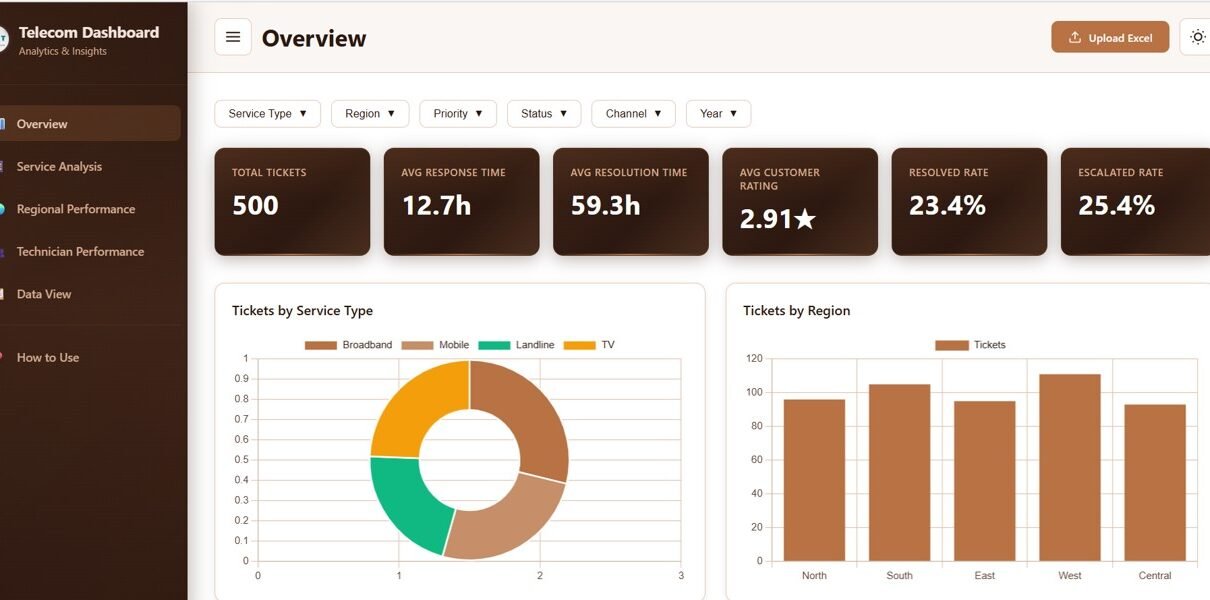
Telecommunications Dashboard in HTML is an interactive, browser-based analytics solution for tracking network performance, customer metrics, revenue, and service quality with dynamic charts and filters.
Online Tutorial for Data Analysis and Automation
Telecommunications Dashboard in HTML is an interactive, browser-based analytics solution for tracking network performance, customer metrics, revenue, and service quality with dynamic charts and filters.
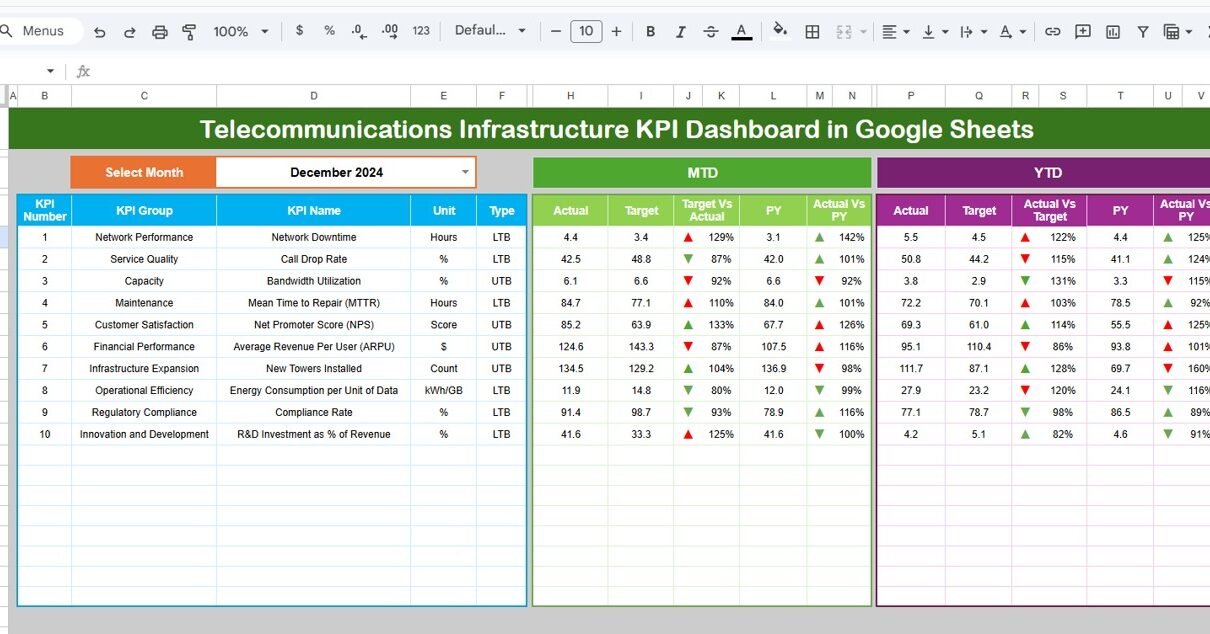
Telecommunications infrastructure forms the backbone of modern connectivity. Network availability, uptime, capacity, and service reliability directly impact customer satisfaction and business growth. However, when infrastructure KPIs remain scattered across multiple spreadsheets or reports, teams struggle to track performance accurately. As a result, network issues stay hidden, and corrective actions get delayed. That is exactly where […]
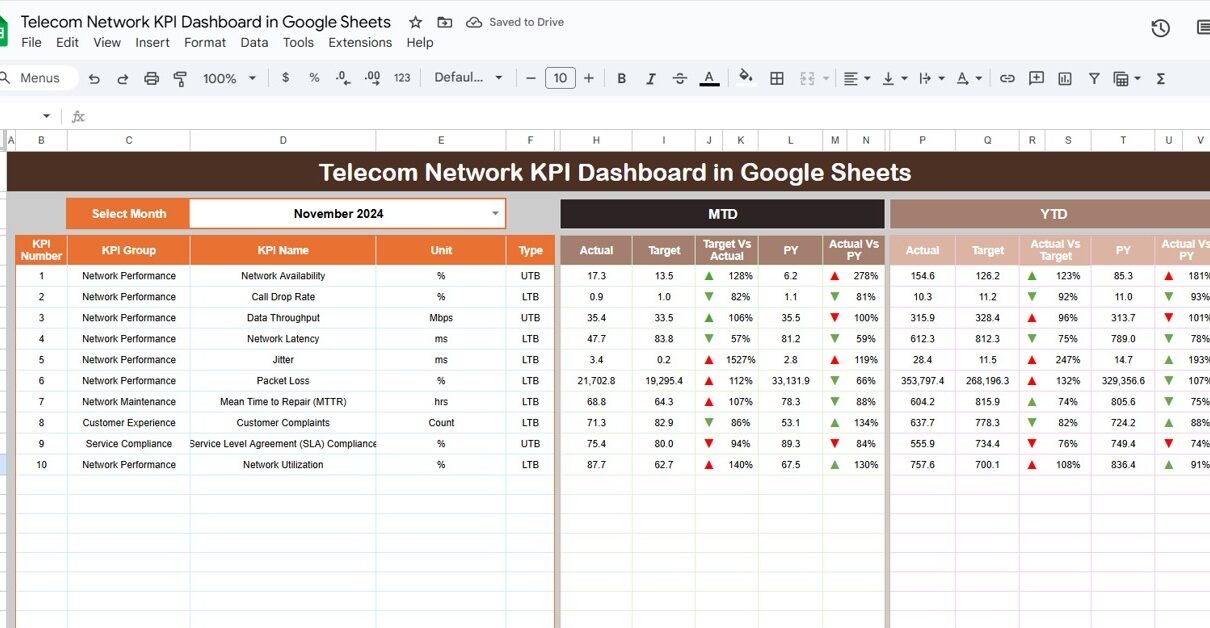
Telecom networks are complex systems that require continuous monitoring to ensure optimal performance, reliability, and customer satisfaction. Tracking key performance indicators (KPIs) is essential for telecom operators to identify issues, improve network quality, and make data-driven decisions. A Telecom Network KPI Dashboard in Google Sheets provides an interactive, ready-to-use solution to monitor, visualize, and analyze […]