Tech support teams directly impact customer satisfaction, system uptime, and business productivity. Every delayed response, unresolved ticket, or missed SLA affects both users and business operations. However, many organizations still track tech support performance using basic spreadsheets or scattered tools. As a result, teams lose visibility, efficiency drops, and service quality suffers.Tech Support Efficiency KPI Dashboard in Google Sheets
A Tech Support Efficiency KPI Dashboard in Google Sheets solves these challenges by providing a centralized, ready-to-use performance tracking system. It converts raw support data into meaningful KPIs, trends, and comparisons. Because this dashboard runs in Google Sheets, it remains simple, flexible, collaborative, and cost-effective.
In this article, we explain how this dashboard works, its worksheet structure, all KPIs with formulas and definitions, advantages, improvement opportunities, best practices, and frequently asked questions.
What Is a Tech Support Efficiency KPI Dashboard in Google Sheets?
A Tech Support Efficiency KPI Dashboard is a performance management tool designed to monitor and improve the efficiency of IT support and helpdesk operations. It tracks ticket volume, response time, resolution quality, SLA performance, agent productivity, and support costs in one place.
Instead of reviewing multiple reports, managers view real-time performance through a single dashboard. This helps teams identify bottlenecks early and take corrective action quickly.
Because the dashboard uses Google Sheets, it offers:
- Real-time updates
- Automated calculations
- Month-to-date (MTD) and year-to-date (YTD) tracking
- Easy collaboration
- Zero software cost
Key Worksheets in the Tech Support Efficiency KPI Dashboard
Click to Buy Tech Support Efficiency KPI Dashboard in Google Sheets
The dashboard contains 6 structured worksheet tabs, each serving a specific purpose.
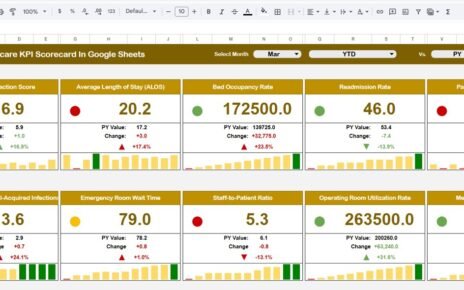
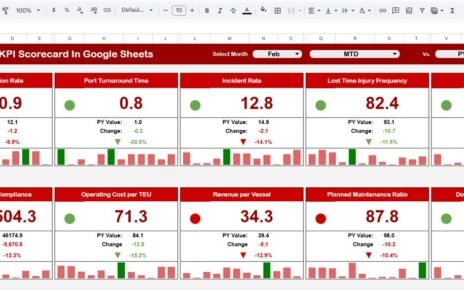
1. Dashboard Sheet Tab (Main Dashboard)
This is the primary reporting page.
-
Select the month using the dropdown in cell D3
-
The dashboard updates automatically for the selected month
MTD Section Includes
-
MTD Actual
-
MTD Target
-
MTD Previous Year
-
Target vs Actual
-
Previous Year vs Actual
YTD Section Includes
-
YTD Actual
-
YTD Target
-
YTD Previous Year
-
Target vs Actual
-
Previous Year vs Actual
Conditional formatting with up/down arrows highlights performance trends:
-
Green arrow → performance improved
-
Red arrow → performance declined

Click to Buy Tech Support Efficiency KPI Dashboard in Google Sheets
2. KPI Trend Sheet Tab
This sheet supports detailed KPI analysis.
-
Select a KPI from the dropdown in cell C3
The sheet displays:
-
KPI Group
-
KPI Unit
-
KPI Type (Lower the Better / Upper the Better)
-
KPI Formula
-
KPI Definition
It also shows a month-wise trend chart, making it easier to evaluate performance patterns.

3. Actual Number Sheet Tab
This sheet is used to enter actual performance values.
-
Enter MTD Actual and YTD Actual
-
Set the first month of the year in cell E1
Once values update, the dashboard refreshes automatically.

Click to Buy Tech Support Efficiency KPI Dashboard in Google Sheets
4. Target Sheet Tab
This sheet stores performance benchmarks.
-
MTD target for each KPI
-
YTD target for each KPI
Targets help teams measure success against service goals.

5. Previous Year Number Sheet Tab
This sheet stores last year’s performance values.
It allows:
-
Year-over-year comparison
-
Trend analysis
-
Service maturity evaluation

Click to Buy Tech Support Efficiency KPI Dashboard in Google Sheets
6. KPI Definition Sheet Tab
This reference sheet ensures clarity and standardization.
It includes:
-
KPI Name
-
KPI Group
-
Unit
-
Formula
-
Definition
-
KPI Type (LTB / UTB)

Advantages of the Tech Support Efficiency KPI Dashboard
-
Centralized performance visibility
-
Faster issue identification
-
Improved SLA compliance
-
Better workload balancing
-
Data-driven staffing decisions
-
Higher customer satisfaction
-
Works without expensive tools
Opportunities for Improvement
Click to Buy Tech Support Efficiency KPI Dashboard in Google Sheets
-
Integrate Zendesk, Freshdesk, Jira
-
Add channel-wise analysis
-
Implement SLA breach alerts
-
Add predictive ticket trends
-
Monitor severity-wise resolution
Best Practices for Using the Dashboard
-
Update data consistently
-
Review trends monthly
-
Set realistic SLA targets
-
Focus on first-contact resolution
-
Optimize knowledge base usage
-
Share KPI insights with agents
Conclusion
Click to Buy Tech Support Efficiency KPI Dashboard in Google Sheets
The Tech Support Efficiency KPI Dashboard in Google Sheets enables organizations to measure, monitor, and improve IT support performance effectively. It turns operational data into actionable insights while remaining simple, flexible, and collaborative. With proper KPI tracking and trend analysis, tech support teams improve response time, reduce costs, and deliver better customer experiences.
Frequently Asked Questions (FAQs)
1. Who should use this dashboard?
IT support managers, helpdesk teams, service leaders.
2. Can KPIs be customized?
Yes, all KPIs are fully editable.
3. Does it support MTD and YTD reporting?
Yes, both views are available.
4. Can data entry be automated?
Yes, using Google Apps Script or APIs.
5. Is Google Sheets secure for support data?
Yes, with proper access control.
Visit our YouTube channel to learn step-by-step video tutorials
Youtube.com/@NeotechNavigators
Watch the step-by-step video tutorial:
Click to Buy Tech Support Efficiency KPI Dashboard in Google Sheets