Transportation and Logistics Dashboard in HTML is a comprehensive, browser-based analytics tool that empowers logistics professionals to monitor shipments, evaluate carrier performance, analyze geographic routes, and track monthly trends from a single interactive interface. If you are managing complex supply chain operations and need a centralized view of your transportation data, this dashboard is your ideal solution.
👉 Click here to Purchase the Transportation and Logistics Dashboard in HTML
In the modern logistics landscape, data is scattered across multiple systems and spreadsheets. This makes it incredibly difficult to gain real-time visibility into shipment status, costs, and performance. However, this Transportation and Logistics Dashboard in HTML solves that problem by consolidating all your critical metrics into one elegant, easy-to-use web dashboard.
Key Features of Transportation and Logistics Dashboard in HTML
This HTML dashboard is packed with powerful features that make logistics management effortless. The multi-page layout provides dedicated views for overview metrics, carrier analysis, geographic routes, monthly trends, and a full data explorer. Each page is equipped with dynamic slicers and filters that allow you to drill down into specific segments of your data.
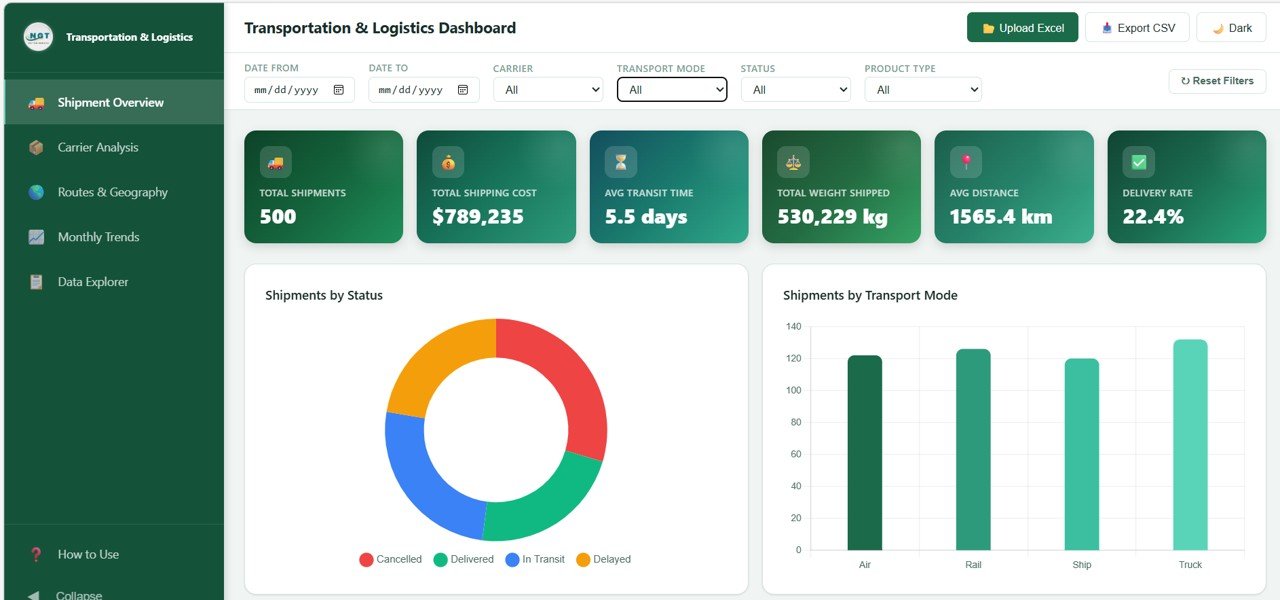
The dashboard tracks six essential KPI cards on the Overview page, including Total Shipments, Total Shipping Cost, Average Transit Time, Total Weight Shipped, Average Distance, and Delivery Rate. These cards give you an instant health check of your entire logistics operation. Additionally, the interactive charts provide visual breakdowns that make complex data easy to understand at a glance.
The browser-based design means you do not need any special software installation. Simply open the HTML file in Chrome, Firefox, Edge, or Safari and you are ready to analyze. The responsive layout also ensures a seamless experience across desktops, laptops, and tablets.
Dashboard Pages Explained
1. Overview Page
The Overview Page serves as your central command center. At the top, six KPI cards display Total Shipments, Total Shipping Cost, Average Transit Time, Total Weight Shipped, Average Distance, and Delivery Rate. These cards provide a high-level snapshot of your logistics performance at any given time.
Below the cards, you will find five insightful visual analyses. Shipments by Status helps you quickly identify how many shipments are delivered, in transit, or delayed. Shipments by Transport Mode breaks down your shipment volume across road, rail, air, and sea. Top Carriers by Shipment Volume highlights your most active shipping partners. Cost Distribution by Product Type reveals which product categories consume the most shipping budget. Finally, Monthly Shipment Trend shows the flow of shipments over time so you can spot seasonal patterns and growth trends.
Multiple slicers are available on this page so you can filter and view your dashboard data based on specific criteria quickly and efficiently.
👉 Click here to Purchase the Transportation and Logistics Dashboard in HTML
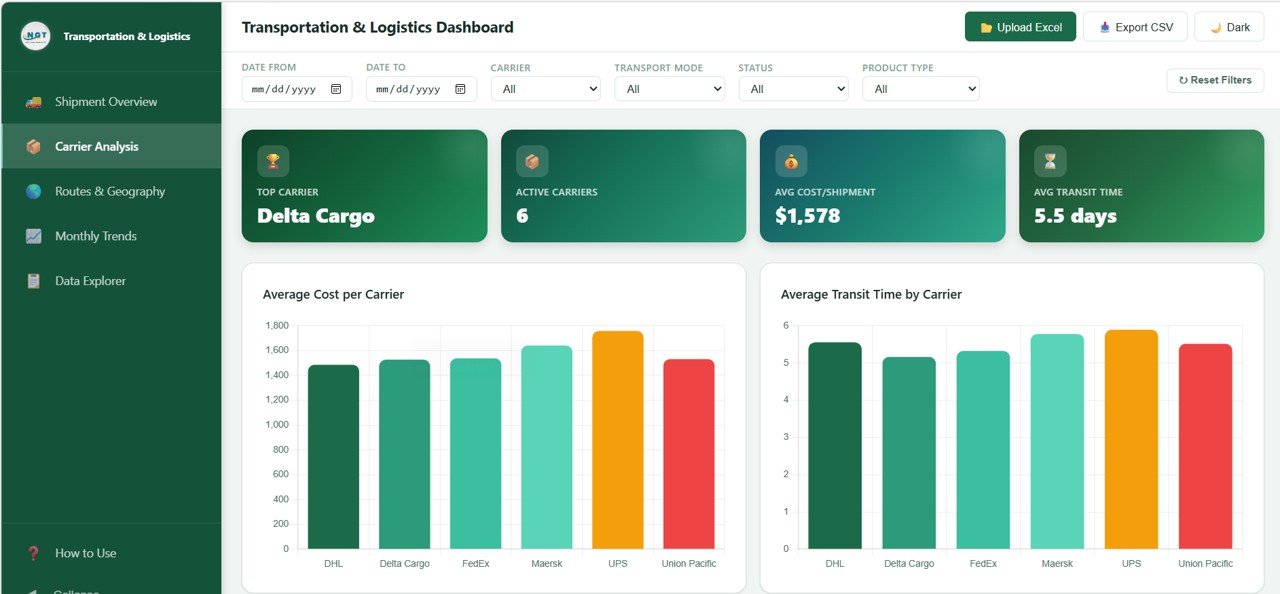
Transportation and Logistics Dashboard2. Carrier Analysis
The Carrier Analysis page dives deep into the performance of your shipping carriers and logistics partners. This page includes four key visual analyses designed to help you evaluate and compare carrier efficiency.
Average Cost per Carrier shows you exactly how much each carrier charges on average, making it easy to identify cost-effective partners. Average Transit Time by Carrier reveals which carriers deliver fastest and which tend to cause delays. Carrier Performance by Status breaks down each carrier’s shipments into delivered, in transit, and delayed categories. Carrier Revenue Share illustrates how revenue is distributed among your carriers, helping you understand partner dependency and diversification opportunities.
 Carrier Analysis
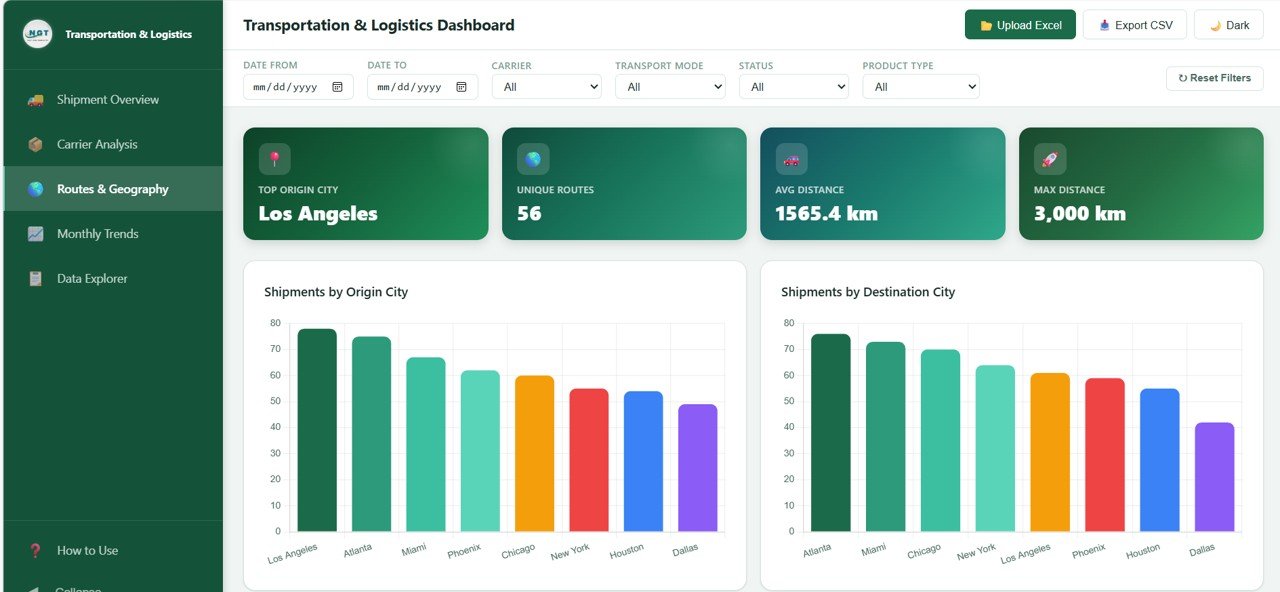
3. Routes and Geography
The Routes and Geography page provides a detailed geographic perspective on your shipping operations. Understanding where your shipments originate and where they are headed is critical for optimizing routes and reducing costs.
👉 Click here to Purchase the Transportation and Logistics Dashboard in HTML
Shipments by Origin City shows which cities generate the most outbound shipments. Shipments by Destination City reveals the most popular delivery destinations. Average Distance by Transport Mode helps you understand how far each mode of transportation is used on average. Top 10 Routes by Volume highlights the busiest shipping lanes so you can focus optimization efforts where they matter most.
👉 Click here to Purchase the Transportation and Logistics Dashboard in HTML
 Routes and Geography
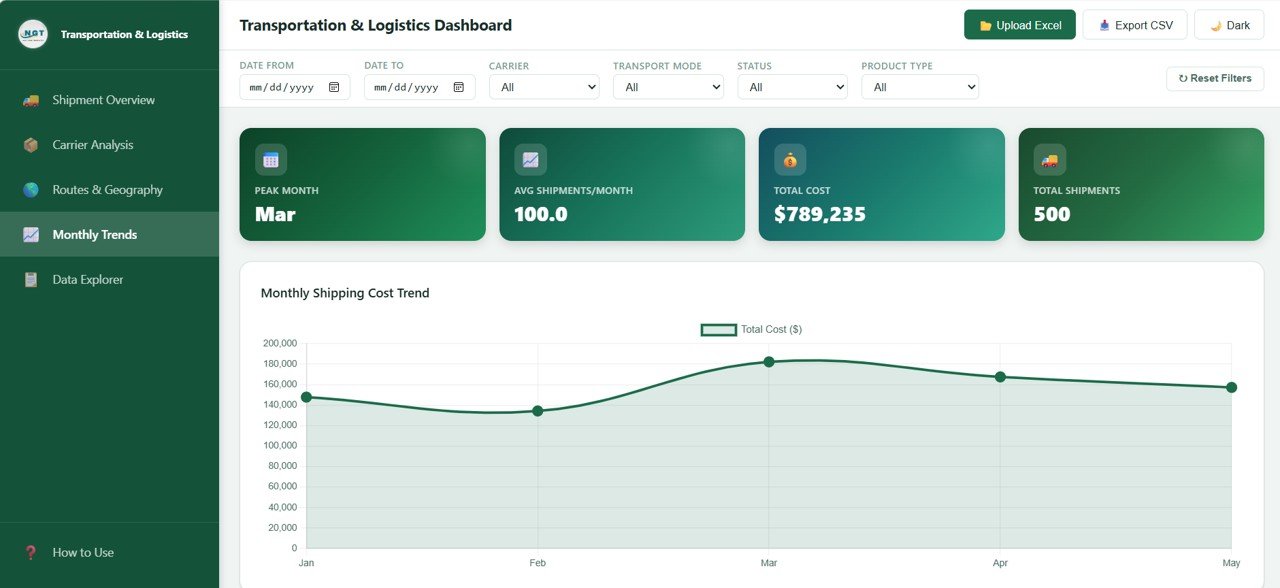
4. Monthly Trends
The Monthly Trends page is essential for strategic planning and long-term decision making. It allows you to track how your key logistics metrics change over time.
Monthly Shipping Cost Trend shows whether your transportation expenses are increasing or decreasing month over month. Monthly Average Transit Time tracks delivery speed changes so you can quickly detect service degradation. Monthly Weight Shipped reveals seasonal demand patterns and capacity planning opportunities. Status Distribution by Month shows how delivery success rates evolve, helping you maintain quality standards consistently.
 Monthly Trends
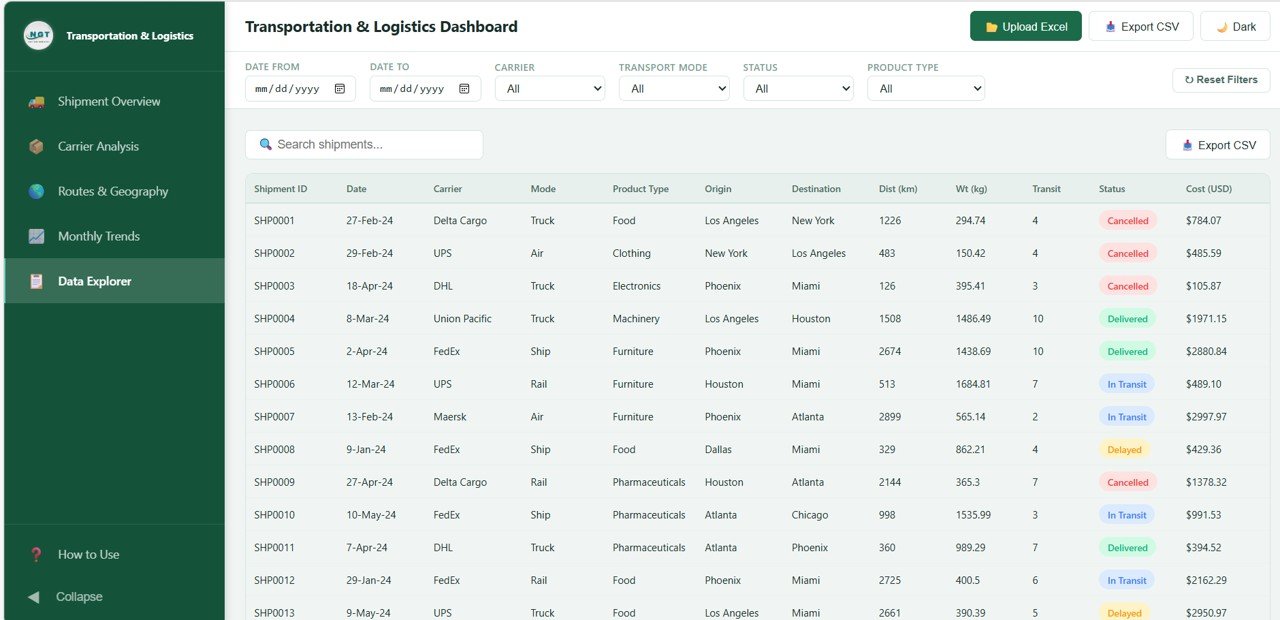
5. Data Explorer
The Data Explorer page gives you direct access to the underlying shipment records in a tabular format. This page is designed for users who need to perform detailed lookups, audits, or data exports.
The searchable shipment data table allows you to quickly find specific records using keyword search. The export to CSV functionality lets you download filtered data for offline analysis in Excel or Google Sheets. Column sorting and filtering enables you to organize and narrow down results based on any field in the dataset.
 Data Explorer
Advantages of Transportation and Logistics Dashboard in HTML
- No Software Required – Works directly in any modern web browser without installations
- Instant Insights – Get real-time visibility into shipments, costs, and performance
- Multi-Dimensional Analysis – Analyze data by carrier, route, time period, transport mode, and more
- Professional Design – Clean, modern UI that is easy to navigate and understand
- Data Export – Export shipment records to CSV for further analysis
- Cost Optimization – Identify expensive carriers and inefficient routes to reduce costs
- Performance Monitoring – Track carrier reliability and delivery success rates over time
Opportunities for Improvement
- Adding live API integration could enable real-time data feeds from logistics platforms
- A map-based visualization for routes would enhance geographic analysis
- Predictive analytics features could forecast shipping volumes and costs
- Email alert integration for delayed shipments would improve proactive management
- Multi-language support would make the dashboard accessible to global teams
- 👉 Click here to Purchase the Transportation and Logistics Dashboard in HTML
Best Practices for Using This Dashboard
- Update your shipment data regularly to ensure accurate and current insights
- Use the Overview page daily for a quick health check of your logistics operations
- Review the Carrier Analysis page monthly to renegotiate contracts with underperforming carriers
- Analyze the Routes page quarterly to identify route optimization opportunities
- Export data from the Data Explorer for detailed reporting and presentations to stakeholders
- Leverage the Monthly Trends page for budget planning and capacity forecasting
Explore Relevant Templates
If you found this dashboard helpful, check out these related templates on NextGenTemplates:
- Port Logistics Dashboard in Power BI – Comprehensive port operations analytics
- Supply Chain Delivery Calendar in Excel – Plan and track delivery schedules
- Explore All Dashboard Templates – Browse our full collection of dashboards
Frequently Asked Questions
What is the Transportation and Logistics Dashboard in HTML?
It is a browser-based interactive dashboard template that helps you track shipments, analyze carrier performance, explore geographic routes, monitor monthly trends, and search shipment records with export functionality.
Do I need any special software to use this dashboard?
No. The dashboard runs entirely in a web browser. Simply open the HTML file in Chrome, Firefox, Edge, or Safari and start analyzing your data immediately.
Can I customize the data in this dashboard?
Yes. The dashboard is designed to work with your own shipment data. You can replace the sample data with your actual logistics records to get personalized insights.
Who should use this logistics dashboard?
This dashboard is ideal for logistics managers, supply chain professionals, warehouse managers, operations analysts, business owners, and freight forwarders who need visibility into their transportation operations.
Can I export data from the dashboard?
👉 Click here to Purchase the Transportation and Logistics Dashboard in HTML
Yes. The Data Explorer page includes an export to CSV feature that allows you to download filtered shipment records for offline analysis in Excel or Google Sheets.
Is this dashboard mobile-friendly?
The dashboard features a responsive design that works well on desktops, laptops, and tablets. For the best experience, a larger screen is recommended due to the data-rich nature of the visuals.
Conclusion
The Transportation and Logistics Dashboard in HTML is an essential tool for anyone managing shipping and logistics operations. With its 5 interactive pages, real-time KPI tracking, carrier analysis, route insights, and data export capabilities, it provides everything you need to make informed decisions and optimize your supply chain.
👉 Click here to Purchase the Transportation and Logistics Dashboard in HTML
For more tutorials on HTML dashboards and logistics analytics, visit our YouTube channel. We regularly publish step-by-step guides to help you get the most out of your templates.
👉 YouTube.com/@NeoTechNavigators
For additional resources on web development and dashboard design, check out MDN Web Docs and Chart.js Documentation.
👉 Click here to Purchase the Transportation and Logistics Dashboard in HTML
tt