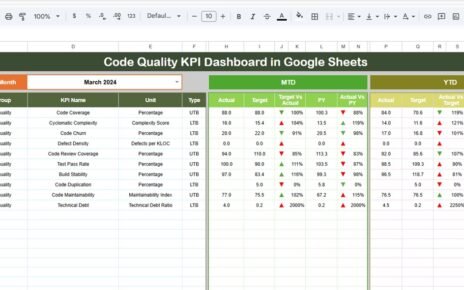
Urban development is the foundation of sustainable growth in modern cities. From infrastructure expansion to waste management and public safety, tracking performance across multiple urban metrics is crucial for effective planning and decision-making. The Urban Development KPI Dashboard in Google Sheets is a ready-to-use, data-driven tool that simplifies this process — turning complex urban data into actionable insights.Urban Development KPI Dashboard in Google Sheets
In this detailed article, we’ll explore the dashboard’s structure, features, KPI definitions (with formulas and units), advantages, improvement opportunities, and best practices, followed by a FAQ section for better understanding.Urban Development KPI Dashboard in Google Sheets
What Is an Urban Development KPI Dashboard in Google Sheets?
An Urban Development KPI Dashboard in Google Sheets is an interactive data visualization tool that tracks the progress and efficiency of city development projects. It measures key metrics related to infrastructure, transportation, environment, housing, and citizen services, helping administrators and planners make informed decisions.
The dashboard automatically displays Month-To-Date (MTD) and Year-To-Date (YTD) performance with visual indicators — including arrows and traffic lights — to highlight areas of success and those requiring improvement.
Dashboard Structure Overview
The Urban Development KPI Dashboard consists of six key worksheets, each serving a specific role in data management and visualization:
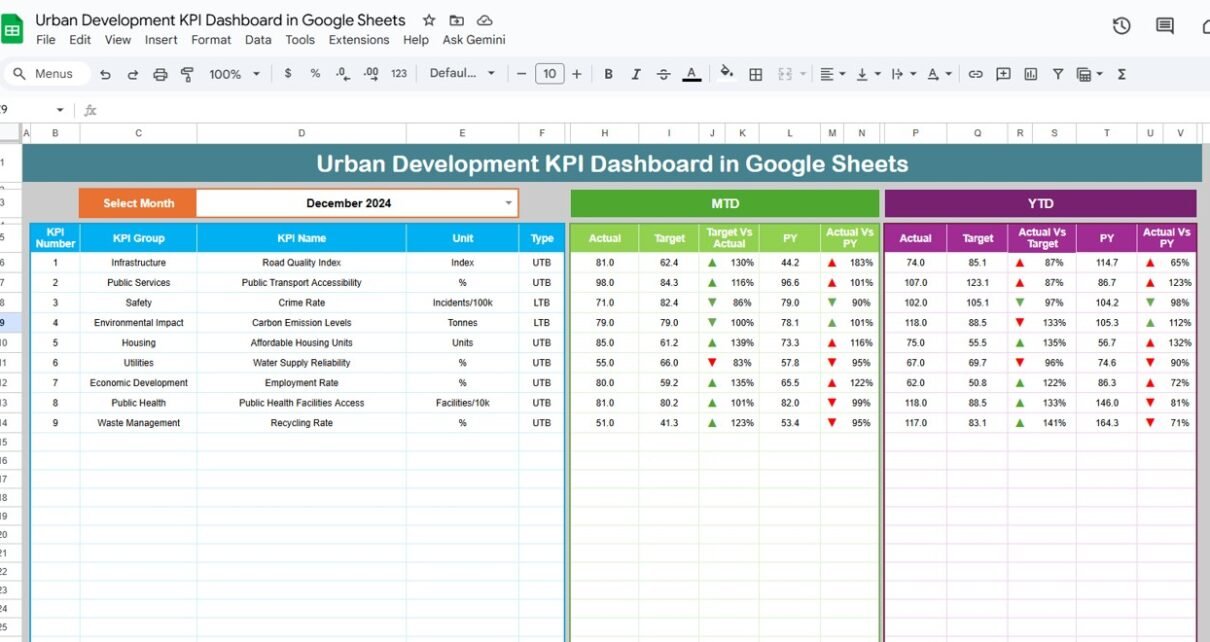
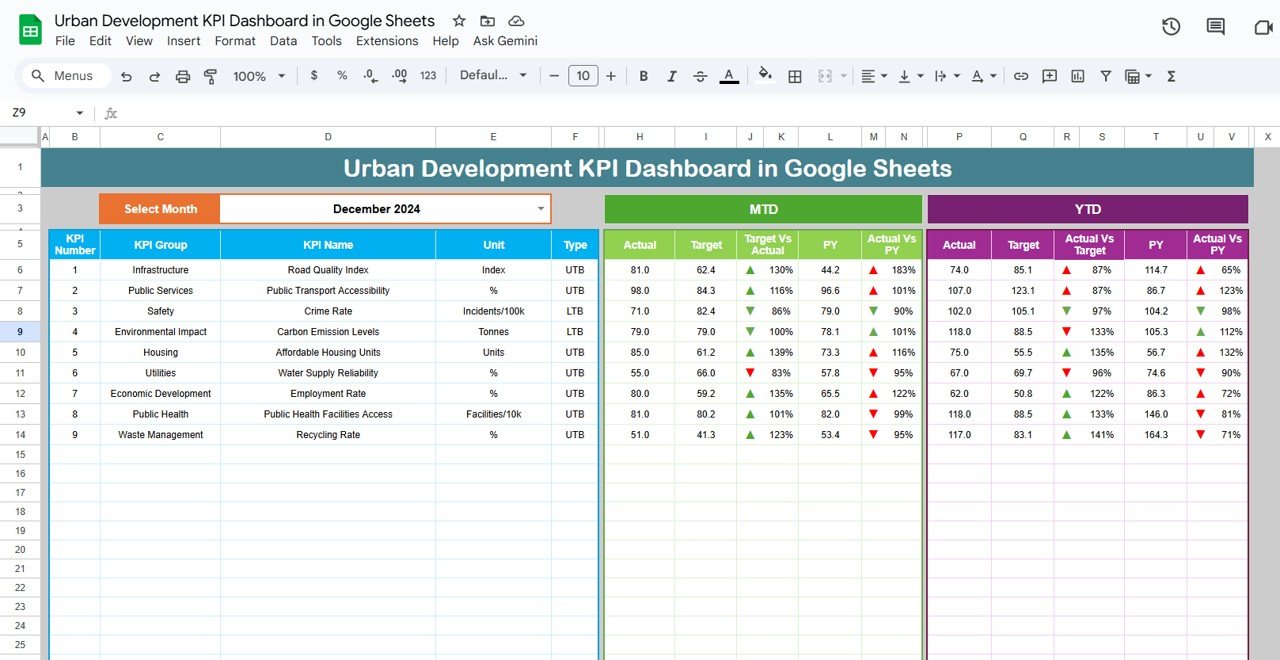
1. Dashboard Sheet Tab
This is the main page of the tool, where all KPI performance data is displayed visually.
-
Month Selector (Cell D3): Choose any month from the dropdown to update all KPI values and visuals automatically.
-
Displays both MTD and YTD data.
-
Compares Actual vs Target and Actual vs Previous Year (PY) metrics.
-
Conditional Formatting:
This interactive dashboard helps policymakers and project managers monitor development performance instantly.
Click to Buy Urban Development KPI Dashboard in Google Sheets
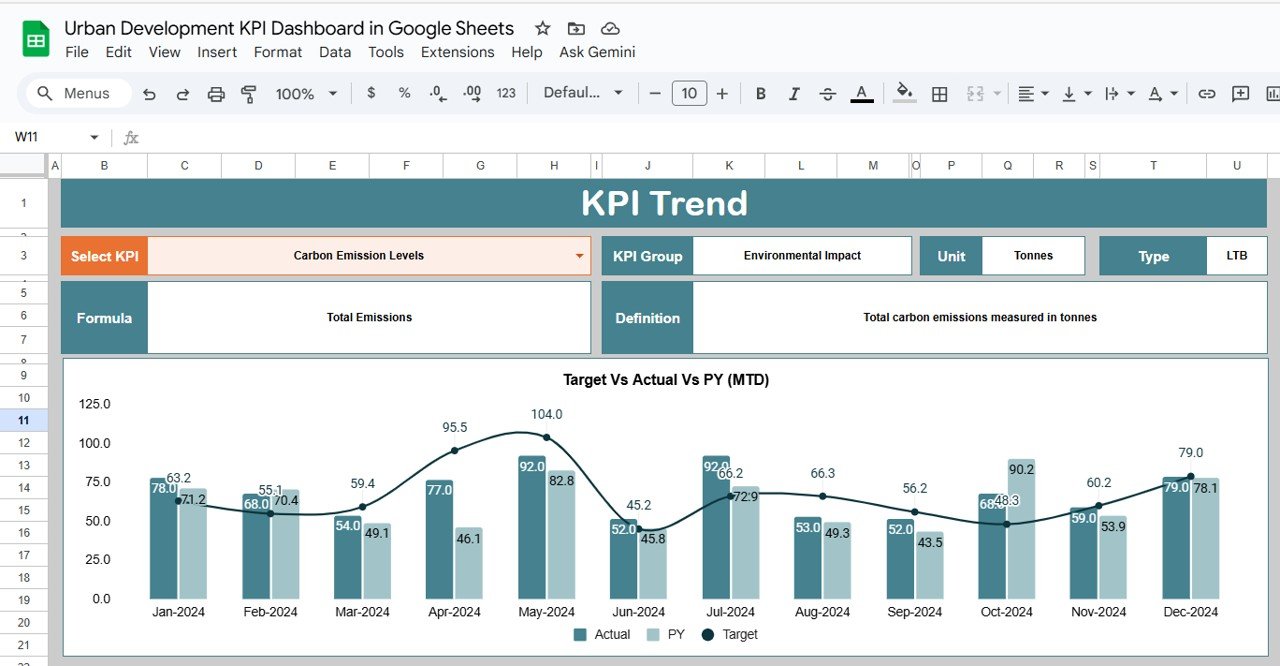
2. KPI Trend Sheet Tab
The KPI Trend Sheet offers a detailed view of how individual KPIs evolve over time.
-
Dropdown (Cell C3): Select a KPI to display its trend.
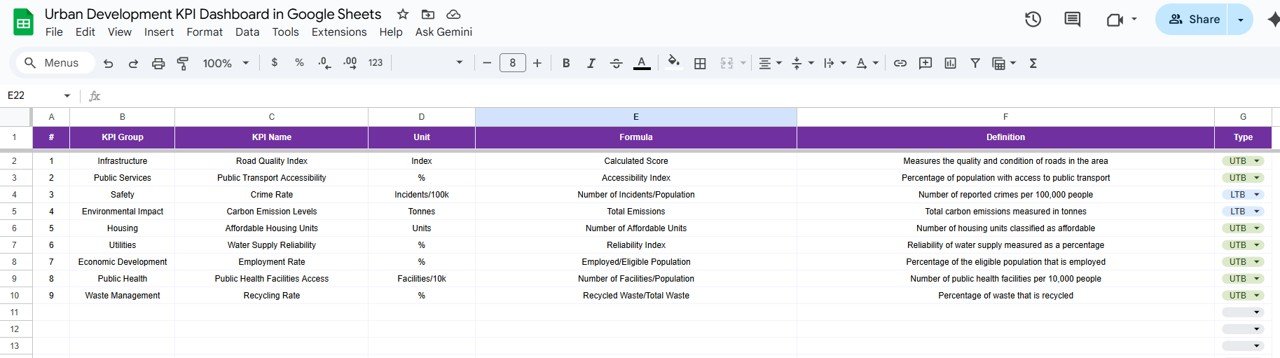
Displays key attributes:
- KPI Group
- Unit
- Type (UTB/LTB)
- Formula
- Definition
Visual chart for month-wise KPI movement.
This view helps identify performance fluctuations and long-term trends in city projects.
Click to Buy Urban Development KPI Dashboard in Google Sheets
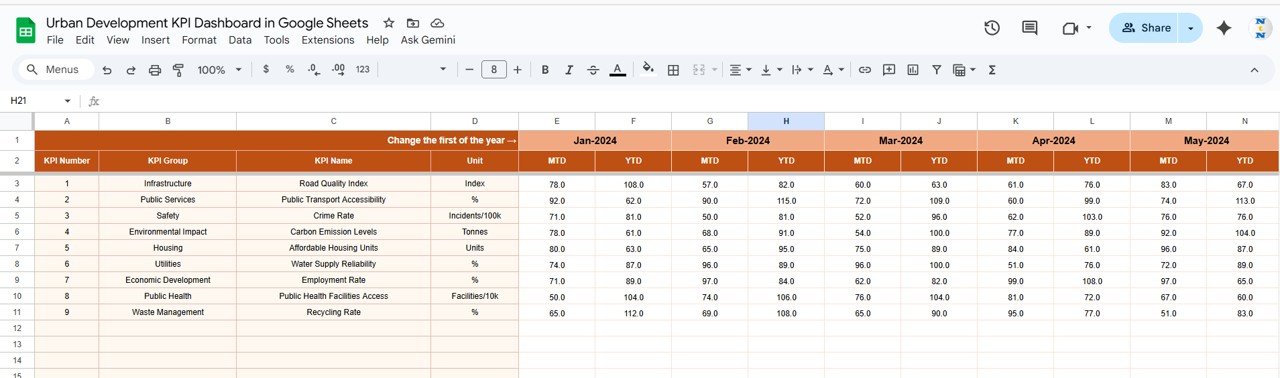
3. Actual Numbers Sheet Tab
This sheet captures real (Actual) KPI values for both MTD and YTD.
-
Month Selector (Cell E1): Select the first month of the year to control calculations.
-
As new data is entered monthly, dashboard visuals update automatically.
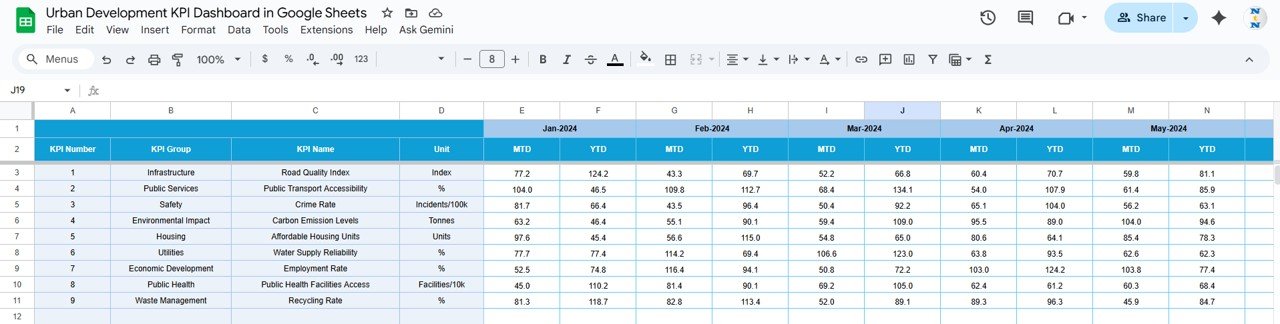
4. Target Sheet Tab
The Target Sheet defines monthly and annual targets for each KPI.
-
Input both MTD Target and YTD Target values.
-
Used to calculate performance variance against actual figures.
Click to Buy Urban Development KPI Dashboard in Google Sheets
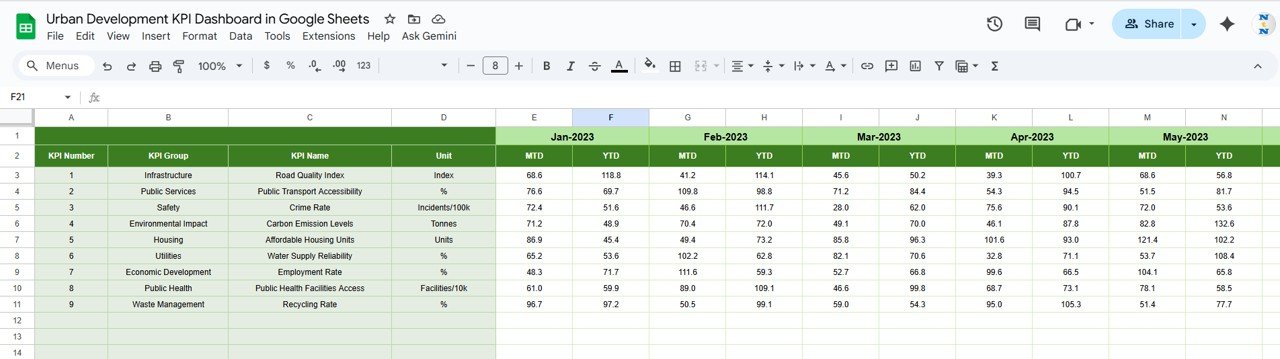
5. Previous Year Numbers Sheet Tab
This sheet records the previous year’s data for comparison.
-
Enter the same set of KPIs with historical MTD and YTD values.
-
Helps measure year-over-year improvements and identify consistent growth areas.
6. KPI Definition Sheet Tab
This sheet defines each KPI clearly, ensuring consistent understanding and measurement across departments.
Click to Buy Urban Development KPI Dashboard in Google Sheets
Advantages of the Urban Development KPI Dashboard
-
Comprehensive City Monitoring: Covers all aspects of urban performance — infrastructure, housing, sanitation, and more.
-
Real-Time Updates: Dashboard auto-refreshes as soon as new data is added.
-
Data-Driven Planning: Enables policymakers to make evidence-based decisions.
-
Comparative Analysis: Track progress over time and against previous years.
-
Google Sheets Collaboration: Shareable with teams for simultaneous input and review.
-
Visual Insights: Traffic lights and arrows provide instant clarity on performance status.
-
Flexible Framework: Easily add or modify KPIs based on municipal priorities.
Opportunities for Improvement
Although robust, the dashboard can be enhanced further:
-
Automation: Use Google Apps Script for auto-importing data from municipal systems.
-
Geospatial Integration: Link charts with Google Maps to visualize KPIs by city zone.
-
Alert System: Trigger email alerts for KPIs that fall below target.
-
Citizen Feedback Link: Integrate survey data to capture real-time satisfaction scores.
-
Mobile-Friendly Design: Adapt the dashboard for on-the-go monitoring using Looker Studio.
Best Practices for Using the Dashboard
Click to Buy Urban Development KPI Dashboard in Google Sheets
-
Update Data Monthly: Keep all sheets synchronized with the latest information.
-
Standardize Units: Use consistent metrics across all departments.
-
Regularly Review Targets: Adjust targets annually based on city goals.
-
Train Stakeholders: Ensure all users understand KPI formulas and definitions.
-
Analyze Trends: Use the KPI Trend Sheet for proactive planning.
-
Ensure Data Accuracy: Validate entries before updating dashboards.
Conclusion
The Urban Development KPI Dashboard in Google Sheets is a practical, cost-effective, and collaborative tool for monitoring city growth and sustainability. It simplifies complex municipal data into easy-to-understand visuals, empowering administrators to make timely and data-driven decisions.Urban Development KPI Dashboard in Google Sheets
With its modular structure, real-time updates, and clear KPI definitions, this dashboard becomes an essential tool for urban planners, policymakers, and infrastructure teams focused on building smarter, sustainable cities.Urban Development KPI Dashboard in Google Sheets
Frequently Asked Questions (FAQ)
Click to Buy Urban Development KPI Dashboard in Google Sheets
1. Can I add more KPIs related to my city’s initiatives?
Yes. You can expand the KPI Definition Sheet with new metrics as required.Urban Development KPI Dashboard in Google Sheets
2. How often should data be updated?
Monthly updates are ideal to maintain MTD and YTD accuracy.
3. Does this dashboard support departmental segregation?
Yes. You can filter or categorize KPIs by department or project type.
4. Can it track sustainability progress?
Absolutely. KPIs like Renewable Energy Share and Waste Efficiency are built for sustainability monitoring.
5. Is it suitable for government or private smart-city projects?
Yes. It can be customized for both public sector urban monitoring and private infrastructure firms.
Visit our YouTube channel to learn step-by-step video tutorials
Youtube.com/@NeotechNavigators
Click to Buy Urban Development KPI Dashboard in Google Sheets