Warehouse operations move fast. However, safety risks move even faster. Forklifts operate daily. Workers handle heavy materials. Teams load and unload shipments under strict deadlines. Therefore, warehouse managers must track safety performance continuously.
Yet many warehouses still rely on scattered spreadsheets. As a result, safety managers struggle to monitor incidents. Moreover, they fail to compare monthly targets. Consequently, small safety gaps grow into serious risks.
So, how can you monitor MTD and YTD safety metrics, compare targets with actual performance, and analyze previous year trends in one structured system?
You need a Warehouse Safety KPI Dashboard in Google Sheets.
In this detailed guide, you will learn:
- What a Warehouse Safety KPI Dashboard in Google Sheets is
- Why warehouses need structured safety tracking
- Complete explanation of all 6 worksheets
- All important warehouse safety KPIs with unit, formula, and definition
- Advantages of the Warehouse Safety KPI Dashboard in Google Sheets
- Best Practices for the Warehouse Safety KPI Dashboard in Google Sheets
- Frequently Asked Questions with Answers
Let us explore everything step by step.
What Is a Warehouse Safety KPI Dashboard in Google Sheets?
Click to Buy Warehouse Safety KPI Dashboard in Google Sheets
A Warehouse Safety KPI Dashboard in Google Sheets is a ready-to-use safety monitoring system built inside Google Sheets. It helps warehouse managers track workplace safety metrics in real time.
Instead of switching between multiple files, this dashboard centralizes:
- Incident data
- Safety targets
- Previous year performance
- Monthly and yearly trends
- KPI definitions
Because Google Sheets works online, teams can collaborate easily. Furthermore, managers can access the dashboard from anywhere.
Why Do Warehouses Need a Safety KPI Dashboard?
Warehouses face several safety challenges:
- Slips and falls
- Forklift accidents
- Manual handling injuries
- Fire hazards
- Equipment malfunction
Therefore, safety managers must monitor performance regularly. However, without structured tracking:
- Teams miss incident trends
- Targets remain unclear
- Safety meetings lack data support
- Compliance audits become stressful
When you use a Warehouse Safety KPI Dashboard:
- You track safety in real time
- You compare MTD and YTD results
- You evaluate previous year performance
- You improve accountability
Consequently, you build a safer workplace.
What Are the 6 Worksheets in the Warehouse Safety KPI Dashboard in Google Sheets?
Click to Buy Warehouse Safety KPI Dashboard in Google Sheets
This dashboard includes 6 structured worksheets. Each sheet serves a specific purpose.
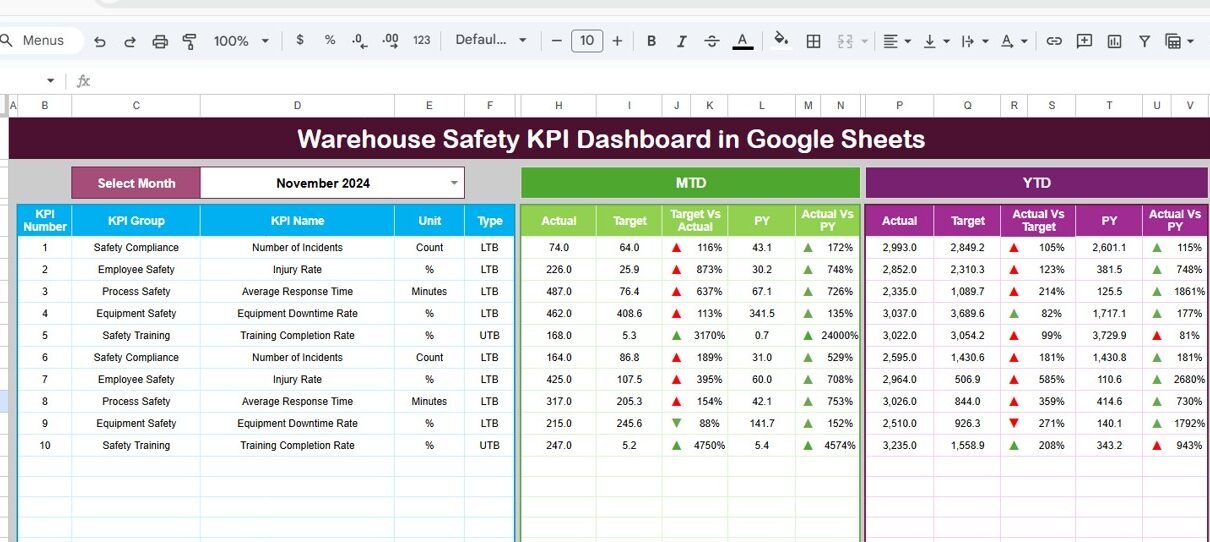
Dashboard Sheet Tab – How Does It Work?
The Dashboard Sheet acts as the main analysis page.
On cell D3, you can select the Month from a drop-down list. As soon as you select a month, the entire dashboard updates automatically.
What Does the Dashboard Show?
It displays:
- MTD Actual
- MTD Target
- MTD Previous Year
- Target vs Actual comparison
- PY vs Actual comparison
- Conditional formatting arrows (Up / Down indicators)
Additionally, it shows:
- YTD Actual
- YTD Target
- YTD Previous Year
- YTD Target vs Actual
- YTD PY vs Actual
Because of dynamic formulas, Google Sheets calculates all results instantly. Therefore, managers can detect safety gaps quickly.

Click to Buy Warehouse Safety KPI Dashboard in Google Sheets
KPI Trend Sheet Tab – How Can You Analyze Trends?
The KPI Trend Sheet allows detailed KPI analysis.
On cell C3, you can select the KPI name from a drop-down list. Once selected, the sheet displays:
- KPI Group
- Unit of KPI
- KPI Type (Lower the Better / Upper the Better)
- Formula of the KPI
- Definition of the KPI
Moreover, trend charts show:
- MTD trend
- YTD trend
- Actual vs Target vs Previous Year
Therefore, managers can visualize patterns easily. Furthermore, they can identify whether safety performance improves or declines.

Click to Buy Warehouse Safety KPI Dashboard in Google Sheets
Actual Number Sheet Tab – Where Do You Enter Data?
In this sheet, you enter:
- MTD actual numbers
- YTD actual numbers
You can change the month from cell E1. Simply input the first month of the year in E1. After that, Google Sheets calculates the rest automatically.
Because the dashboard links directly to this sheet, all visuals update immediately.

Target Sheet Tab – How Do You Set Safety Goals?
In the Target Sheet, you enter monthly and yearly safety targets.
You must enter:
- MTD target
- YTD target
When you update targets, the dashboard recalculates performance gaps instantly. Therefore, managers can see whether teams meet safety standards.

Click to Buy Warehouse Safety KPI Dashboard in Google Sheets
Previous Year Number Sheet Tab – Why Compare with Last Year?
In this sheet, you enter previous year MTD and YTD numbers.
Historical comparison helps you:
- Identify improvement trends
- Detect recurring safety issues
- Measure long-term progress
Because safety performance improves over time, yearly comparison plays a key role.

KPI Definition Sheet Tab – Why Is Documentation Important?
This sheet contains:
- KPI Name
- KPI Group
- Unit
- Formula
- KPI Definition
Clear documentation improves clarity. Moreover, audit teams can review KPI logic easily.

Click to Buy Warehouse Safety KPI Dashboard in Google Sheets
Advantages of Warehouse Safety KPI Dashboard in Google Sheets
This dashboard provides multiple benefits.
Real-Time Collaboration
Because Google Sheets works online, teams can update data instantly.
Automatic Calculations
Formulas calculate MTD and YTD numbers automatically.
Visual Indicators
Conditional arrows highlight performance gaps clearly.
Historical Comparison
You can compare current data with previous year performance.
Improved Accountability
Each department understands its safety performance.
Easy Customization
You can modify KPIs according to warehouse needs.
Best Practices for the Warehouse Safety KPI Dashboard in Google Sheets
Click to Buy Warehouse Safety KPI Dashboard in Google Sheets
To maximize performance, follow these best practices:
1. Update Data Monthly
Always enter data on time.
2. Validate Input Numbers
Check for data errors before updating.
3. Focus on Actionable KPIs
Track metrics that directly reduce incidents.
4. Review Dashboard in Safety Meetings
Use the dashboard in monthly reviews.
5. Train Managers on KPI Meaning
Ensure everyone understands KPI definitions.
6. Maintain Clear Documentation
Update the KPI Definition sheet regularly.
How Does This Dashboard Improve Warehouse Safety?
This dashboard:
- Reduces manual reporting
- Highlights high-risk areas
- Improves training focus
- Encourages proactive reporting
- Supports compliance audits
Therefore, warehouses create a strong safety culture.
Conclusion
Click to Buy Warehouse Safety KPI Dashboard in Google Sheets
Warehouse safety requires constant monitoring. However, manual reporting slows down decision-making. A Warehouse Safety KPI Dashboard in Google Sheets provides structured tracking, trend analysis, and real-time comparison in one powerful system.
Because the dashboard centralizes safety metrics, managers gain clarity. Moreover, teams respond quickly to safety gaps. Consequently, organizations reduce incidents and improve compliance.
If you want to strengthen workplace safety, improve reporting accuracy, and enhance performance visibility, this dashboard offers a practical and effective solution.
Frequently Asked Questions with Answers
1. What is the main purpose of the Warehouse Safety KPI Dashboard?
It helps track safety metrics, compare targets, and analyze trends in one structured Google Sheets file.
2. Can I customize KPIs?
Yes, you can modify KPI names, formulas, and groups easily.
3. Does the dashboard update automatically?
Yes, once you enter data, all visuals and comparisons update instantly.
4. Is Google Sheets better than Excel for safety tracking?
Google Sheets works online and supports collaboration. Therefore, teams can access data from anywhere.
5. How often should I update the dashboard?
You should update it monthly for accurate MTD and YTD tracking.
Visit our YouTube channel to learn step-by-step video tutorials
Youtube.com/@NeotechNavigators
Watch the step-by-step video tutorial:
Click to Buy Warehouse Safety KPI Dashboard in Google Sheets