In today’s digital world, website performance directly impacts business growth, marketing success, and customer engagement. Organizations invest heavily in online marketing, SEO, and content strategies. However, many teams still struggle to measure website performance clearly because they rely on scattered analytics reports and manual tracking methods.Website Traffic KPI Dashboard in Google Sheets
Therefore, businesses increasingly adopt KPI dashboards to monitor website traffic using structured and visual analytics. One powerful and practical solution is the Website Traffic KPI Dashboard in Google Sheets — a ready-to-use performance monitoring system designed to track website metrics through automated calculations and interactive reporting.
This comprehensive article explains everything about the Website Traffic KPI Dashboard in Google Sheets, including its structure, features, advantages, implementation steps, best practices, and frequently asked questions.Website Traffic KPI Dashboard in Google Sheets
What Is a Website Traffic KPI Dashboard in Google Sheets?
A Website Traffic KPI Dashboard in Google Sheets is an analytics tool that tracks website performance using Key Performance Indicators (KPIs). It consolidates traffic data, targets, and historical comparisons into a single dashboard.
Instead of reviewing multiple analytics tools separately, users can analyze performance from one centralized interface. Moreover, because Google Sheets works in the cloud, teams collaborate in real time while maintaining data accuracy.
The dashboard includes KPIs with:
- Unit of measurement
- Aggregation formulas
- KPI definitions
- Performance type (Lower the Better or Upper the Better)
As a result, users clearly understand how each KPI works and how performance should be evaluated.
Key Features of Website Traffic KPI Dashboard in Google Sheets
Click to Buy Website Traffic KPI Dashboard in Google Sheets
This dashboard contains six structured worksheets, each designed for a specific analytical purpose.
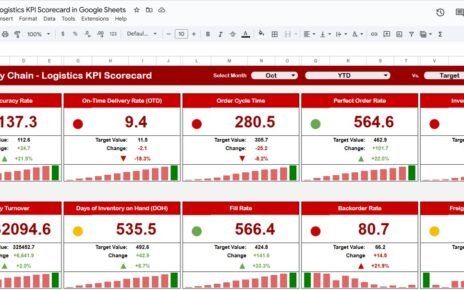
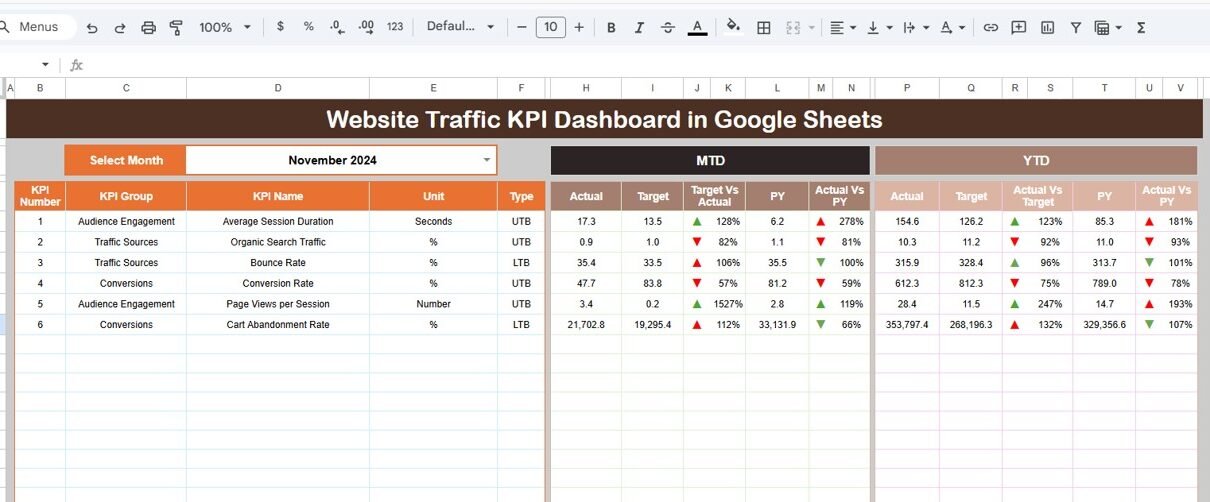
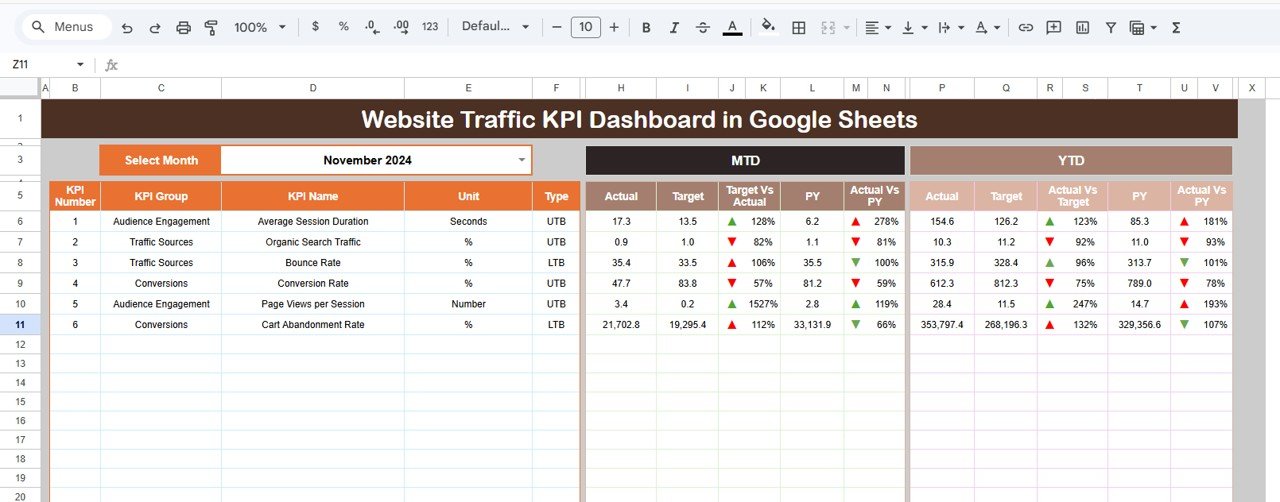
How Does the Dashboard Sheet Provide Performance Insights?
The Dashboard Sheet Tab serves as the main interface where users view all KPI information.
Main Functionalities
- Month selection dropdown available in cell D3
- Entire dashboard updates automatically when a month changes
- Displays both monthly and yearly performance metrics
Metrics Displayed
MTD (Month-To-Date) Analysis
- Actual values
- Target values
- Previous year data
- Target vs Actual comparison
- Previous Year vs Actual comparison
- Conditional formatting with up/down arrows
YTD (Year-To-Date) Analysis
- YTD Actual
- YTD Target
- Previous year performance
- Growth comparisons
- Visual indicators
Because of automated comparisons, users quickly identify performance gaps.
Click to Buy Website Traffic KPI Dashboard in Google Sheets
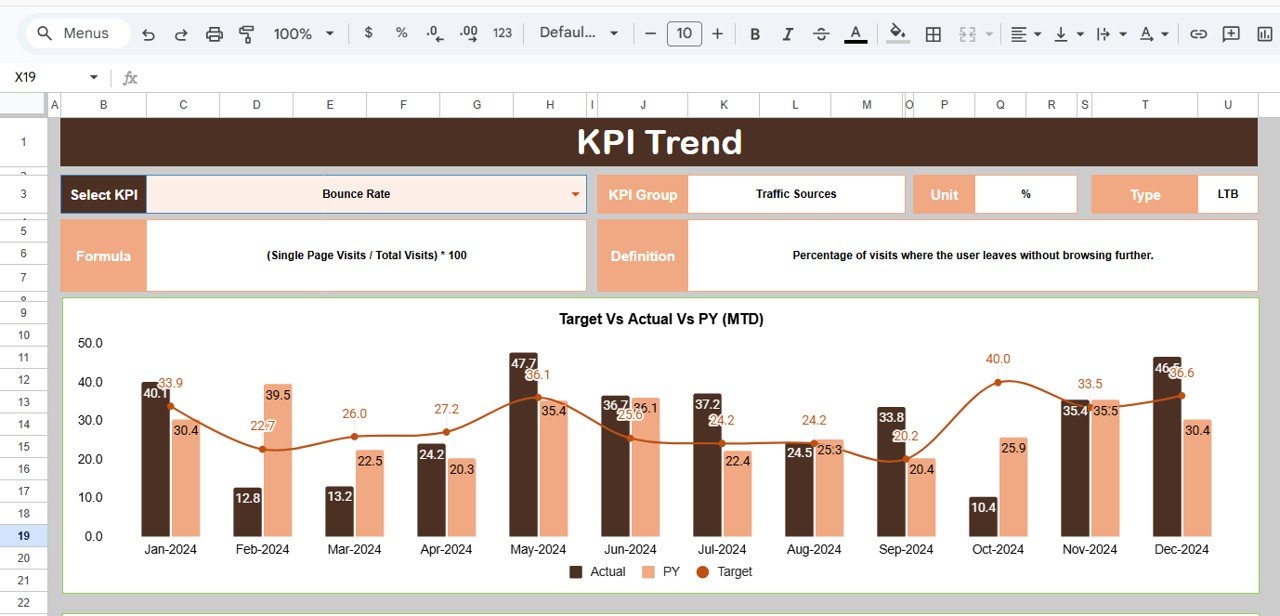
KPI Trend Sheet
The KPI Trend Sheet Tab provides detailed KPI analysis.
Users select a KPI from the dropdown available in range C3, and the dashboard displays:
- KPI Group
- KPI Unit
- KPI Type
- Performance logic:
-
Lower the Better
-
Upper the Better
-
- KPI Formula
- KPI Definition
Therefore, users understand both performance trends and KPI calculation methods.
Click to Buy Website Traffic KPI Dashboard in Google Sheets
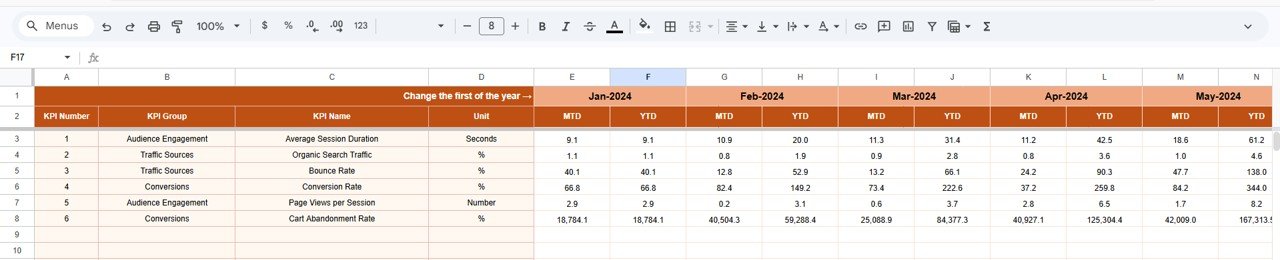
Actual Number Sheet
The Actual Number Sheet Tab stores performance data for the current year.
Key Functions
- Enter actual values for MTD and YTD
- Select starting month in cell E1
- Automatically updates dashboard calculations
Once users input data, all dashboard visuals refresh automatically.
Click to Buy Website Traffic KPI Dashboard in Google Sheets
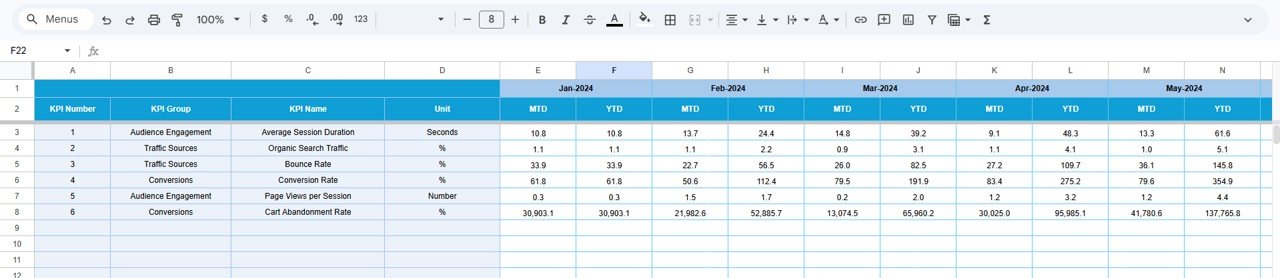
Target Sheet?
The Target Sheet Tab allows organizations to define performance goals.
Users enter:
- Monthly targets (MTD)
- Yearly targets (YTD)
- KPI-specific performance benchmarks
Because targets remain centralized, teams track progress easily.
Click to Buy Website Traffic KPI Dashboard in Google Sheets
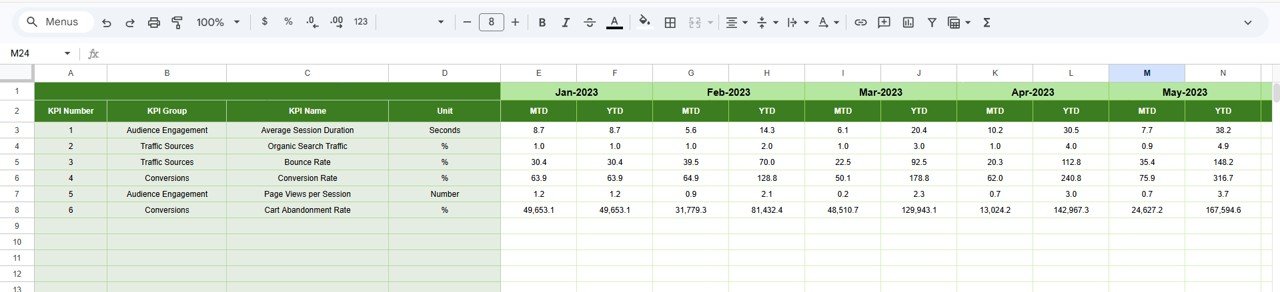
Previous Year Number Sheet
Historical comparison helps organizations evaluate growth accurately.
In the Previous Year Number Sheet, users enter last year’s KPI values similar to the current year structure.
This enables:
- Year-over-year comparison
- Growth tracking
- Performance trend analysis
Consequently, decision-makers understand whether strategies improve results.
Click to Buy Website Traffic KPI Dashboard in Google Sheets
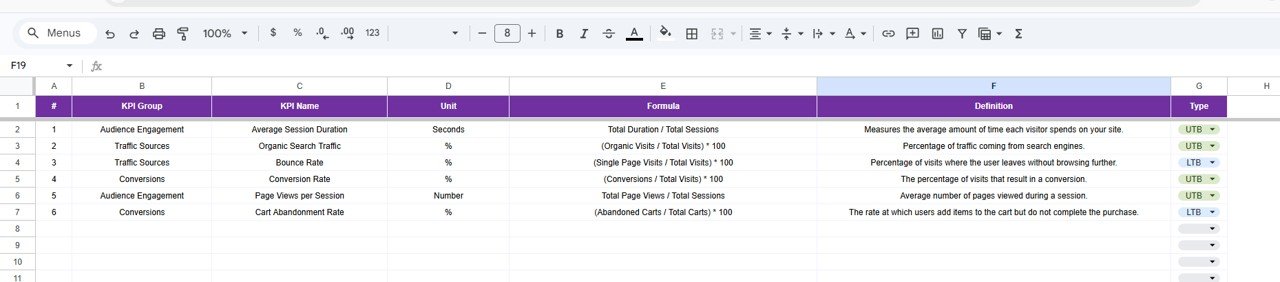
KPI Definition Sheet?
The KPI Definition Sheet Tab works as the dashboard’s documentation center.
Users enter:
- KPI Name
- KPI Group
- Unit
- Formula
- KPI Definition
This structure ensures consistency and transparency across reporting.
Advantages of Website Traffic KPI Dashboard in Google Sheets
Centralized Website Analytics
All KPIs appear in one dashboard for quick analysis.
Automated Performance Tracking
Numbers update automatically when users change months.
Clear Performance Comparison
Compare actual vs target and year-over-year results.
Real-Time Collaboration
Teams access dashboards simultaneously.
Cost-Effective Solution
Google Sheets eliminates expensive BI tools.
Improved Marketing Decisions
Data-driven insights enhance campaign performance.
Best Practices for the Website Traffic KPI Dashboard in Google Sheets
Click to Buy Website Traffic KPI Dashboard in Google Sheets
Update Data Consistently
Enter data monthly to maintain accuracy.
Align KPIs With Business Goals
Track metrics that impact revenue and engagement.
Use Visual Indicators Properly
Monitor arrows and conditional formatting regularly.
Review Trends Frequently
Monthly reviews help detect issues early.
Maintain Data Quality
Avoid incorrect or incomplete entries.
Train Team Members
Ensure users understand KPI meanings.
Why Use Google Sheets for Website Analytics?
Click to Buy Website Traffic KPI Dashboard in Google Sheets
Google Sheets offers major advantages:
- Cloud accessibility
- Easy sharing
- Automatic saving
- Flexible customization
- Integration with existing workflows
Consequently, organizations build professional analytics without technical complexity.
Conclusion
Website performance measurement plays a critical role in digital success. Without structured tracking, businesses struggle to interpret analytics and improve strategies effectively. The Website Traffic KPI Dashboard in Google Sheets provides a powerful, user-friendly solution for monitoring website metrics using automated comparisons, trend analysis, and visual indicators.
By combining KPI definitions, monthly tracking, target comparison, and year-over-year analysis, this dashboard transforms complex website data into actionable insights. As a result, organizations enhance marketing performance, improve decision-making, and achieve sustainable growth.
Frequently Asked Questions (FAQs)
Click to Buy Website Traffic KPI Dashboard in Google Sheets
What is a Website Traffic KPI Dashboard?
It is a dashboard that tracks website performance using measurable KPIs and visual analytics.
Can I customize KPIs in this dashboard?
Yes, users can modify KPI definitions, formulas, and targets easily.
What is the difference between MTD and YTD?
MTD shows monthly performance, while YTD shows cumulative yearly performance.
Do I need advanced Google Sheets knowledge?
No. The dashboard works automatically after entering data.
How often should data be updated?
You should update data monthly for accurate tracking.
Can teams collaborate on this dashboard?
Yes, Google Sheets supports real-time collaboration.
Does the dashboard compare previous year performance?
Yes, it includes year-over-year comparison features.
Visit our YouTube channel to learn step-by-step video tutorials
Youtube.com/@NeotechNavigators
Watch the step-by-step video tutorial: