Managing a winery requires monitoring multiple aspects such as production, sales, inventory, and distribution. The Winery KPI Dashboard in Google Sheets provides a ready-to-use solution for tracking key performance indicators (KPIs), analyzing trends, and making data-driven decisions.
In this article, we’ll explain the features, advantages, best practices, and frequently asked questions about this winery dashboard.
What Is a Winery KPI Dashboard?
A Winery KPI Dashboard is an interactive tool that consolidates essential metrics into a single Google Sheets file. This dashboard helps winery managers, owners, and operations teams monitor:
-
Production efficiency and output
-
Sales and revenue
-
Inventory levels and turnover
-
Quality metrics and distribution performance
With this dashboard, wineries can easily identify performance gaps, optimize operations, and plan for growth.
Key Features of the Winery KPI Dashboard
Click to Buy Winery KPI Dashboard in Google Sheets
This dashboard includes 6 worksheets, each serving a distinct purpose:
1. Dashboard Sheet Tab
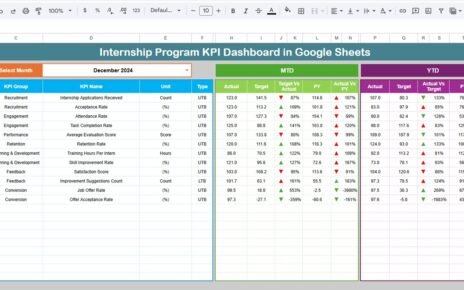
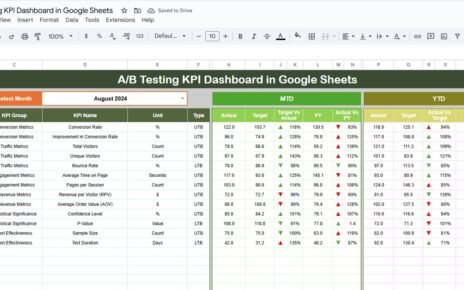
The Dashboard Sheet provides a high-level overview of all KPIs:
-
Month Selection (Range D3): Updates all dashboard numbers dynamically for the selected month
-
MTD Metrics: Displays Month-to-Date Actual, Target, and Previous Year data with conditional formatting arrows
-
YTD Metrics: Displays Year-to-Date metrics along with comparisons to targets and previous year values
This sheet allows managers to monitor winery performance at a glance.

Click to Buy Winery KPI Dashboard in Google Sheets
2. KPI Trend Sheet Tab
The KPI Trend Sheet allows in-depth analysis of individual KPIs:
-
Select KPI from the dropdown (Range C3)
-
Displays KPI Group, Unit, and Type (Upper-the-Better or Lower-the-Better)
-
Shows KPI Formula and Definition
-
Visualizes trends over time for informed decision-making
This sheet helps identify underperforming areas and track improvements.

Click to Buy Winery KPI Dashboard in Google Sheets
3. Actual Number Sheet Tab
-
Enter actual values for each KPI for MTD and YTD
-
Update the first month of the year in Range E1 to adjust calculations
This sheet ensures accurate and up-to-date performance tracking.

Click to Buy Winery KPI Dashboard in Google Sheets
4. Target Sheet Tab
-
Enter monthly and YTD targets for each KPI
-
Provides a benchmark to measure actual performance
Maintaining clear targets allows wineries to track success against goals.

5. Previous Year Numbers Sheet Tab
-
Enter previous year values for comparison
-
Enables year-over-year analysis to identify growth trends
This sheet is essential for understanding seasonal performance variations.

Click to Buy Winery KPI Dashboard in Google Sheets
6. KPI Definition Sheet Tab
-
Record KPI Name, Group, Unit, Formula, Definition, and Type
-
Indicates whether higher or lower values are better for each metric
-
Ensures clarity and consistency in performance evaluation
This acts as a reference for all KPIs in the dashboard.

Click to Buy Winery KPI Dashboard in Google Sheets
Examples of KPIs for a Winery
Some key KPIs that wineries can track include:
-
Total Wine Production (Liters): Measures output per month or year
-
Sales Revenue ($): Total sales generated
-
Inventory Turnover: How quickly stock is sold and replaced
-
Customer Orders Fulfilled (%): Measures fulfillment efficiency
-
Wine Quality Score: Ratings or lab-tested quality metrics
-
Distribution Efficiency: Tracks shipping time and costs
-
Marketing ROI (%): Return on promotional campaigns
Each KPI should include:
-
Unit of Measure (e.g., liters, $, %)
-
Formula (e.g., Total Sales ÷ Total Orders)
-
Performance Type (Upper-the-Better or Lower-the-Better)
Advantages of Using the Winery KPI Dashboard
Click to Buy Winery KPI Dashboard in Google Sheets
-
Centralized Performance Data: Monitor production, sales, and inventory in one place
-
Visual Insights: Conditional formatting and charts make trends easy to interpret
-
Identify Bottlenecks: Spot low-performing metrics for immediate action
-
Data-Driven Decisions: Optimize operations based on accurate insights
-
Customizable: Add or remove KPIs as needed for specific winery operations
-
Trend Analysis: Compare MTD and YTD metrics against previous years
Best Practices for Using the Dashboard
-
Update Data Regularly: Ensure actual values are entered promptly
-
Segment Metrics: Track KPIs by wine type, location, or production line
-
Monitor Targets: Compare performance against targets for immediate action
-
Review Trends Over Time: Analyze monthly and yearly data for long-term insights
-
Collaborate: Share Google Sheets with team members for real-time updates
-
Use Conditional Formatting: Highlight KPIs that are underperforming or exceeding targets
How This Dashboard Helps Winery Managers
Click to Buy Winery KPI Dashboard in Google Sheets
-
Track Production Efficiency: Monitor output and resource utilization
-
Optimize Inventory: Avoid stockouts or overstocking
-
Improve Sales: Identify high-performing products and markets
-
Ensure Quality Control: Monitor wine quality scores and issues
-
Analyze Marketing ROI: Determine which campaigns generate the most sales
Frequently Asked Questions (FAQs)
Q1: Can I add custom KPIs for my winery?
Yes, you can add or remove KPIs in the KPI Definition Sheet to suit your operational needs.
Q2: How often should the data be updated?
Update monthly or whenever new production and sales data are available.
Q3: Can I track multiple wine types separately?
Yes, segment KPIs by wine type using additional columns in the Actual Number Sheet.
Q4: Does the dashboard show trends over time?
Yes, the KPI Trend Sheet visualizes month-to-month and year-to-date performance.
Q5: Can multiple team members update the dashboard simultaneously?
Yes, Google Sheets supports real-time collaboration for multiple users.
Conclusion
The Winery KPI Dashboard in Google Sheets is a powerful tool for monitoring production, sales, inventory, and quality metrics. By consolidating data into an interactive, visual dashboard, winery managers can make data-driven decisions, optimize operations, and drive growth.
Visit our YouTube channel to learn step-by-step video tutorials
Youtube.com/@NeotechNavigators
Watch the step-by-step video Demo: