Software development moves fast, and teams must resolve bugs quickly to maintain product quality and satisfy customers. Yet many teams struggle with slow bug resolution cycles, unclear priorities, backlog accumulation, poor reporting, and manual tracking. Because of this, a Bug Resolution KPI Dashboard in Google Sheets becomes a simple, powerful, and highly effective solution.Bug Resolution KPI Dashboard in Google Sheets
This dashboard helps teams monitor all bug-related KPIs in real time. It shows how fast bugs get identified, assigned, fixed, retested, and closed. Moreover, it tracks quality trends, backlog size, aging issues, and team performance. Because it runs in Google Sheets, it updates instantly and requires no technical setup.
In this article, you will learn how this dashboard works, what KPIs it uses, how each worksheet functions, and how development teams can improve their delivery quality by tracking the right metrics.Bug Resolution KPI Dashboard in Google Sheets
What Is a Bug Resolution KPI Dashboard in Google Sheets?
A Bug Resolution KPI Dashboard is a reporting tool that tracks bug identification, bug fixing, quality benchmarks, developer performance, and resolution timelines. It provides full visibility into the defect lifecycle. With this dashboard, teams understand which bugs cause delays, which stages require improvement, and how quality evolves every month.Bug Resolution KPI Dashboard in Google Sheets
Because this system uses smart formulas, dynamic dropdowns, and clean data entry sheets, it becomes an easy-to-maintain solution for QA teams, developers, project managers, and product owners. It supports both MTD (Month-To-Date) and YTD (Year-To-Date) analysis.Bug Resolution KPI Dashboard in Google Sheets
Key Worksheets in the Bug Resolution KPI Dashboard
Click to Buy Bug Resolution KPI Dashboard in Google Sheets
This dashboard contains 6 interconnected sheets, each designed for clarity and smooth tracking.
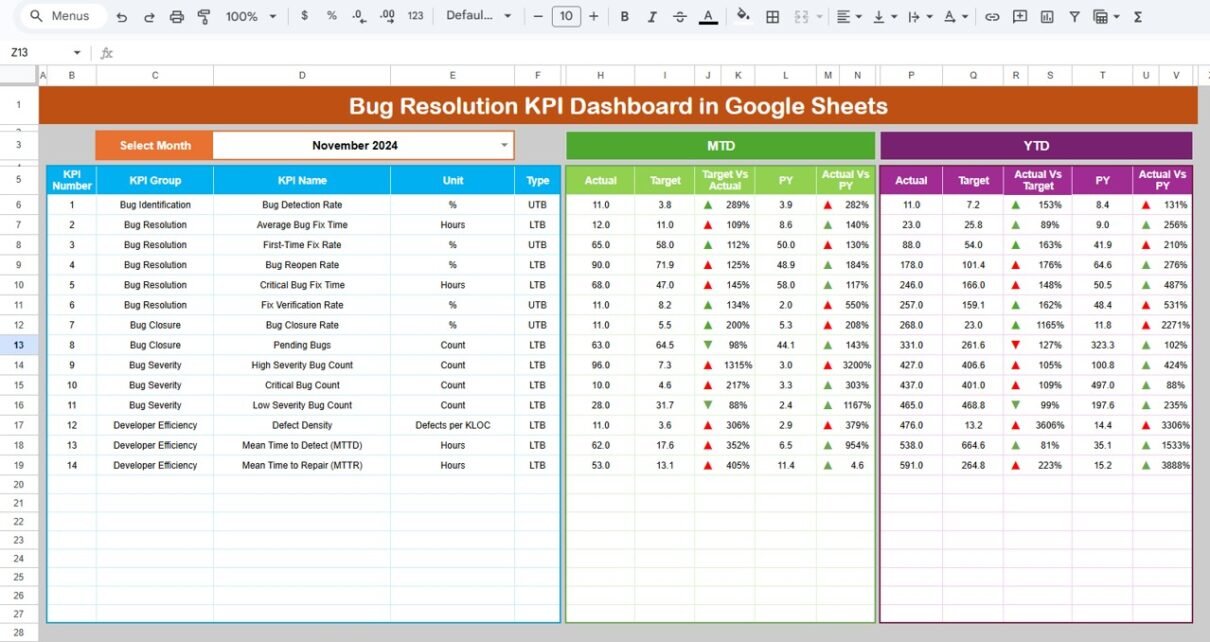
Dashboard Sheet (Main Page)
This sheet displays all KPI visuals and numbers.
You select the month in cell D3, and the dashboard updates instantly.
It shows:
MTD Metrics
- MTD Actual
- MTD Target
- MTD Previous Year
- MTD Target vs Actual
- MTD Previous Year vs Actual
YTD Metrics
- YTD Actual
- YTD Target
- YTD Previous Year
- YTD Target vs Actual
- YTD Previous Year vs Actual
The dashboard highlights performance through conditional formatting arrows:
-
Green arrow → improvement
-
Red arrow → decline
-
Yellow arrow → stable performance
This allows teams to understand progress within seconds.

Click to Buy Bug Resolution KPI Dashboard in Google Sheets
KPI Trend Sheet Tab
In this sheet you select a KPI name using the dropdown in cell C3.
The sheet shows:
- KPI Group
- KPI Unit
- KPI Type (Lower the Better or Upper the Better)
- KPI Formula
- KPI Definition
Trend charts display month-wise movement of each KPI.
This helps in spotting:
- Quality improvement patterns
- Resolution delays
- Backlog issues
- Rising defect trends

Click to Buy Bug Resolution KPI Dashboard in Google Sheets
Actual Number Sheet Tab
This sheet stores the MTD and YTD actual values for each KPI.
You select the year’s first month in cell E1, and the sheet auto-adjusts the monthly layout.
Enter monthly actual performance numbers here, and the dashboard updates automatically.

Target Number Sheet Tab
This sheet holds the targets for each KPI, including:
-
Monthly targets (MTD)
-
Long-term annual targets (YTD)
Targets help you compare desired performance with real outcomes.

Click to Buy Bug Resolution KPI Dashboard in Google Sheets
Previous Year Data Sheet Tab
Here you enter the data from the previous year for all KPIs.
The dashboard uses this data to show YOY improvements, such as:
- Faster bug resolution
- Lower bug leakage
- Better code quality
- More predictable delivery

KPI Definition Sheet Tab
This sheet contains complete KPI metadata:
- KPI Name
- KPI Group
- Unit
- Formula
- Definition
- LTB or UTB
This sheet ensures consistency and helps new team members understand each KPI.

Click to Buy Bug Resolution KPI Dashboard in Google Sheets
Advantages of the Bug Resolution KPI Dashboard
- Faster identification of bottlenecks: Teams spot delays in resolution cycles quickly.
- Improved code quality: KPIs like defect density, reopen rate, and leakage rate highlight quality issues.
- Better planning and resource allocation: Developers receive balanced workloads.
- Transparent reporting: Stakeholders view all performance metrics clearly.
- Better customer satisfaction: Fewer bugs reach customers, improving trust.
- Real-time insights: The dashboard updates as soon as numbers change.
Opportunities for Improvement in Bug Resolution Tracking
Click to Buy Bug Resolution KPI Dashboard in Google Sheets
- Automate data imports from Jira, Trello, or GitHub: Save time by syncing bug logs.
- Add module-wise complexity factors: This improves accuracy of KPIs.
- Include AI-based bug prediction: Helps detect risky areas in code.
- Add alerts for old or severe bugs: Automate reminders for critical issues.
- Include more user satisfaction metrics: Track customer pain points better.
Best Practices for Managing Bug Resolution KPIs
- Update bug data daily: Never delay number entries.
- Assign bugs quickly: Avoid large pools of unassigned bugs.
- Prioritize based on severity: Fix critical bugs before lower-severity ones.
- Improve test coverage: High coverage reduces bug leakage.
- Conduct root-cause analysis: Fix the source, not just the symptom.
- Review dashboard weekly: Sprint-level reviews improve predictability.
Conclusion
Click to Buy Bug Resolution KPI Dashboard in Google Sheets
A Bug Resolution KPI Dashboard in Google Sheets helps teams resolve bugs faster, improve product quality, and reduce customer issues. It offers a simple and powerful reporting solution with real-time updates. Because every KPI is clear and actionable, development and QA teams make better decisions and improve their overall efficiency. With well-defined worksheets, structured formulas, and smart trend analysis, this dashboard becomes a must-have tool for modern software teams.
Frequently Asked Questions (FAQs)
1. Why do teams need a Bug Resolution KPI Dashboard?
To track quality, reduce backlog, and improve fix efficiency.
2. Is this dashboard suitable for all development teams?
Yes, Agile, Scrum, Kanban, and hybrid teams can use it.
3. Can I add more KPIs?
Yes, you can modify the KPI Definition sheet anytime.
4. Does the dashboard update automatically?
Yes, when you enter actual, target, or previous year values.
5. Do I need coding knowledge?
No, everything works with formulas and dropdowns.
6. Does it support trend tracking?
Yes, the KPI Trend sheet shows month-wise performance.
Watch the step-by-step video tutorial:
Visit our YouTube channel to learn step-by-step video tutorials