Volunteer programs play a vital role in non-profits, NGOs, CSR initiatives, educational institutions, and community organizations. However, managing volunteers without proper tracking often leads to low engagement, poor utilization, unclear impact, and reporting challenges. Because volunteer efforts involve time, people, and purpose, organizations need clear performance visibility. That is exactly where a Volunteer Program KPI Dashboard in Google Sheets becomes extremely valuable.
This ready-to-use dashboard helps organizations track volunteer participation, engagement, efficiency, retention, and impact in one centralized system. Moreover, it provides real-time insights using KPIs, trends, and comparisons so decision-makers can improve program effectiveness.Volunteer Program KPI Dashboard in Google Sheets
In this article, we explain how the dashboard works, all KPIs included, sheet-wise functionality, advantages, improvement opportunities, best practices, and frequently asked questions.Volunteer Program KPI Dashboard in Google Sheets
What Is a Volunteer Program KPI Dashboard in Google Sheets?
A Volunteer Program KPI Dashboard is a structured performance-tracking system that monitors all key aspects of a volunteer program. It converts raw volunteer data into actionable insights using KPIs such as participation rate, hours contributed, retention rate, satisfaction score, and program impact.
Because this dashboard is built in Google Sheets, it offers:
- Real-time updates
- Easy collaboration
- Zero software cost
- Simple data entry
- Automatic calculations
- Clear visual reporting
As a result, program managers gain full control over volunteer operations and reporting.
Key Features of the Volunteer Program KPI Dashboard
Click to Buy Volunteer Program KPI Dashboard in Google Sheets
This dashboard includes 6 well-designed worksheets, each serving a specific purpose.
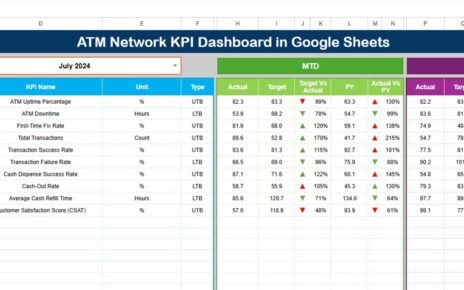
1️⃣ Dashboard Sheet Tab (Main Page)
This is the primary view of the dashboard.
On cell D3, you select the month from a dropdown. Once selected, the entire dashboard updates automatically.
The dashboard displays:
✔ MTD (Month-to-Date)
-
Actual
-
Target
-
Previous Year
-
Target vs Actual
-
Previous Year vs Actual
✔ YTD (Year-to-Date)
-
Actual
-
Target
-
Previous Year
-
Target vs Actual
-
Previous Year vs Actual
Conditional formatting with up and down arrows helps users instantly identify performance improvements or declines.

Click to Buy Volunteer Program KPI Dashboard in Google Sheets
2️⃣ KPI Trend Sheet Tab
In this sheet, you select a KPI from the dropdown in cell C3.
The sheet displays:
- KPI Group
- KPI Unit
- KPI Type (Lower the Better / Upper the Better)
- KPI Formula
- KPI Definition
It also shows month-wise trends, helping managers identify long-term patterns and improvement areas.

3️⃣ Actual Number Sheet Tab
This sheet is used to enter actual MTD and YTD values for each KPI.
-
Select the first month of the year in cell E1
-
Enter monthly actual performance values
-
The dashboard updates automatically

Click to Buy Volunteer Program KPI Dashboard in Google Sheets
4️⃣ Target Sheet Tab
This sheet stores target values for each KPI.
-
Monthly targets (MTD)
-
Annual cumulative targets (YTD)
Targets help evaluate program performance objectively.

5️⃣ Previous Year Number Sheet Tab
This sheet stores last year’s data for each KPI.
It enables:
-
Year-over-year comparison
-
Impact measurement
-
Program improvement tracking

Click to Buy Volunteer Program KPI Dashboard in Google Sheets
6️⃣ KPI Definition Sheet Tab
This reference sheet contains:
-
KPI Name
-
KPI Group
-
Unit
-
Formula
-
Definition
-
KPI Type (LTB/UTB)
It ensures clarity and consistency across the organization.

Click to Buy Volunteer Program KPI Dashboard in Google Sheets
Advantages of the Volunteer Program KPI Dashboard
-
Improves volunteer engagement
-
Enhances transparency and accountability
-
Simplifies reporting for donors and leadership
-
Tracks impact and effectiveness
-
Supports data-driven decisions
-
Saves time with automation
-
Improves volunteer satisfaction
Opportunities for Improvement in Volunteer Programs
Click to Buy Volunteer Program KPI Dashboard in Google Sheets
-
Add automation for volunteer reminders
-
Integrate with registration tools
-
Track location-wise impact
-
Introduce skill-based volunteer matching
-
Add mobile-friendly data entry
-
Include social impact metrics
Best Practices for Using the Dashboard
-
Update data monthly
-
Define KPIs clearly for all users
-
Review trends, not just totals
-
Set realistic targets
-
Conduct quarterly performance reviews
-
Share insights with volunteers
-
Use dashboards during stakeholder meetings
Conclusion
Click to Buy Volunteer Program KPI Dashboard in Google Sheets
A Volunteer Program KPI Dashboard in Google Sheets helps organizations manage, measure, and improve volunteer engagement with clarity and confidence. It transforms scattered data into meaningful insights that drive better planning, stronger participation, and higher program impact. Because it is easy to use, flexible, and fully automated, this dashboard becomes an essential tool for any organization running volunteer programs.
Frequently Asked Questions (FAQs)
1. Who should use this dashboard?
NGOs, non-profits, CSR teams, educational institutions, and community groups.
2. Can I customize KPIs?
Yes, all KPIs are fully customizable.
3. Does it support multiple programs?
Yes, you can track multiple programs in one file.
4. Is Google Sheets secure?
Yes, with proper access controls.
5. Can I add charts?
Yes, Google Sheets supports unlimited visuals.
6. Do I need technical skills?
No, basic spreadsheet knowledge is enough.
Visit our YouTube channel to learn step-by-step video tutorials
Youtube.com/@NeotechNavigators
Watch the step-by-step video tutorial:
Click to Buy Volunteer Program KPI Dashboard in Google Sheets