Budget forecasting plays a critical role in financial planning and decision-making. However, many organizations still rely on static spreadsheets that fail to show forecast accuracy, budget overruns, and trends clearly. As a result, leaders struggle to control costs and plan effectively.Budget Forecasting Dashboard in Google Sheets
That is exactly why a Budget Forecasting Dashboard in Google Sheets becomes an essential financial management tool.
This ready-to-use dashboard helps finance teams, managers, and leadership compare budgeted, forecasted, and actual amounts while tracking variances across departments, categories, and time periods—all from a single interactive Google Sheets dashboard.Budget Forecasting Dashboard in Google Sheets
In this article, we explain how the dashboard works, its structure, charts, benefits, best practices, and FAQs.Budget Forecasting Dashboard in Google Sheets
What Is a Budget Forecasting Dashboard in Google Sheets?
A Budget Forecasting Dashboard is a centralized reporting solution that compares planned budgets with forecasted and actual spending. Instead of reviewing multiple spreadsheets, users gain instant visibility into budget performance through cards and charts.
Because the dashboard is built in Google Sheets, it offers:
-
Real-time budget tracking
-
Automatic calculations and visuals
-
Easy collaboration across teams
-
Cloud-based access
-
No expensive BI tools
This dashboard suits finance teams, budget owners, department heads, and executives.
Key Features of the Budget Forecasting Dashboard
Click to Buy Budget Forecasting Dashboard in Google Sheets
This dashboard is ready to use and structured for quick insights. It includes an Overview sheet, multiple analysis sections, a search feature, and a data input sheet.
Overview Sheet Tab – Budget Snapshot
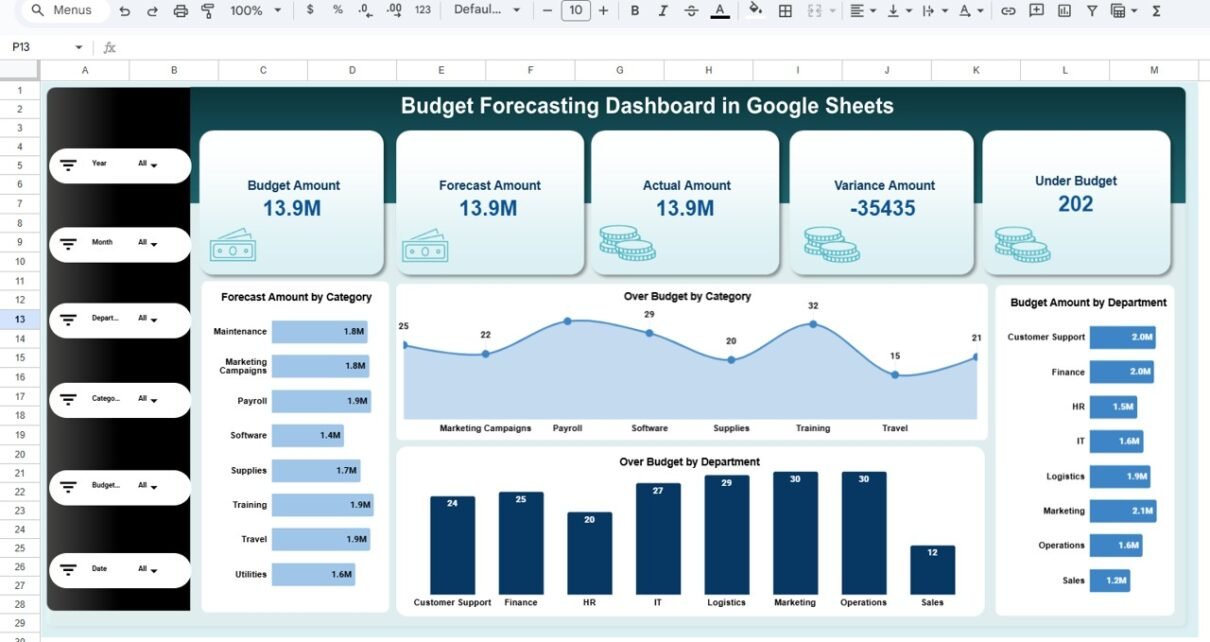
The Overview Sheet provides a high-level summary of budget performance using KPI cards and charts.
KPI Cards on the Dashboard
-
Budget Amount – Total planned budget
-
Forecast Amount – Expected spend based on projections
-
Actual Amount – Real spending recorded
-
Variance Amount – Difference between budget and actual
-
Under Budget – Indicator showing budget control
These cards help decision-makers quickly assess financial health.
Charts in the Overview Section
Forecast Amount by Category
Shows projected spending across budget categories.
Over Budget by Category
Highlights categories exceeding their budget.
Budget Amount by Department
Displays allocated budget by department.
Over Budget by Department
Identifies departments with overspending risks.

Click to Buy Budget Forecasting Dashboard in Google Sheets
Department Analysis
This section evaluates budget performance at the department level.
Charts Included:
-
Forecast Amount by Department
-
Budget Amount by Department
-
Actual Amount by Department
-
Variance Amount by Department
It helps leadership control departmental spending and improve accountability.

Click to Buy Budget Forecasting Dashboard in Google Sheets
Category Analysis
This section analyzes budget performance by cost category.
Charts Included:
-
Forecast Amount by Category
-
Budget Amount by Category
-
Actual Amount by Category
-
Variance Amount by Category
It supports cost optimization and category-level planning.

Click to Buy Budget Forecasting Dashboard in Google Sheets
Budget Status Analysis
This section groups budget data by budget status.
Charts Included:
-
Forecast Amount by Budget Status
-
Budget Amount by Budget Status
-
Actual Amount by Budget Status
-
Variance Amount by Budget Status
It helps teams quickly spot budgets that need attention.

Click to Buy Budget Forecasting Dashboard in Google Sheets
Monthly Trends Analysis
This section shows how budget performance changes over time.
Charts Included:
-
Forecast Amount by Month
-
Budget Amount by Month
-
Actual Amount by Month
-
Variance Amount by Month
It helps organizations identify seasonal trends and forecast accuracy.

Click to Buy Budget Forecasting Dashboard in Google Sheets
Search Feature – Search by Keyword and Field Name
The dashboard includes a smart search feature that allows users to quickly filter budget records.
You can search by:
- Department
- Category
- Budget Status
- Month
This feature saves time during budget reviews and audits.

Click to Buy Budget Forecasting Dashboard in Google Sheets
Data Input Sheet Tab
The Data Sheet is the foundation of the dashboard.
Typical columns include:
- Date
- Department
- Category
- Budget Amount
- Forecast Amount
- Actual Amount
- Budget Status
Once data is updated, all cards and charts refresh automatically.
Why Organizations Need a Budget Forecasting Dashboard
Without a structured dashboard, budget monitoring becomes reactive. This dashboard helps organizations:
-
Control overspending
-
Improve forecast accuracy
-
Enhance financial transparency
-
Support proactive decision-making
-
Strengthen budget governance
A single dashboard brings clarity and control.
Advantages of the Budget Forecasting Dashboard
Click to Buy Budget Forecasting Dashboard in Google Sheets
-
Centralized budget tracking
-
Clear forecast vs actual comparison
-
Department and category visibility
-
Monthly trend analysis
-
Easy collaboration in Google Sheets
-
Cost-effective financial solution
Opportunities for Improvement
You can enhance this dashboard further by adding:
-
Rolling forecasts
-
Scenario analysis
-
Automated alerts for overspending
-
Year-over-year budget comparison
-
Integration with accounting systems
These enhancements deepen financial insights.
Best Practices for Using the Dashboard
Click to Buy Budget Forecasting Dashboard in Google Sheets
-
Update actuals regularly
-
Standardize budget categories
-
Review variances monthly
-
Investigate over-budget trends early
-
Share insights with budget owners
-
Protect financial data with access controls
Conclusion
A Budget Forecasting Dashboard in Google Sheets provides a simple yet powerful way to track budget performance, forecast spending, and control costs. It replaces static spreadsheets with dynamic visuals, improves transparency, and supports data-driven financial decisions. Because it is ready to use and cloud-based, teams can start monitoring budgets immediately.
For organizations focused on financial discipline and planning accuracy, this dashboard becomes an essential tool.
Frequently Asked Questions (FAQs)
Click to Buy Budget Forecasting Dashboard in Google Sheets
1. Who should use this dashboard?
Finance teams, budget owners, and leadership.
2. Can it track multiple departments and categories?
Yes, it supports unlimited departments and categories.
3. Is the dashboard customizable?
Yes, all charts and fields can be modified.
4. Can it help reduce overspending?
Yes, variance tracking highlights issues early.
5. Is Google Sheets secure for financial data?
Yes, with proper sharing permissions.
6. Does it require technical expertise?
No, basic Google Sheets knowledge is enough.
Visit our YouTube channel to learn step-by-step video tutorials
Youtube.com/@NeotechNavigators
Watch the step-by-step video tutorial: