Railway operations involve complex processes such as train punctuality, safety, asset utilization, passenger services, and operational efficiency. Managing these activities without a structured KPI system often leads to delays, cost overruns, and reduced service quality.
That is exactly why a Railway KPI Dashboard in Google Sheets becomes a powerful performance monitoring solution.
This ready-to-use KPI dashboard helps railway authorities, operations managers, and transport planners track critical railway performance metrics in one centralized and interactive Google Sheets dashboard.
In this article, you will learn how the dashboard works, its worksheet structure, KPI framework, advantages, and best practices.
What Is a Railway KPI Dashboard in Google Sheets?
A Railway KPI Dashboard is a centralized reporting tool that tracks key performance indicators related to railway operations, safety, punctuality, capacity utilization, and service quality.
Because this dashboard is built in Google Sheets, it offers:
-
Real-time KPI visibility
-
Easy collaboration across departments
-
Automatic KPI calculations
-
Monthly and yearly performance tracking
-
No additional BI or railway software cost
This dashboard suits railway operations teams, infrastructure planners, safety teams, and senior management.
Key Features of the Railway KPI Dashboard
Click to Buy Railway KPI Dashboard in Google Sheets
This dashboard is ready to use and structured across multiple worksheets for clarity and control.
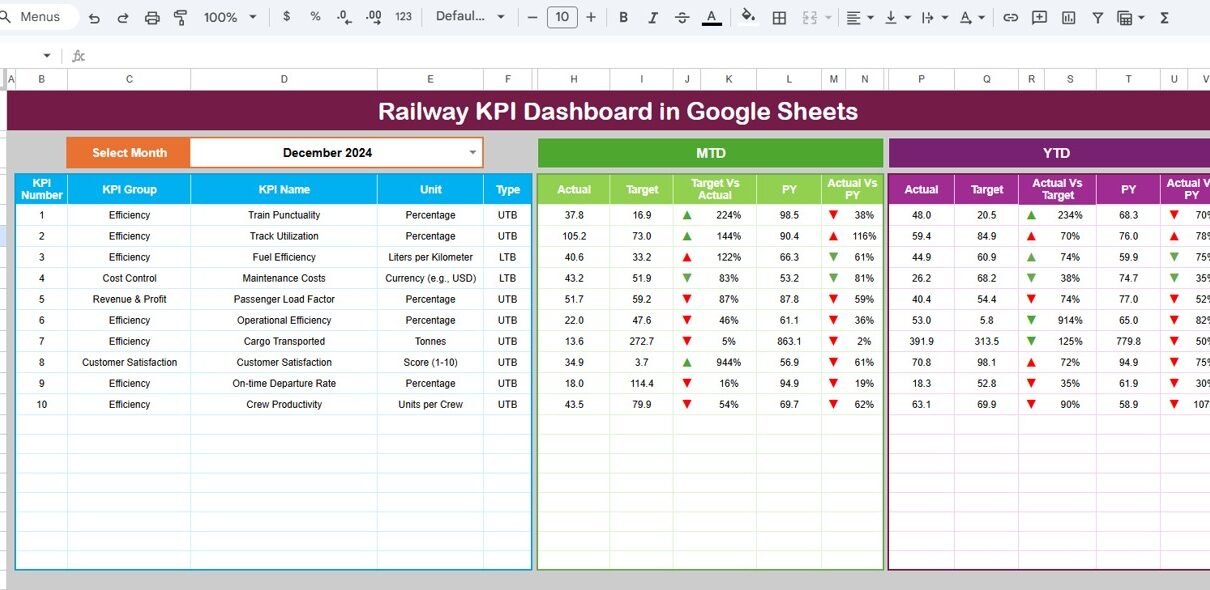
Dashboard Sheet Tab – KPI Performance Overview
The Dashboard Sheet is the main page that displays all railway KPIs at a glance.
🔹 Month Selection
-
A Month dropdown in cell D3 allows users to select any reporting month.
-
Once selected, all KPI values update automatically.
🔹 KPI Metrics Displayed
For each KPI, the dashboard shows:
-
MTD Actual
-
MTD Target
-
MTD Previous Year
-
Target vs Actual variance
-
Previous Year vs Actual variance
All variances use conditional formatting with up/down arrows, making performance interpretation quick and intuitive.
🔹YTD Performance
The dashboard also displays:
-
YTD Actual
-
YTD Target
-
YTD Previous Year
-
Conditional formatting indicators for long-term trends
This structure supports both operational monitoring and strategic review.

Click to Buy Railway KPI Dashboard in Google Sheets
KPI Trend Sheet Tab
The KPI Trend Sheet explains each KPI in detail.
🔹 KPI Selection
-
Select a KPI from the dropdown in cell C3.
🔹 KPI Details Displayed
For the selected KPI, the sheet shows:
-
KPI Group
-
Unit of Measurement
-
KPI Type (Lower the Better / Upper the Better)
-
KPI Formula
-
KPI Definition
This ensures KPI transparency and consistent understanding across teams.

Click to Buy Railway KPI Dashboard in Google Sheets
Actual Number Sheet Tab
This sheet is used to enter actual railway performance data.
🔹 How It Works
-
Enter MTD and YTD actual values for each KPI.
-
Change the reporting month using cell E1.
-
Enter the first month of the year to align YTD calculations.
All dashboard visuals update automatically.

Target Sheet Tab
The Target Sheet stores planned KPI values.
🔹 What You Enter
-
Monthly MTD targets
-
Cumulative YTD targets
This sheet enables structured performance benchmarking.

Click to Buy Railway KPI Dashboard in Google Sheets
Previous Year Number Sheet Tab
This sheet captures previous year KPI data.
🔹 Purpose
-
Enter last year’s MTD and YTD values.
-
Enable year-over-year railway performance analysis.
This is especially useful for seasonal travel trends.

KPI Definition Sheet Tab
The KPI Definition Sheet acts as the KPI master reference.
🔹 Columns Included
-
KPI Name
-
KPI Group
-
Unit
-
Formula
-
KPI Definition
-
KPI Type (LTB / UTB)
This sheet ensures KPI governance and reporting consistency.

Click to Buy Railway KPI Dashboard in Google Sheets
Why Railway Organizations Need This Dashboard
Without a structured KPI dashboard, railway operations rely on fragmented reports. This dashboard helps organizations:
-
Monitor operational efficiency in real time
-
Identify delays and capacity issues early
-
Compare performance against targets
-
Analyze trends across months and years
-
Improve safety, punctuality, and reliability
A single dashboard brings operational clarity and accountability.
Advantages of the Railway KPI Dashboard
-
Centralized railway KPI tracking
-
Clear MTD and YTD performance visibility
-
Automatic comparison with targets and prior year
-
Improved transparency across departments
-
Fully customizable Google Sheets solution
-
No technical or coding skills required
Opportunities for Improvement in Railway KPI Dashboard
Click to Buy Railway KPI Dashboard in Google Sheets
You can enhance this dashboard further by adding:
-
Route-wise or station-wise performance analysis
-
Passenger satisfaction KPIs
-
Asset health monitoring metrics
-
Fuel and energy efficiency analysis
-
Automated data integration from railway systems
These enhancements provide deeper operational insights.
Best Practices for Using the Railway KPI Dashboard
-
Update actual KPI data regularly
-
Define realistic operational targets
-
Review critical KPIs daily or weekly
-
Focus on safety and punctuality KPIs proactively
-
Share insights with operations and leadership teams
-
Restrict edit access to protect data accuracy
Conclusion
A Railway KPI Dashboard in Google Sheets provides a simple yet powerful way to monitor railway operations, safety, and efficiency. It replaces scattered reports with a single source of truth, improves decision-making, and supports continuous operational improvement. Because it is ready to use and cloud-based, railway teams can start tracking KPIs immediately.
For railway authorities and transport operators, this dashboard becomes an essential performance management tool.
Frequently Asked Questions (FAQs)
Click to Buy Railway KPI Dashboard in Google Sheets
1. Who should use this dashboard?
Railway operations teams, infrastructure planners, and management.
2. Can it track multiple KPIs and months?
Yes, it supports unlimited KPIs and reporting periods.
3. Is the dashboard customizable?
Yes, KPIs, formulas, and visuals can be modified.
4. Does it support year-over-year analysis?
Yes, through the previous year comparison sheet.
5. Is Google Sheets secure for railway data?
Yes, with proper access permissions.
6. Does it require advanced technical skills?
No, basic Google Sheets knowledge is enough.
Visit our YouTube channel to learn step-by-step video tutorials
Youtube.com/@NeotechNavigators
Watch the step-by-step video tutorial: