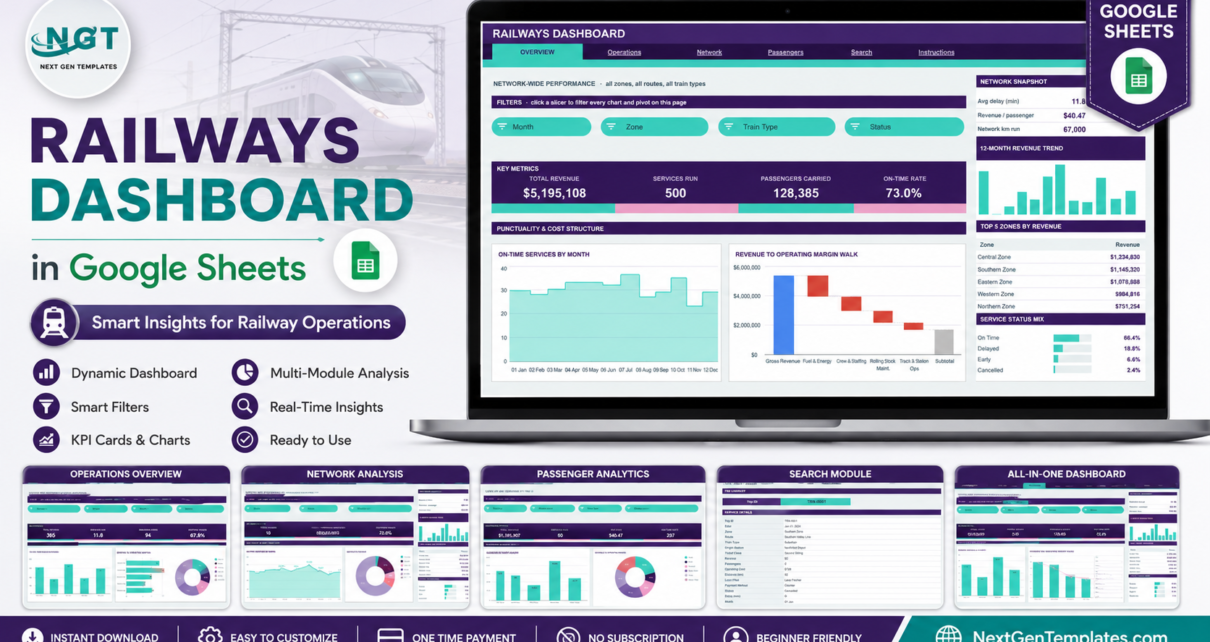
A pivot-and-slicer Railways Dashboard in Google Sheets with 6 tabs, 16 KPI cards, 19 charts and gauges and 15 slicers – covering punctuality, route revenue, operating margin and passenger demand from your own service log.
Online Tutorial for Data Analysis and Automation
A pivot-and-slicer Railways Dashboard in Google Sheets with 6 tabs, 16 KPI cards, 19 charts and gauges and 15 slicers – covering punctuality, route revenue, operating margin and passenger demand from your own service log.
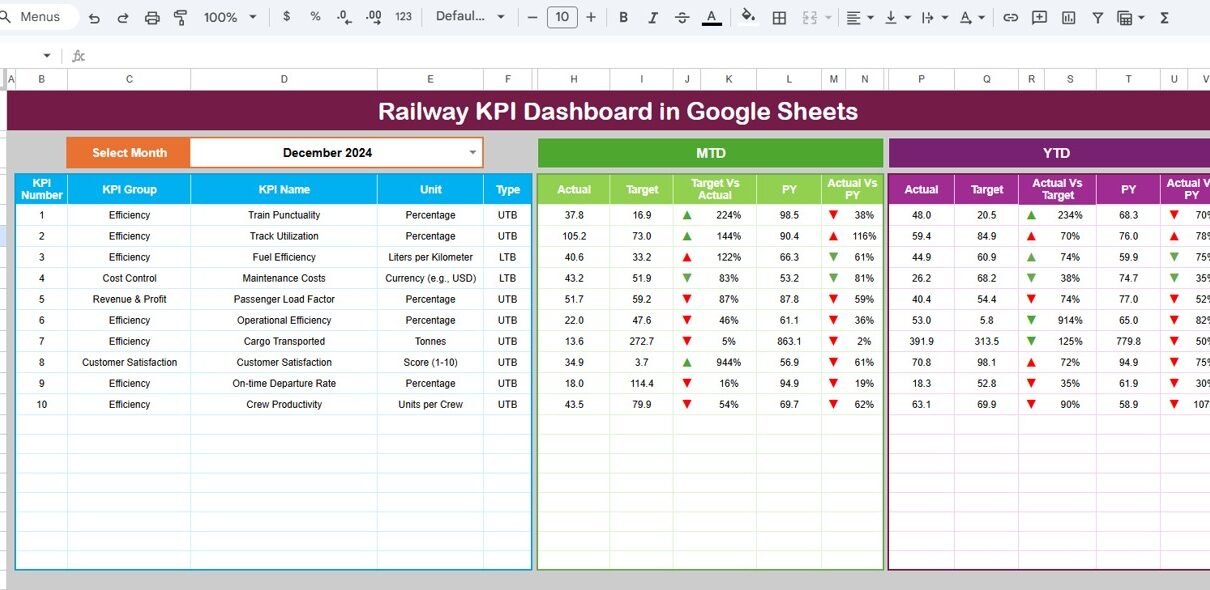
Railway operations involve complex processes such as train punctuality, safety, asset utilization, passenger services, and operational efficiency. Managing these activities without a structured KPI system often leads to delays, cost overruns, and reduced service quality. That is exactly why a Railway KPI Dashboard in Google Sheets becomes a powerful performance monitoring solution. This ready-to-use KPI […]