Managing inventory without clear visibility leads to stockouts, overstocking, and cash flow issues. Therefore, businesses need a simple, visual, and data-driven system to monitor inventory performance. The Product Inventory Dashboard in Google Sheets is a ready-to-use solution that helps you track stock levels, inventory value, reorder requirements, and trends across categories, locations, vendors, and time.
In this article, we will explain what this dashboard is, how it works, its structure, charts, benefits, best practices, and frequently asked questions.
What Is a Product Inventory Dashboard in Google Sheets?
A Product Inventory Dashboard in Google Sheets is an interactive reporting and monitoring tool that consolidates inventory data into a single visual interface. Instead of reviewing multiple spreadsheets, you can analyze inventory health using dynamic cards, charts, and slicers.
Moreover, since it is built in Google Sheets, it supports real-time updates, collaboration, and easy customization without any technical complexity.
Why Is Inventory Tracking Important?\
Click to Buy Product Inventory Dashboard in Google Sheets
Inventory directly impacts sales, cash flow, and customer satisfaction. Without proper tracking:
-
Stockouts delay customer orders
-
Overstock increases holding costs
-
Dead stock blocks working capital
-
Reorder decisions become reactive
Therefore, an inventory dashboard helps businesses stay proactive, reduce risk, and improve operational efficiency.
Key Features of This Ready-to-Use Dashboard
This Product Inventory Dashboard in Google Sheets is designed to deliver clarity at a glance.
🔹 Core Highlights
-
Interactive inventory overview
-
Category, location, and vendor analysis
-
Reorder requirement tracking
-
Monthly inventory trends
-
Advanced slicers for filtering
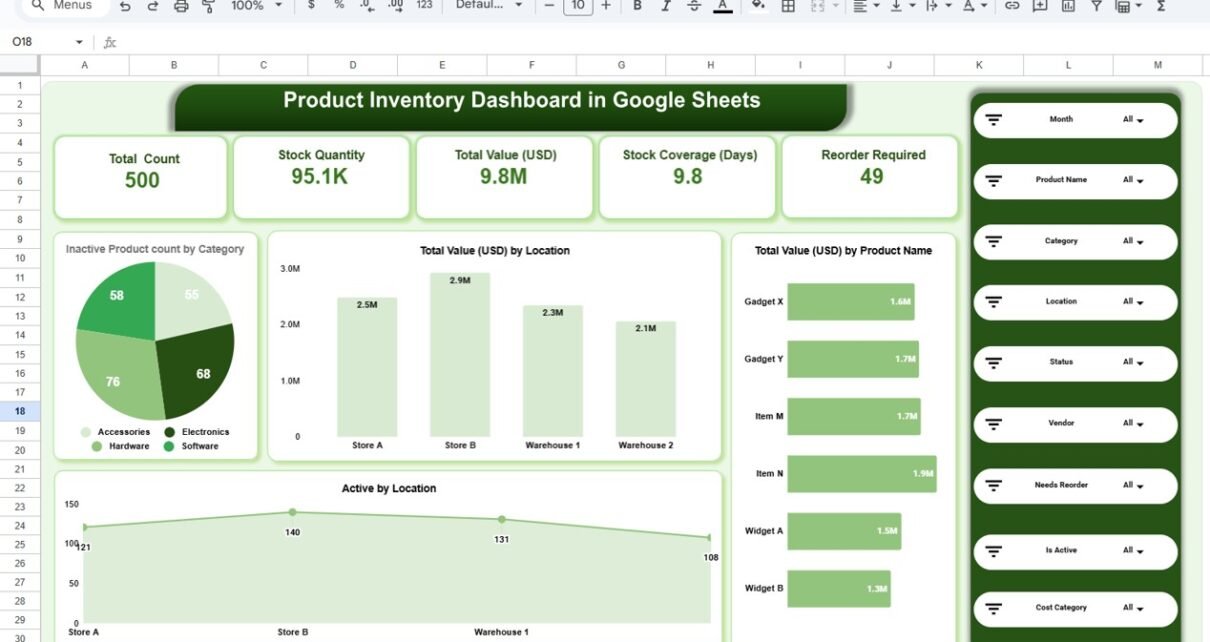
Overview Sheet Tab – Inventory Snapshot
The Overview Sheet Tab gives a high-level summary of inventory performance.
🔹 KPI Cards Display
-
Total Count – Total number of products
-
Stock Quantity – Total available stock
-
Total Value (USD) – Inventory value
-
Stock Coverage (Days) – How long stock will last
-
Reorder Required – Items needing replenishment
These KPIs help decision-makers understand inventory health instantly.

Click to Buy Product Inventory Dashboard in Google Sheets
Category Analysis – Product-Wise Insights
The Category Analysis section helps you understand inventory distribution and risk by category.
Charts Included
-
Total Value (USD) by Category
-
Reorder Required Count by Category
-
Inactive Products by Category
As a result, businesses can identify slow-moving categories and prioritize restocking for high-value items.

Location Analysis – Store & Warehouse Performance
The Location Analysis page shows how inventory performs across stores and warehouses.
Key Visuals
-
Total Value (USD) by Location
-
Inactive Products by Location
-
Reorder Required Count by Location
This view helps operations teams optimize inventory allocation and reduce location-level shortages.

Click to Buy Product Inventory Dashboard in Google Sheets
Vendor Analysis – Supplier Performance Monitoring
Vendor performance directly affects inventory availability. Therefore, the Vendor Analysis page focuses on supplier-wise insights.
Charts Covered
-
Total Value (USD) by Vendor
-
Inactive Products by Vendor
-
Reorder Required Count by Vendor
With this analysis, procurement teams can improve vendor negotiations and reorder planning.

Monthly Trends – Inventory Movement Over Time
The Monthly Trends section tracks how inventory changes month by month.
Trend Charts
-
Total Value (USD) by Month
-
Inactive Products by Month
-
Reorder Required Count by Month
These trends help businesses forecast demand and prevent seasonal stock issues.

Click to Buy Product Inventory Dashboard in Google Sheets
Advantages of Using This Dashboard
Centralized Inventory Visibility
All inventory data lives in one dashboard.
Faster Reorder Decisions
Reorder requirements are clearly highlighted.
Reduced Overstock & Dead Stock
Inactive products are easy to identify.
Better Vendor & Location Control
Performance comparisons become simple.
No Technical Skills Required
Fully built in Google Sheets.
Who Should Use This Dashboard?
This dashboard is ideal for:
-
Retail businesses
-
Wholesale distributors
-
Warehouses and logistics teams
-
Inventory and supply chain managers
-
Small and medium enterprises
Best Practices for Using the Dashboard
Click to Buy Product Inventory Dashboard in Google Sheets
-
Update inventory data regularly
-
Review reorder indicators weekly
-
Track inactive products monthly
-
Use category and vendor insights for planning
-
Share dashboard access with key stakeholders
Opportunities for Improvement
You can further enhance this dashboard by:
-
Integrating barcode or POS data
-
Adding reorder alerts using Google Apps Script
-
Linking supplier lead-time data
-
Automating data entry with Google Forms
Conclusion
Click to Buy Product Inventory Dashboard in Google Sheets
The Product Inventory Dashboard in Google Sheets is a powerful yet easy-to-use solution for monitoring inventory performance. With clear KPIs, dynamic charts, and flexible filters, it enables businesses to control stock levels, reduce risk, and improve profitability.
If you want a ready-to-use, customizable, and collaborative inventory solution, this dashboard is an excellent choice.
Frequently Asked Questions (FAQs)
Is this dashboard fully customizable?
Yes, all KPIs, charts, and fields can be customized.
Can I use it for multiple locations?
Yes, it supports stores and warehouses.
Do I need advanced Google Sheets skills?
No, it is user-friendly and beginner-friendly.
Can multiple users access it?
Yes, Google Sheets allows real-time collaboration.
Is it suitable for small businesses?
Absolutely. It works for both small and large teams.
Visit our YouTube channel to learn step-by-step video tutorials