Gene therapy programs operate in a highly complex, data-driven, and compliance-sensitive environment. Tracking performance manually across experiments, trials, manufacturing, and quality metrics often leads to delays, errors, and missed insights.
That is exactly why the Gene Therapy KPI Dashboard in Google Sheets is a powerful, ready-to-use solution for research teams, biotech companies, and life-science organizations.
This dashboard converts raw KPI data into clear, structured, and actionable insights, helping teams monitor performance, compare targets, and track trends—without complex tools or coding.
What Is the Gene Therapy KPI Dashboard in Google Sheets?
The Gene Therapy KPI Dashboard in Google Sheets is a fully automated KPI tracking template designed to monitor critical gene therapy performance indicators such as efficiency, quality, cost, timelines, and outcomes.
It enables you to:
-
Track MTD, YTD, Target, and Previous Year KPIs
-
Compare Target vs Actual and PY vs Actual
-
Visualize KPI trends over time
-
Maintain KPI definitions, formulas, and classifications in one place
All of this works directly inside Google Sheets, making it cloud-based, collaborative, and easy to maintain.
Dashboard Structure – 6 Key Worksheets
Click to Buy Gene Therapy KPI Dashboard in Google Sheets
The dashboard is logically structured to separate data input, KPI logic, and visualization.
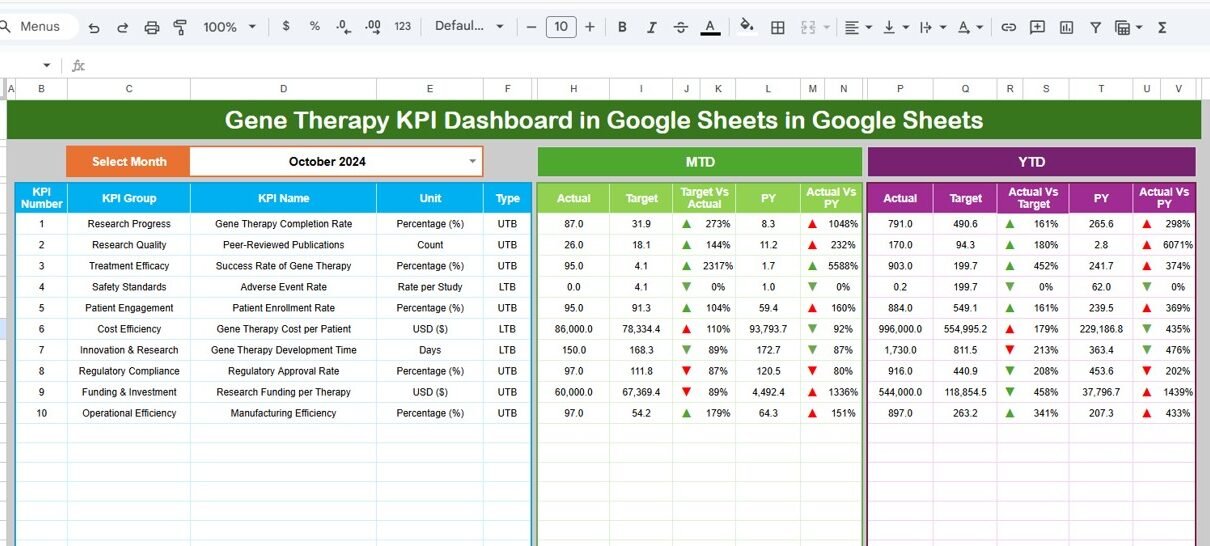
Dashboard Sheet Tab – Executive KPI Overview
This is the main dashboard page where all KPIs are displayed.
🔹 Key Features
-
Month selector available at Cell D3
-
Entire dashboard updates automatically based on selected month
-
Displays:
-
MTD Actual, Target, Previous Year
-
YTD Actual, Target, Previous Year
-
-
Automatic comparison:
-
Target vs Actual
-
Previous Year vs Actual
-
-
Conditional formatting with:
-
🔺 Up arrows for improvement
-
🔻 Down arrows for decline
-
This page is ideal for leadership reviews and monthly performance meetings.

Click to Buy Gene Therapy KPI Dashboard in Google Sheets
KPI Trend Sheet Tab – KPI-Wise Deep Dive
This sheet allows users to analyze one KPI at a time.
🔹 Key Highlights
-
KPI selection dropdown at Cell C3
Displays:
- KPI Group
- KPI Unit
- KPI Type (Upper the Better / Lower the Better)
- KPI Formula
- KPI Definition
This ensures complete transparency and understanding of every KPI being tracked.

Click to Buy Gene Therapy KPI Dashboard in Google Sheets
Actual Number Sheet Tab – Data Entry (Current Year)
This sheet is used to input actual performance data.
🔹 How It Works
-
Enter MTD and YTD actual values
-
Month selection available at Cell E1
-
Only the first month of the year needs to be defined once
-
Remaining calculations adjust automatically
This keeps data entry simple and structured.

Click to Buy Gene Therapy KPI Dashboard in Google Sheets
Target Sheet Tab – KPI Targets
This sheet is used to define performance goals.
🔹 Features
-
Enter MTD and YTD targets for each KPI
Targets feed directly into:
- Dashboard comparisons
- Variance calculations
- Trend analysis
This helps align research, operations, and management goals.

Click to Buy Gene Therapy KPI Dashboard in Google Sheets
Previous Year Number Sheet Tab – Historical Comparison
This sheet stores last year’s KPI data.
🔹 Purpose
-
Enables year-over-year comparison
-
Automatically calculates PY vs Actual variance
-
Helps identify long-term performance trends

Click to Buy Gene Therapy KPI Dashboard in Google Sheets
KPI Definition Sheet Tab – KPI Master Table
This is the backbone of the entire dashboard.
Columns Included
-
KPI Name
-
KPI Group
-
Unit
-
Formula
-
KPI Definition
-
KPI Type (UTB / LTB)
Keeping all KPI logic in one place ensures consistency and audit readiness.

Click to Buy Gene Therapy KPI Dashboard in Google Sheets
Advantages of Gene Therapy KPI Dashboard in Google Sheets
-
Centralized KPI tracking in one file
-
Saves hours of manual reporting
-
Clear performance comparison with targets
-
Ideal for research, clinical, and manufacturing KPIs
-
Cloud-based and team-friendly
-
Reusable across projects and years
Opportunities for Improvement
-
Add automated data imports from lab systems
-
Introduce phase-wise or trial-wise filters
-
Extend KPI library for regulatory compliance tracking
-
Add predictive trend indicators
Best Practices for Using This Dashboard
Click to Buy Gene Therapy KPI Dashboard in Google Sheets
-
Keep KPI definitions standardized
-
Update actual and target data monthly
-
Review UTB/LTB KPIs separately for clarity
-
Use trend analysis for decision-making
-
Share read-only access with stakeholders
Who Can Use This Dashboard?
-
Gene Therapy Research Teams
-
Biotech & Pharmaceutical Companies
-
Clinical Operations Teams
-
Quality & Compliance Teams
-
Life-Science Analysts
-
Program & Portfolio Managers
Final Thoughts
Click to Buy Gene Therapy KPI Dashboard in Google Sheets
The Gene Therapy KPI Dashboard in Google Sheets is a practical, scalable, and business-ready solution for tracking complex gene therapy KPIs with clarity and confidence.
Instead of managing scattered spreadsheets, you get a single, structured KPI system that supports better decisions, stronger performance reviews, and long-term success.
Visit our YouTube channel to learn step-by-step video tutorials
Youtube.com/@NeotechNavigators
Watch the step-by-step video tutorial: