Production planning sits at the heart of every successful manufacturing and operations team. However, many businesses still struggle with scattered spreadsheets, delayed updates, and manual tracking. As a result, production delays, missed targets, and poor coordination become common problems.
That is exactly where a Production Planning Dashboard in Google Sheets makes a real difference.
In this detailed blog post, you will learn what a Production Planning Dashboard in Google Sheets is, why it matters, how it works, its page-wise features, advantages, best practices, and frequently asked questions. By the end of this article, you will clearly understand how this ready-to-use Google Sheets dashboard helps teams plan better, track performance, and take faster decisions.
What Is a Production Planning Dashboard in Google Sheets?
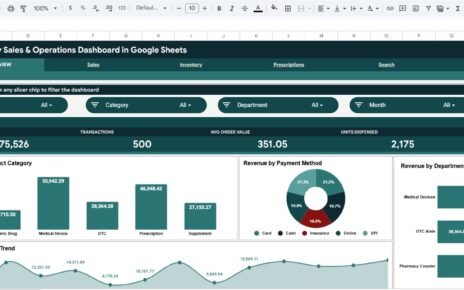
A Production Planning Dashboard in Google Sheets is an interactive and centralized reporting solution that tracks production orders, planned quantity, actual output, delays, priorities, plants, production lines, and planner performance in one place.
Instead of managing multiple files or daily status calls, this dashboard visually presents production data using charts, cards, and slicers. Moreover, because it is built in Google Sheets, teams can collaborate in real time from anywhere.
As a result, production managers gain clarity, control, and confidence in their planning process.
Why Is a Production Planning Dashboard Important?
Click to Buy Production Planning Dashboard in Google Sheets
Production planning directly impacts cost, delivery timelines, and customer satisfaction. Therefore, even small inefficiencies can lead to major losses.
Here is why a production planning dashboard is essential:
- It provides real-time visibility into production status
- It highlights delays before they become critical
- It compares planned vs actual quantities clearly
- It improves coordination between plants and planners
- It supports faster and data-driven decisions
Because Google Sheets is cloud-based, everyone works with the same updated data at all times.
How Does a Production Planning Dashboard in Google Sheets Work?
This dashboard works by connecting structured production data with dynamic charts and slicers.
First, all order-level data sits in a Data Sheet. Then, pivot tables and formulas summarize that data. After that, charts and KPI cards display insights visually. Finally, slicers allow users to filter data by category, plant, status, priority, or planner name.
Because of this flow, users explore production performance without touching complex formulas.
What Are the Key Components of This Dashboard?
Click to Buy Production Planning Dashboard in Google Sheets
The Production Planning Dashboard in Google Sheets includes several well-designed components that work together seamlessly.
Core Components
-
Top-Level Filters (Slicers): Category, Plant, Status, Priority, Planner Name
-
KPI Cards: Total Orders, Planned Quantity, Actual Quantity, Delayed Orders, Completed Orders
-
Visual Charts: Bar charts, line charts, and comparison charts
-
Multiple Analysis Pages: Each page answers specific business questions
-
Clean Layout: Easy to understand for both managers and planners
Together, these components transform raw production data into actionable insights.
What Pages Are Included in the Production Planning Dashboard?
Click to Buy Production Planning Dashboard in Google Sheets
This ready-to-use Google Sheets dashboard includes multiple analytical pages. Each page focuses on a different production dimension.
What Does the Overview Page Show?
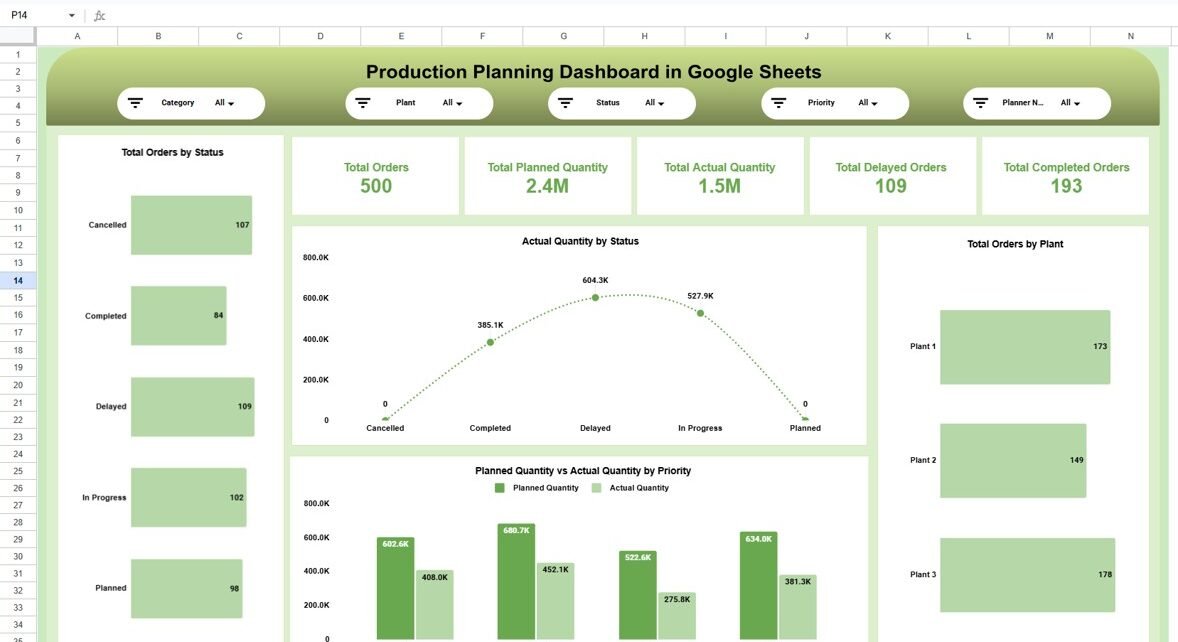
The Overview Page acts as the command center for production planning.
Key Insights on the Overview Page
- Total Orders at a glance
- Total Planned Quantity
- Total Actual Quantity
- Total Delayed Orders
- Total Completed Orders
Charts Available
-
Total Orders by Status (Planned, In Progress, Completed, Delayed, Cancelled)
-
Actual Quantity by Status
-
Planned vs Actual Quantity by Priority
-
Total Orders by Plant
Because everything appears on one screen, managers instantly understand the overall production health.

Click to Buy Production Planning Dashboard in Google Sheets
Category & Plant Analysis Page
The Category & Plant Analysis Page focuses on understanding production performance across product categories and plants.
Key Insights
-
Total Orders by Category
-
Planned vs Actual Quantity by Category
-
Planned vs Actual Quantity by Plant
-
Total Orders Trend by Plant
This page helps teams identify which categories or plants need attention and which perform consistently.

Click to Buy Production Planning Dashboard in Google Sheets
Timeline & Delay Analysis Page
The Timeline & Delay Analysis Page highlights where delays occur and why they happen.
Key Insights
-
Delayed Orders by Production Line
-
Completed Orders by Production Line
-
Completed vs Delayed Orders Comparison
-
Planned vs Actual Quantity by Production Line
Because delays directly impact delivery, this page supports proactive corrective actions.

Click to Buy Production Planning Dashboard in Google Sheets
Planner Performance Page
The Planner Performance Page evaluates individual planner efficiency and workload.
Key Insights
- Total Orders by Planner
- Delayed Orders by Planner
- Completed Orders by Planner
- Planned vs Actual Quantity by Planner
This page ensures accountability and helps balance workloads among planners.

Click to Buy Production Planning Dashboard in Google Sheets
Monthly Trend Page
The Monthly Trend Page tracks production performance over time.
Key Insights
-
Total Orders by Month
-
Delayed Orders by Month
-
Completed Orders by Month
-
Planned vs Actual Quantity by Month
Because trends matter, this page highlights seasonal patterns and emerging issues early.

Click to Buy Production Planning Dashboard in Google Sheets
Advantages of Production Planning Dashboard in Google Sheets
Using this dashboard offers multiple operational and strategic benefits.
Key Advantages
-
Real-Time Collaboration: Multiple users can view and update data simultaneously
-
Centralized Reporting: All production metrics in one dashboard
-
Improved Visibility: Clear view of delays, priorities, and output
-
Faster Decision-Making: No waiting for manual reports
-
Cost-Effective: No expensive BI tools required
-
Fully Customizable: Easy to adapt for any manufacturing setup
Because of these advantages, teams move from reactive firefighting to proactive planning.
Who Should Use a Production Planning Dashboard in Google Sheets?
Click to Buy Production Planning Dashboard in Google Sheets
This dashboard suits a wide range of roles and industries.
Ideal Users
- Production managers
- Operations heads
- Manufacturing planners
- Supply chain teams
- Plant managers
- Small and mid-sized manufacturers
If your role involves production tracking or planning, this dashboard adds immediate value.
How Does This Dashboard Improve Production Efficiency?
This dashboard improves efficiency in several ways:
-
It highlights gaps between planned and actual output
-
It identifies delay-prone production lines
-
It improves planner accountability
-
It supports priority-based execution
-
It reduces dependency on manual follow-ups
As a result, production teams work smarter, not harder.
Best Practices for the Production Planning Dashboard in Google Sheets
Click to Buy Production Planning Dashboard in Google Sheets
To get maximum value from this dashboard, follow these best practices.
1. Keep Data Clean and Consistent
Use standard values for status, priority, and categories.
2. Update Data Daily
Daily updates ensure accurate and actionable insights.
3. Use Filters Before Decisions
Always apply slicers before reviewing numbers.
4. Protect Key Sheets
Lock formulas and charts to avoid accidental edits.
5. Review Delays Regularly
Use the delay analysis page to address root causes quickly.
Following these practices keeps the dashboard reliable and scalable.
How Is This Dashboard Different from Traditional Production Reports?
Click to Buy Production Planning Dashboard in Google Sheets
Unlike static reports, this dashboard:
-
Updates instantly with filters
-
Supports multi-dimensional analysis
-
Encourages exploration instead of guesswork
-
Saves hours of reporting time
Therefore, it acts as a decision-support system rather than just a report.
Conclusion
A Production Planning Dashboard in Google Sheets is a powerful, flexible, and cost-effective solution for modern manufacturing and operations teams. It brings orders, quantities, delays, planners, plants, and trends into one interactive view.
Moreover, because it runs on Google Sheets, it supports real-time collaboration and easy customization. By using this dashboard, organizations improve visibility, reduce delays, and make faster, data-driven production decisions.
Frequently Asked Questions (FAQs)
Click to Buy Production Planning Dashboard in Google Sheets
What is a Production Planning Dashboard in Google Sheets?
It is an interactive dashboard that tracks production orders, planned vs actual quantities, delays, and planner performance using Google Sheets.
Can multiple users work on this dashboard?
Yes, Google Sheets allows real-time collaboration for multiple users.
Does this dashboard support planned vs actual analysis?
Yes, planned vs actual quantity analysis appears across multiple pages.
Is this dashboard suitable for small businesses?
Yes, it works perfectly for small and mid-sized manufacturing teams.
Can I customize this dashboard?
Yes, you can easily add new charts, filters, or KPIs.
Does this replace manual production reports?
Yes, it significantly reduces manual reporting effort and improves accuracy.
Visit our YouTube channel to learn step-by-step video tutorials
Youtube.com/@NeotechNavigators
Watch the step-by-step video tutorial: