An Inventory Accuracy KPI Dashboard in Google Sheets is a structured performance tracking tool. It helps warehouse managers, supply chain teams, and inventory controllers measure stock accuracy and operational efficiency.Inventory Accuracy KPI Dashboard in Google Sheets
Because the dashboard runs on Google Sheets, you can access it from anywhere. Moreover, your team can collaborate in real time.Inventory Accuracy KPI Dashboard in Google Sheets
With this dashboard, you can:
- Track inventory accuracy KPIs
- Compare Actual vs Target
- Compare Current Year vs Previous Year
- Monitor monthly and yearly performance
- Analyze KPI trends visually
What Are the Key Features of the Inventory Accuracy KPI Dashboard?
Click to Buy Inventory Accuracy KPI Dashboard in Google Sheets
This dashboard includes 6 structured worksheets. Each worksheet plays an important role.Inventory Accuracy KPI Dashboard in Google Sheets
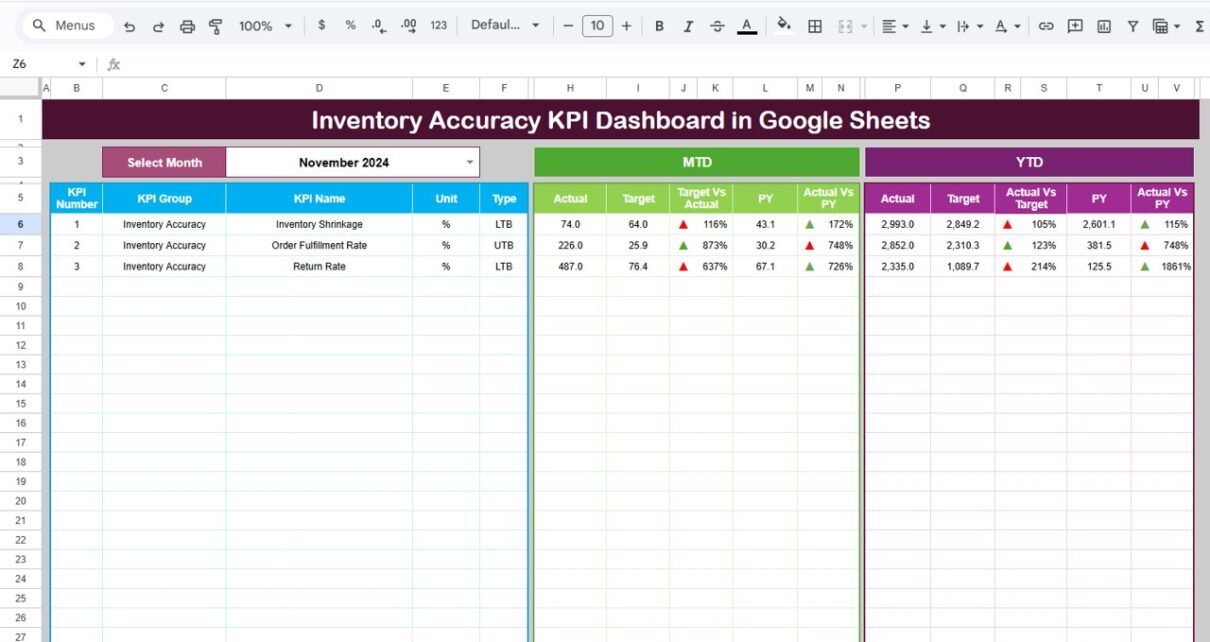
Dashboard Sheet Tab – Main Overview Page
This sheet acts as the main reporting page.
On Range D3, you can select the month from the drop-down menu. Once selected, the entire dashboard updates automatically.
What Does the Dashboard Show?
MTD Section:
- Actual
- Target
- Previous Year
- Target vs Actual %
- PY vs Actual %
- Conditional formatting with up/down arrows
YTD Section:
- Actual
- Target
- Previous Year
- Target vs Actual %
- PY vs Actual %
- Conditional formatting arrows
Therefore, managers instantly understand performance gaps.
Because visual arrows highlight improvement or decline, decision-making becomes easier.

Click to Buy Inventory Accuracy KPI Dashboard in Google Sheets
KPI Trend Sheet Tab
This sheet allows deep analysis of individual KPIs.
On Range C3, you can select the KPI name from a drop-down list.
Once selected, the sheet displays:
- KPI Group
- Unit of KPI
- KPI Type (Lower the Better / Upper the Better)
- Formula of the KPI
- KPI Definition
- MTD Trend Chart
- YTD Trend Chart
As a result, you can analyze monthly patterns and yearly growth clearly.

Click to Buy Inventory Accuracy KPI Dashboard in Google Sheets
Actual Number Sheet Tab
Here, you enter:
- Monthly MTD actual numbers
- YTD cumulative numbers
On Range E1, you input the first month of the year. Therefore, the system aligns calculations automatically.
Because data entry stays separate from reporting, the risk of errors reduces significantly.

Click to Buy Inventory Accuracy KPI Dashboard in Google Sheets
Target Sheet Tab
In this sheet, you enter:
- Monthly MTD targets
- Monthly YTD targets
Targets help measure success. Without targets, performance tracking becomes meaningless. Therefore, this sheet ensures proper planning.

Previous Year Number Sheet Tab
This sheet stores:
- Previous year MTD numbers
- Previous year YTD numbers
Historical comparison helps you evaluate improvement or decline. Consequently, you can adjust inventory strategies accordingly.

Click to Buy Inventory Accuracy KPI Dashboard in Google Sheets
KPI Definition Sheet Tab
This sheet ensures clarity and consistency.
Here, you enter:
- KPI Name
- KPI Group
- Unit
- Formula
- KPI Definition
Because all KPI logic stays centralized, every stakeholder interprets metrics correctly

Click to Buy Inventory Accuracy KPI Dashboard in Google Sheets
Advantages of Inventory Accuracy KPI Dashboard in Google Sheets
Improves Stock Control
You detect discrepancies quickly.
Reduces Financial Loss
You minimize shrinkage and stock-outs.
Enhances Warehouse Efficiency
Teams improve picking and counting accuracy.
Supports Better Forecasting
Historical data improves demand planning.
Enables Real-Time Collaboration
Google Sheets allows multi-user access.
Best Practices for Inventory Accuracy KPI Dashboard
To maximize results, follow these practices:
✔ Update Data Regularly
Enter monthly data without delay.
✔ Conduct Routine Cycle Counts
Regular physical checks improve accuracy.
✔ Align KPIs with Business Goals
Track metrics that directly impact profitability.
✔ Monitor Trends, Not Just Numbers
Review long-term patterns before making decisions.
✔ Train Warehouse Staff
Ensure everyone understands KPI meaning.
Conclusion
Click to Buy Inventory Accuracy KPI Dashboard in Google Sheets
Inventory accuracy directly impacts revenue, customer satisfaction, and operational efficiency. Therefore, businesses must monitor stock performance carefully.
The Inventory Accuracy KPI Dashboard in Google Sheets provides a simple yet powerful solution. With month selection, MTD/YTD tracking, trend charts, and KPI definitions, this dashboard transforms raw inventory data into actionable insights.
Visit our YouTube channel to learn step-by-step video tutorials
Youtube.com/@NeotechNavigators
Watch the step-by-step video tutorial:
Click to Buy Inventory Accuracy KPI Dashboard in Google Sheets