The fashion industry moves fast. Trends change every season. Moreover, customer demand shifts quickly. Therefore, fashion brands must track sales, margins, inventory, and customer performance in real time.Fashion KPI Scorecard in Google Sheets
However, many fashion businesses still depend on scattered Excel sheets. As a result, managers struggle to compare monthly performance, track targets, and monitor growth.Fashion KPI Scorecard in Google Sheets
That is why we created the Fashion KPI Scorecard in Google Sheets — a ready-to-use performance tracking template.
This scorecard includes 10 carefully selected KPIs to measure financial performance, inventory efficiency, and customer trends.
Let us explore everything in detail.Fashion KPI Scorecard in Google Sheets
All KPIs for Fashion KPI Scorecard in Google Sheets
Click to Buy Fashion KPI Scorecard in Google Sheets
Below is the structured KPI list for your KPI Definition Sheet Tab.
This is a ready-to-use template designed for monthly and yearly performance tracking.
The scorecard includes the following worksheets:
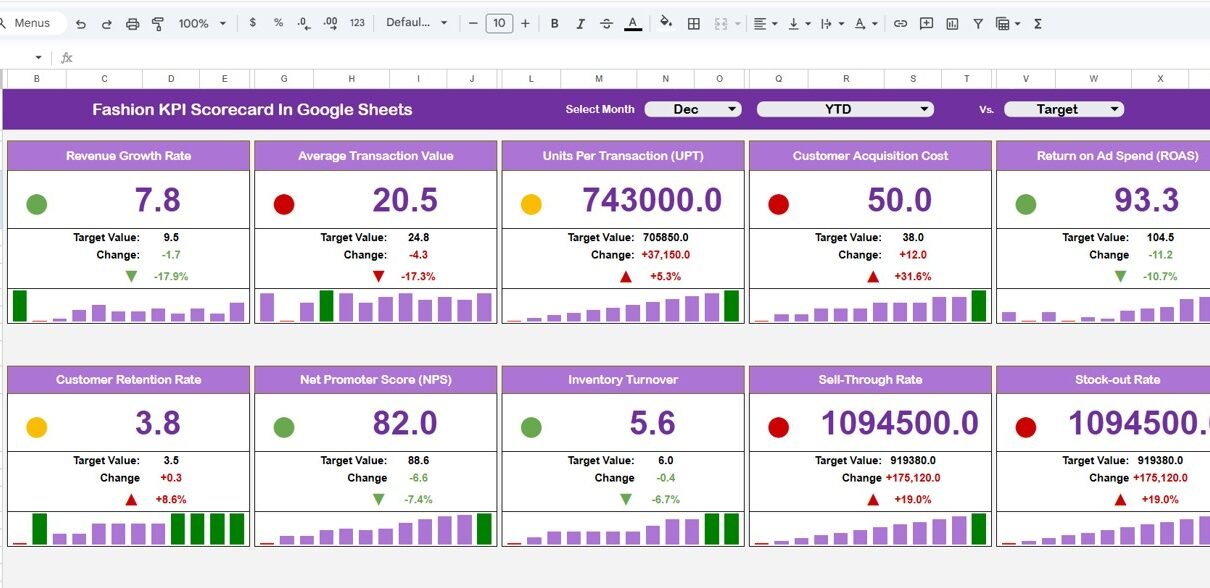
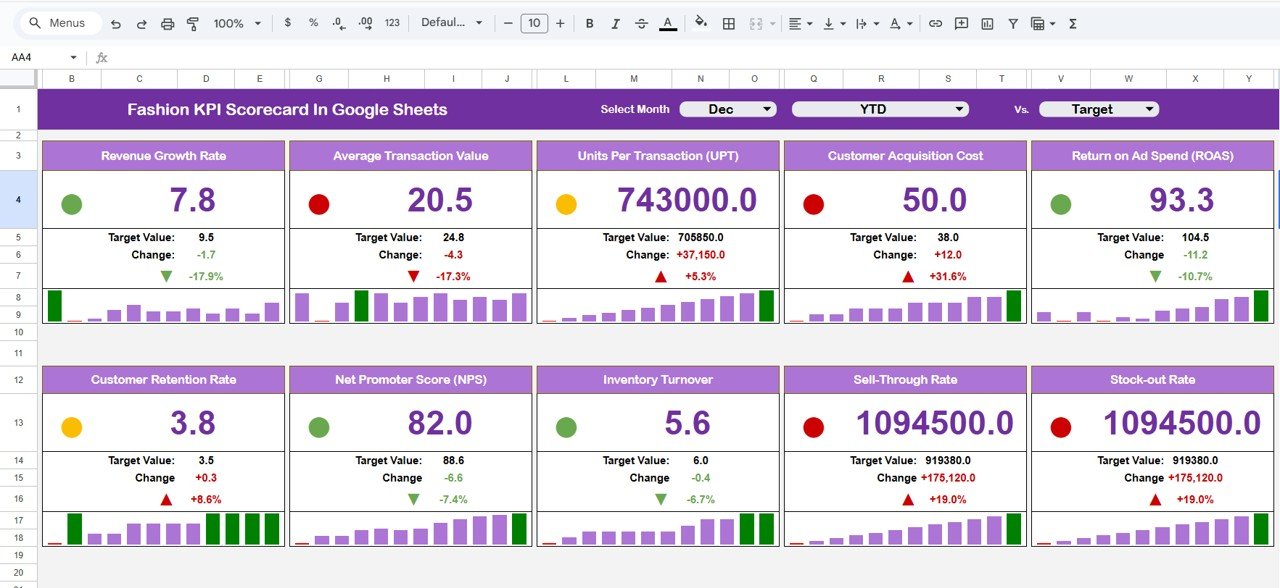
Dashboard Sheet Tab
This is the primary performance page.
🔹 Month Selection Dropdown (Top Section)
-
You can select any month from the dropdown.
-
The dashboard instantly updates.
-
Traffic lights change automatically.
-
Up/down arrows show percentage changes.
🔹 MTD & YTD Buttons
-
Click MTD to view monthly performance.
-
Click YTD to view yearly cumulative performance.
🔹 What This Dashboard Displays:
-
MTD Actual
-
MTD Target
-
Previous Year MTD
-
Target vs Actual %
-
Previous Year vs Actual %
-
YTD Actual
-
YTD Target
-
Previous Year YTD
Because of this dynamic structure, decision-makers get instant clarity.
Click to Buy Fashion KPI Scorecard in Google Sheets
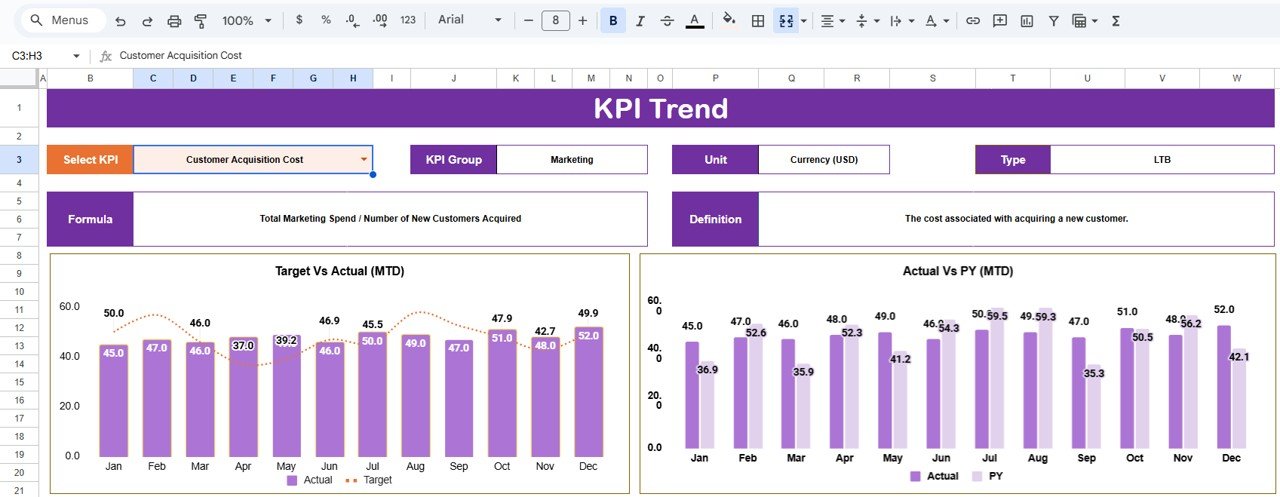
Trend Sheet Tab
This sheet provides detailed KPI-level trend analysis.
🔹 Cell C3 Dropdown
-
Select a KPI name.
The sheet automatically displays:
- KPI Group
- KPI Unit
- KPI Type (Lower the Better / Upper the Better)
- KPI Formula
- KPI Definition
- Monthly Trend Chart
Therefore, managers can analyze performance direction throughout the year.
Click to Buy Fashion KPI Scorecard in Google Sheets
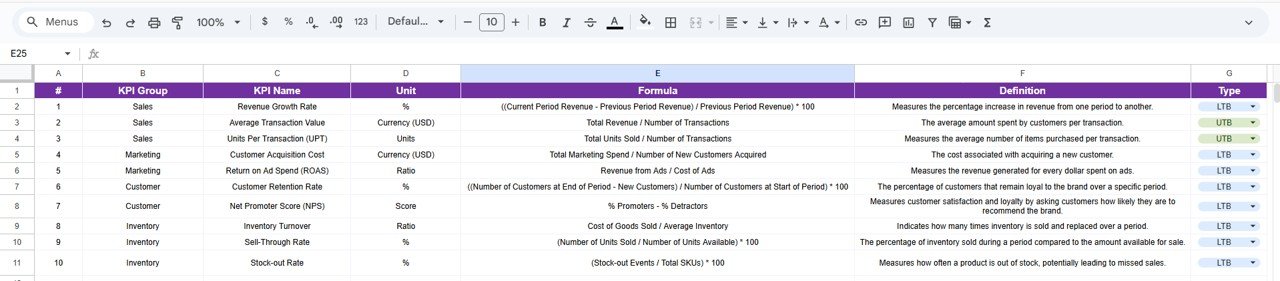
KPI Definition Sheet Tab
This sheet contains:
-
KPI Name
-
KPI Group
-
Unit
-
Formula
-
KPI Definition
-
KPI Type (LTB / UTB)
Because this sheet centralizes logic, it ensures consistent KPI understanding across the organization.
Click to Buy Fashion KPI Scorecard in Google Sheets
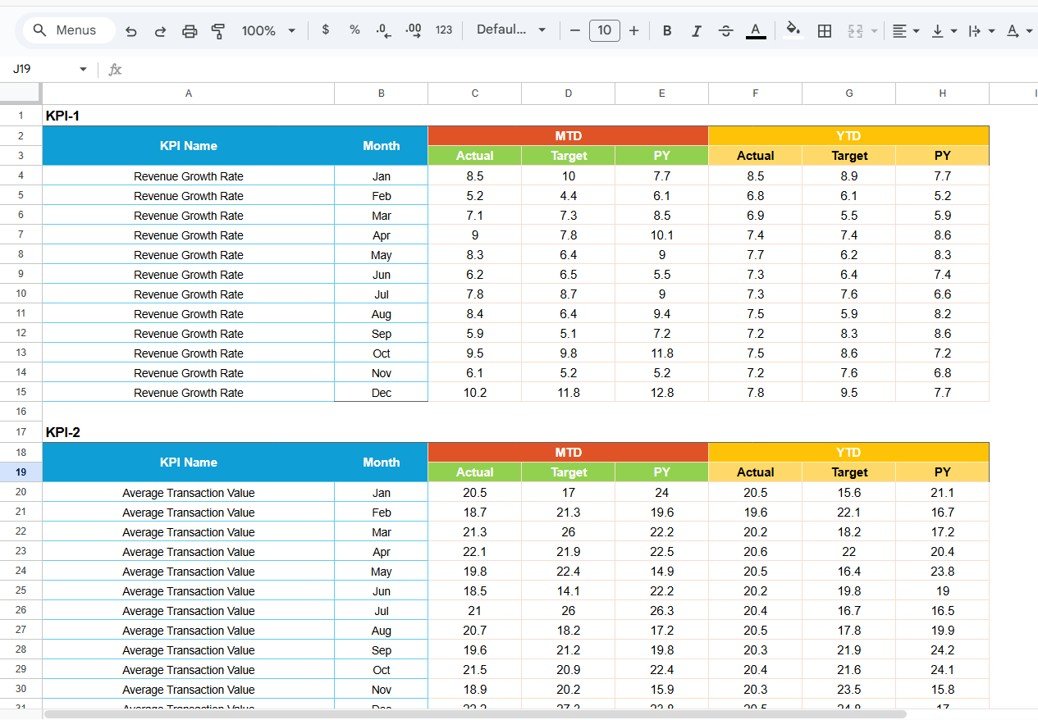
Data Input Sheet Tab
In this sheet, you enter:
-
Monthly Actual Data
-
Monthly Target Data
-
Previous Year Data
Once you enter the numbers:
-
Dashboard updates automatically
-
Trend charts refresh
-
Traffic lights adjust
Therefore, this sheet powers the entire scorecard.
Click to Buy Fashion KPI Scorecard in Google Sheets
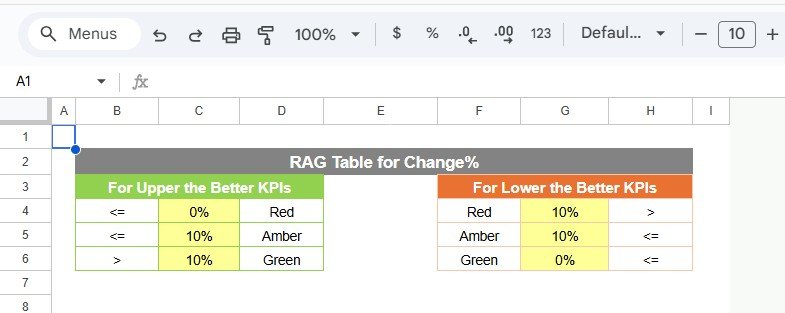
Colour Settings Sheet Tab
This sheet controls visual indicators.
🔹 Traffic Light Colors
-
Green → Target Achieved
-
Yellow → Slight Deviation
-
Red → Target Missed
🔹 Arrow Indicators
-
Up Arrow → Positive Growth
-
Down Arrow → Negative Growth
Because color logic works dynamically, the dashboard remains professional and visually clear.
Click to Buy Fashion KPI Scorecard in Google Sheets
Advantages of Fashion KPI Scorecard in Google Sheets
1. Real-Time Monthly Monitoring
You track performance instantly by selecting any month.
2. Clear Financial Visibility
You monitor revenue, margins, and growth easily.
3. Inventory Control
You track turnover, sell-through, and stock-out rates.
4. Marketing Performance Tracking
You evaluate customer acquisition costs effectively.
5. Professional Visual Presentation
Traffic lights and arrows improve clarity.
6. Easy to Use
No coding required. Just enter data.
Best Practices for Fashion KPI Scorecard in Google Sheets
Click to Buy Fashion KPI Scorecard in Google Sheets
To maximize impact, follow these best practices:
1. Update Data Monthly
Always enter actual and target numbers on time.
2. Define Realistic Targets
Base targets on past performance trends.
3. Monitor LTB KPIs Carefully
Focus on return rate and stock-out rate.
4. Review Growth Trends Quarterly
Analyze long-term patterns, not just monthly spikes.
5. Maintain Data Accuracy
Cross-check revenue and cost figures regularly.
6. Share Dashboard with Team
Encourage accountability and transparency.
Who Should Use This Scorecard?
Click to Buy Fashion KPI Scorecard in Google Sheets
-
Fashion retail brands
-
Apparel manufacturers
-
E-commerce fashion stores
-
Boutique owners
-
Fashion chain stores
-
Fashion startup founders
If you want structured performance tracking, this scorecard helps you make smarter decisions.
Conclusion
The fashion industry demands speed, precision, and adaptability. However, without structured performance tracking, businesses struggle to measure growth and profitability.
The Fashion KPI Scorecard in Google Sheets provides a ready-to-use solution. It tracks 10 essential KPIs, compares MTD and YTD data, displays traffic lights, and highlights performance changes clearly.
Visit our YouTube channel to learn step-by-step video tutorials
Youtube.com/@NeotechNavigators
Watch the step-by-step video tutorial: