Manufacturing organizations handle hundreds of production orders, multiple plants, planners, product categories, and strict delivery timelines every day. However, many companies still manage operations using disconnected spreadsheets and manual reporting methods. As a result, delays increase, productivity drops, and decision-making becomes reactive instead of strategic.
Therefore, businesses now adopt intelligent dashboards that transform operational data into actionable insights. One powerful and practical solution is the Plant Operations Dashboard in Google Sheets — a ready-to-use analytics system designed to monitor plant performance, production progress, delays, and planner efficiency in real time.
In this detailed guide, we will explain the Plant Operations Dashboard in Google Sheets, its structure, dashboard pages, benefits, best practices, and how it helps organizations improve operational efficiency.
What Is a Plant Operations Dashboard in Google Sheets?
A Plant Operations Dashboard in Google Sheets is an interactive reporting and analytics tool that helps manufacturing teams track production activities using automated calculations and visual dashboards.
Instead of reviewing multiple reports, managers analyze operational KPIs from a single centralized platform. Moreover, dynamic filters allow users to explore data instantly based on plant, category, status, priority, or planner.
This dashboard helps organizations:
- Monitor total production orders
- Compare planned vs actual quantities
- Track delayed and completed orders
- Analyze plant and category performance
- Evaluate planner productivity
- Identify operational bottlenecks
- Monitor monthly production trends
Consequently, decision-makers gain full operational visibility and respond quickly to challenges.
Structure of the Plant Operations Dashboard in Google Sheets
Click to Buy Plant Operations Dashboard in Google Sheets
The dashboard contains multiple analytical pages. Each page focuses on a specific operational perspective and answers important business questions.
Plant Operations Overview – Complete Production Snapshot
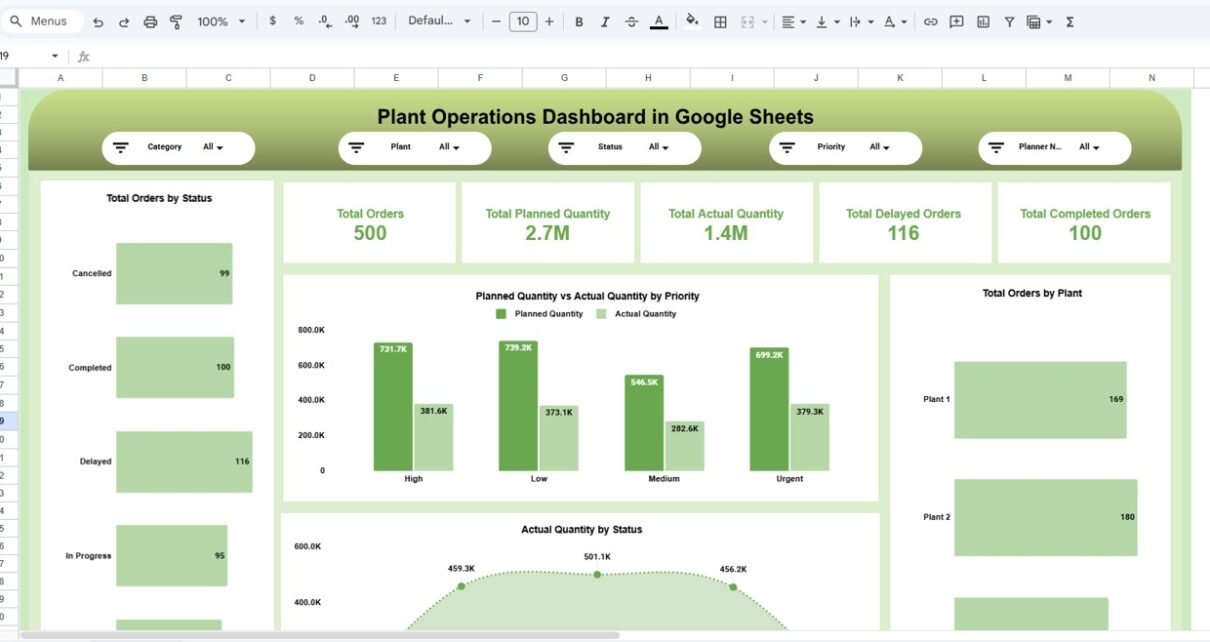
The Overview Page acts as the main control center of the dashboard. It provides a quick summary of operational performance.
Interactive Filters Available
Users can filter data using slicers such as:
- Category
- Plant
- Status
- Priority
- Planner Name
Because filters update visuals instantly, users analyze specific scenarios easily.
Key KPI Cards Displayed
- Total Orders: 500
- Total Planned Quantity: 2.7M
- Total Actual Quantity: 1.4M
- Total Delayed Orders: 116
- Total Completed Orders: 100

Click to Buy Plant Operations Dashboard in Google Sheets
Timeline & Delay Analysis – How Do You Identify Production Bottlenecks?
Production delays directly affect delivery commitments and customer satisfaction. Therefore, this page focuses on identifying delays.
Charts Available
- Delayed Orders by Production Line
- Completed Orders by Production Line
- Completed vs Delayed Orders Comparison
- Planned vs Actual Quantity by Production Line

Click to Buy Plant Operations Dashboard in Google Sheets
Category & Plant Analysis – Which Areas Perform Better?
Manufacturing performance varies across categories and plants. Hence, analyzing performance at multiple levels becomes essential.
Key Visualizations
- Total Orders by Category
- Planned vs Actual Quantity by Category
- Planned vs Actual Quantity by Plant
- Total Orders by Plant

Click to Buy Plant Operations Dashboard in Google Sheets
Planner Performance – Measuring Planning Efficiency
Production planners play a critical role in operational success. This page evaluates planner productivity and execution accuracy.
Metrics Included
- Total Orders by Planner Name
- Delayed Orders by Planner
- Completed Orders by Planner
- Planned vs Actual Quantity by Planner

Click to Buy Plant Operations Dashboard in Google Sheets
Monthly Trend Analysis – How Does Performance Change Over Time?
Operational performance evolves monthly. Therefore, trend analysis helps organizations understand long-term patterns.
Charts Included
- Total Orders by Month
- Delayed Orders Trend
- Completed Orders by Month
- Planned vs Actual Quantity by Month

Click to Buy Plant Operations Dashboard in Google Sheets
Search & Data Explorer – Fast Record Lookup
Large production datasets often make searching difficult. This dashboard includes a powerful search feature.
Key Capabilities
- Search by column name
- Keyword-based filtering
- Instant record retrieval
- Detailed production data view
Users locate specific orders quickly without scrolling through datasets.

Click to Buy Plant Operations Dashboard in Google Sheets
Advantages of Plant Operations Dashboard in Google Sheets
Implementing this dashboard offers multiple benefits.
Real-Time Operational Visibility
Managers monitor performance instantly.
Centralized Reporting
All plant data appears in one location.
Improved Decision-Making
Visual insights simplify analysis.
Delay Reduction
Teams identify bottlenecks quickly.
Better Planner Accountability
Performance tracking improves planning accuracy.
Easy Collaboration
Google Sheets enables cloud-based teamwork.
Cost-Effective Solution
No expensive software investment required.
Best Practices for the Plant Operations Dashboard
Click to Buy Plant Operations Dashboard in Google Sheets
To maximize dashboard effectiveness, organizations should follow these practices.
. Maintain Accurate Data
Always validate production inputs.
. Update Data Regularly
Schedule consistent updates.
. Define Clear KPIs
Align metrics with operational goals.
. Use Filters Effectively
Analyze performance by plant and category.
. Keep Dashboard Simple
Avoid unnecessary visuals.
. Train Team Members
Ensure users understand dashboard usage.
. Monitor Trends Frequently
Review monthly performance consistently.
Opportunities for Improvement in Plant Analytics
Click to Buy Plant Operations Dashboard in Google Sheets
Organizations can further enhance analytics by:
- Adding inventory tracking KPIs
- Integrating maintenance performance metrics
- Including machine utilization analysis
- Using predictive forecasting models
- Automating alerts for delayed orders
As analytics maturity grows, operational efficiency improves significantly.
Conclusion
The Plant Operations Dashboard in Google Sheets transforms manufacturing data into actionable insights. Instead of relying on manual reports, organizations gain real-time visibility into production orders, delays, planner performance, and plant efficiency.
Because the dashboard combines automation, visualization, and interactivity, managers make faster decisions and improve operational performance consistently. Moreover, its structured analytical pages ensure that every level of management understands production performance clearly.
In today’s competitive manufacturing environment, data-driven operations are no longer optional. Therefore, implementing a Plant Operations Dashboard becomes a powerful step toward operational excellence and sustainable growth.
Frequently Asked Questions (FAQs)
Click to Buy Plant Operations Dashboard in Google Sheets
What is a Plant Operations Dashboard?
It is an analytical dashboard that tracks production orders, quantities, delays, and performance metrics in one centralized system.
Why use Google Sheets for operations dashboards?
Google Sheets allows real-time collaboration, automation, and cloud accessibility without expensive software.
Can small manufacturing companies use this dashboard?
Yes. The dashboard works for both small and large manufacturing operations.
Does the dashboard update automatically?
Yes, once data updates, charts and KPIs refresh automatically.
What data is required for this dashboard?
Production orders, quantities, plant details, planner names, status, and timeline data.
How does the dashboard reduce delays?
It highlights delayed orders and problematic production lines instantly.
Can the dashboard be customized?
Yes. Organizations can add KPIs, filters, or new analysis pages.
Who should use this dashboard daily?
Production managers, planners, analysts, and executives benefit from daily monitoring.
Does it require advanced technical skills?
No. Basic Google Sheets knowledge is enough to operate the dashboard.
What is the biggest advantage of this dashboard?
It provides centralized, real-time operational visibility that improves decision-making and productivity.
Visit our YouTube channel to learn step-by-step video tutorials
Youtube.com/@NeotechNavigators
Watch the step-by-step video tutorial: