Legal operations involve complex processes such as case management, client communication, cost tracking, compliance monitoring, and performance analysis. Law firms and corporate legal departments often handle hundreds of cases simultaneously. Therefore, tracking everything manually becomes extremely difficult.
Many legal teams still rely on scattered spreadsheets or disconnected reports to monitor case progress. As a result, managers struggle to understand case status, control legal expenses, and evaluate team performance.
However, a structured analytics system can solve this problem effectively. This is where the Legal Dashboard in Google Sheets becomes extremely useful.
The Legal Dashboard in Google Sheets is a powerful, ready-to-use analytical tool designed to help law firms and legal departments track case progress, monitor legal costs, evaluate client satisfaction, and analyze lawyer performance. Because Google Sheets operates in the cloud, teams can access and update the dashboard from anywhere.
In this article, you will learn everything about the Legal Dashboard in Google Sheets, including its features, advantages, implementation methods, best practices, and real-world applications.
What Is a Legal Dashboard in Google Sheets?
A Legal Dashboard in Google Sheets is a data visualization and reporting system that tracks legal operations in an organized and interactive format.
The dashboard converts raw legal data into visual charts, KPI cards, and analytical reports, allowing managers to quickly understand operational performance.
Instead of reviewing multiple spreadsheets, legal teams can analyze all important metrics in one centralized dashboard.
The dashboard typically tracks key information such as:
- Total legal cases
- Case status
- Client satisfaction scores
- Estimated and actual legal costs
- Lawyer workload
- Department performance
- Monthly trends
Because Google Sheets supports cloud collaboration, multiple team members can update the data simultaneously.
Why Do Law Firms Need a Legal Dashboard?
Click to Buy Legal Dashboard in Google Sheets
Legal teams manage numerous cases, clients, and legal processes every day. Therefore, tracking performance manually becomes inefficient.
A Legal Dashboard in Google Sheets helps organizations:
- Monitor legal case progress
- Track litigation costs
- Measure lawyer productivity
- Analyze department performance
- Improve client satisfaction
- Identify operational bottlenecks
Consequently, managers gain clear visibility into legal operations.
Key Features of the Legal Dashboard in Google Sheets
This dashboard contains several interactive analytical pages designed to provide detailed insights into legal operations.
Page Navigator
The dashboard includes a left-side navigation panel with slicers or filters.
These filters allow users to analyze data based on:
- Client Name
- Case Type
- Department
- Lawyer Assigned
- Case Status
Because users can easily change filters, they can analyze data from multiple perspectives.
The dashboard includes five analytical pages.
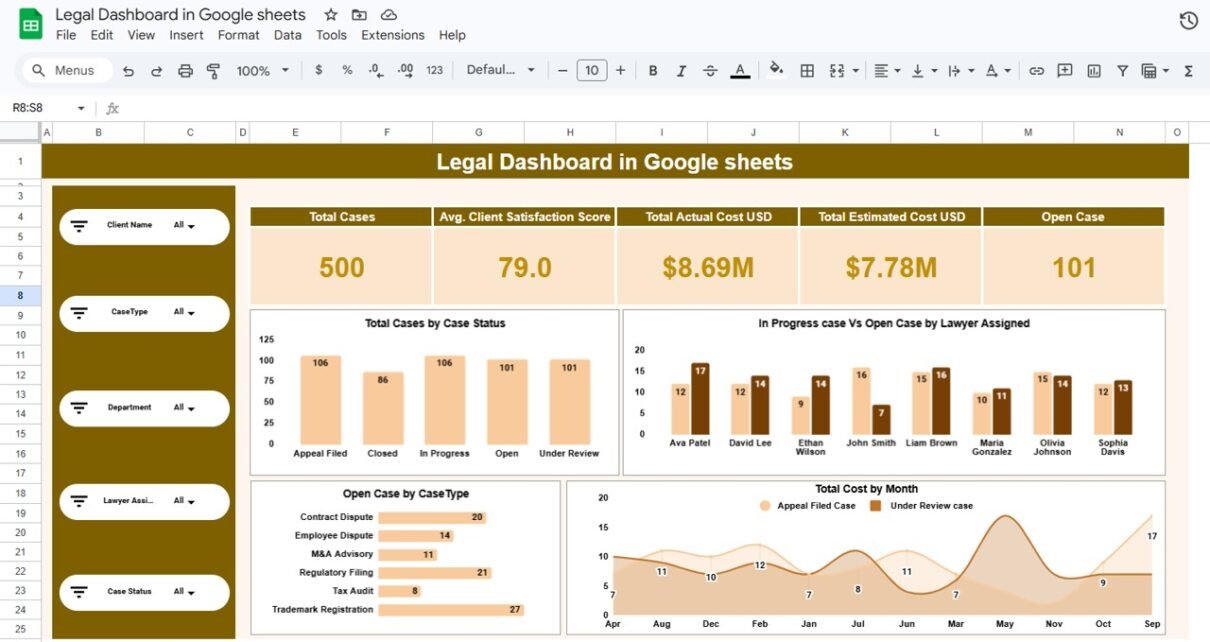
Overview Page: What Does the Main Legal Dashboard Show?
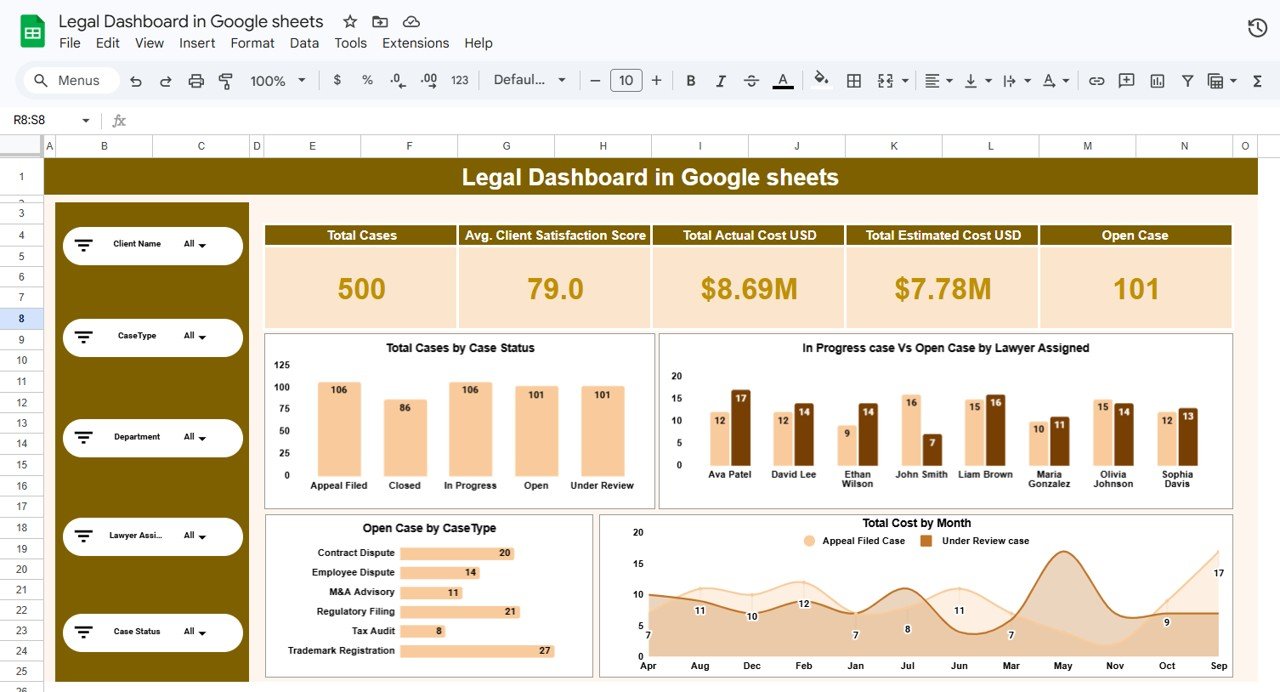
The Overview Page provides a high-level summary of legal operations.
Managers can quickly review the overall legal performance of the organization.
KPI Cards on the Overview Page
The dashboard displays several important KPIs:
- Total Cases
- Average Client Satisfaction Score
- Total Actual Cost (USD)
- Total Estimated Cost (USD)
- Open Cases
These KPI indicators allow managers to immediately evaluate legal workload and financial exposure.
Charts on the Overview Page
The Overview page includes the following analytical charts:
- Total Cases by Case Status
- In Progress Case vs Open Case by Lawyer Assigned
- Open Cases by Case Type
- Total Cost by Month
These charts help legal managers identify operational trends and workload distribution.
Click to Buy Legal Dashboard in Google Sheets
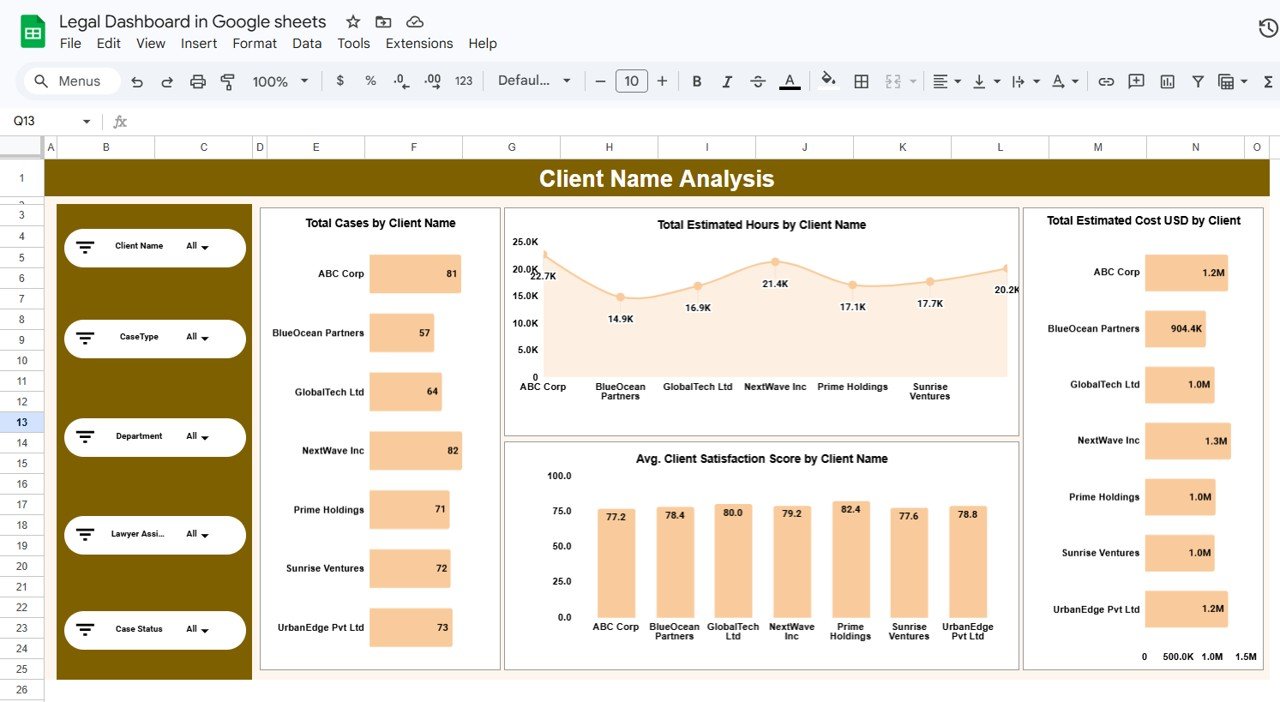
Client Name Analysis: How Do Different Clients Impact Legal Workload?
Legal firms often serve multiple corporate clients. Each client generates different types of cases and legal expenses.
The Client Name Analysis Page provides insights into client-level performance.
Charts Included in Client Analysis
The page includes:
- Total Cases by Client Name
- Total Estimated Hours by Client
- Total Estimated Cost by Client
- Average Client Satisfaction Score by Client
Click to Buy Legal Dashboard in Google Sheets
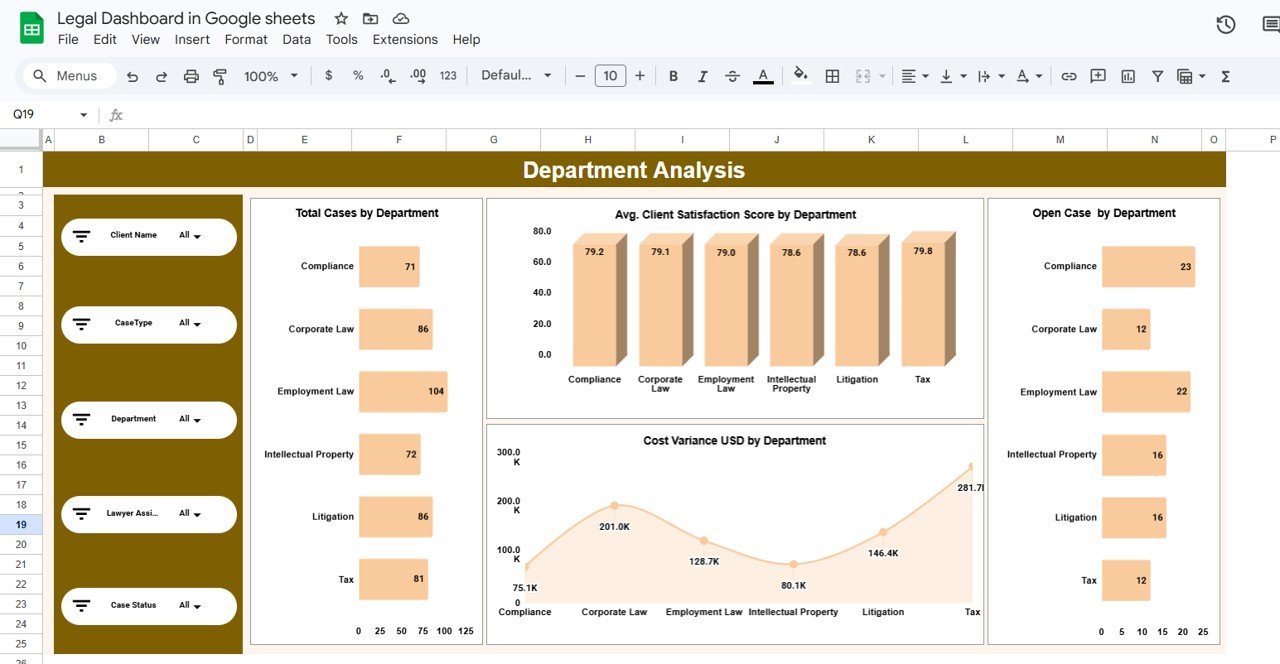
Department Analysis: How Can You Evaluate Department Performance?
Legal organizations often divide work into specialized departments such as:
- Corporate Law
- Litigation
- Tax Law
- Compliance
- Intellectual Property
- Employment Law
The Department Analysis Page focuses on department-level performance monitoring.
Charts Included in Department Analysis
The dashboard includes:
- Total Cases by Department
- Average Client Satisfaction Score by Department
- Open Cases by Department
- Cost Variance USD by Department
Insights from Department Analysis
Managers can easily:
- Identify overloaded departments
- Monitor department productivity
- Track cost variance in legal services
- Improve resource allocation
Consequently, organizations can balance workloads more efficiently.
Click to Buy Legal Dashboard in Google Sheets
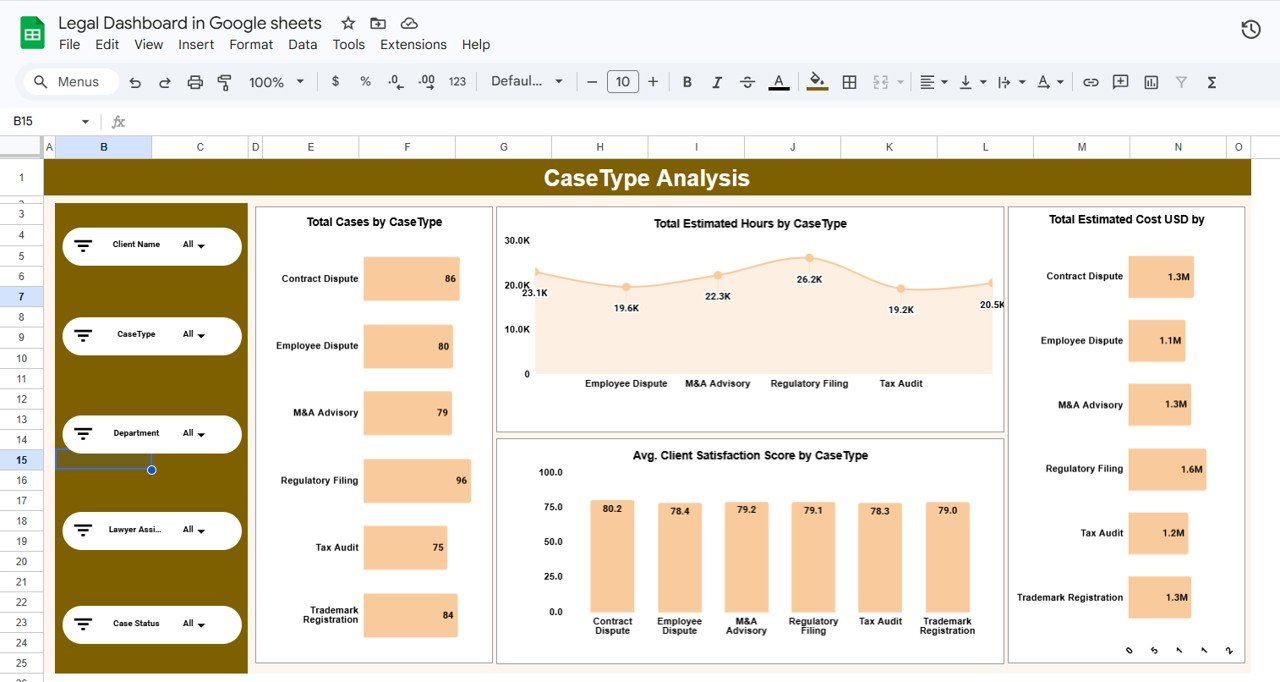
Case Type Analysis: Which Legal Services Generate the Most Work?
Different legal cases require different levels of effort and expertise.
The Case Type Analysis Page helps firms understand which legal services require the most resources.
Charts Included in Case Type Analysis
This page includes:
- Total Cases by Case Type
- Total Estimated Hours by Case Type
- Average Client Satisfaction Score by Case Type
- Total Estimated Cost by Case Type
Insights from Case Type Analysis
Managers can:
- Identify the most demanding case types
- Monitor legal service profitability
- Evaluate lawyer specialization needs
- Optimize legal service offerings
Therefore, firms can allocate resources more effectively.
Click to Buy Legal Dashboard in Google Sheets
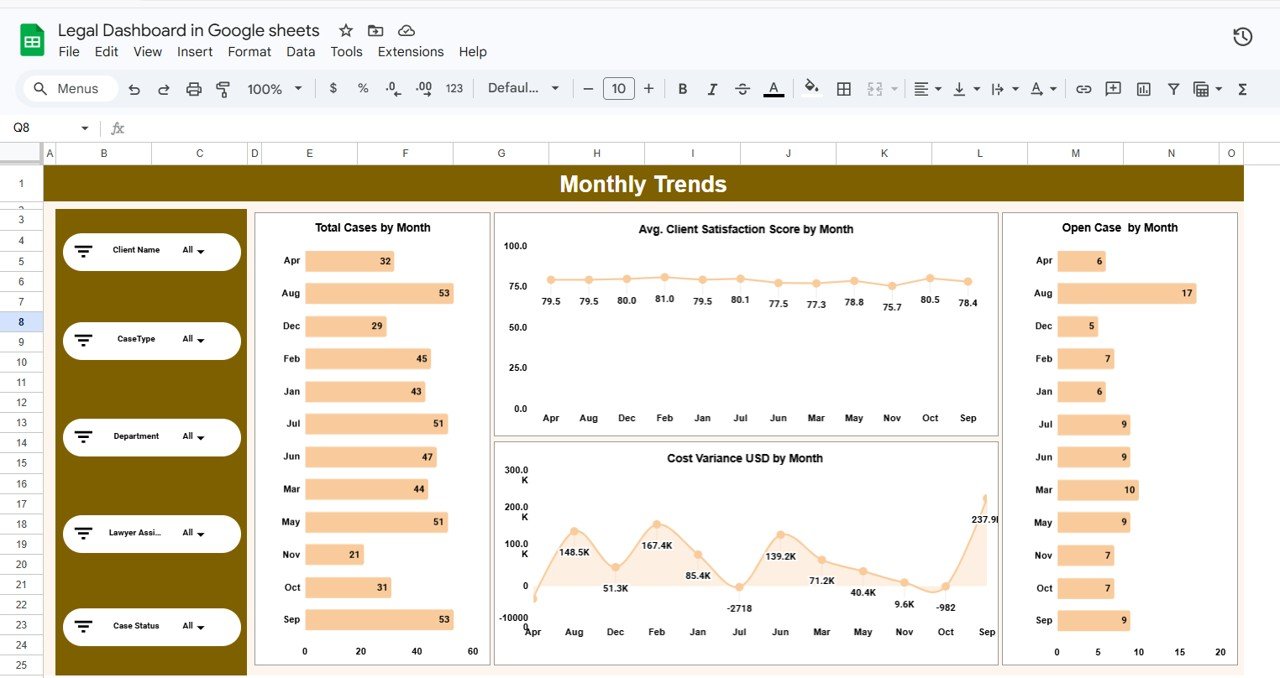
Monthly Trends: How Do Legal Operations Change Over Time?
Legal operations fluctuate throughout the year due to regulatory cycles, business transactions, and litigation patterns.
The Monthly Trends Page helps track time-based performance changes.
Charts Included in Monthly Trends
The dashboard displays:
- Total Cases by Month
- Average Client Satisfaction Score by Month
- Open Cases by Month
- Cost Variance USD by Month
Insights from Monthly Analysis
Managers can:
- Identify seasonal legal workload patterns
- Monitor monthly client satisfaction trends
- Track fluctuations in legal costs
- Plan staffing requirements
Thus, organizations can improve long-term legal planning.
Click to Buy Legal Dashboard in Google Sheets
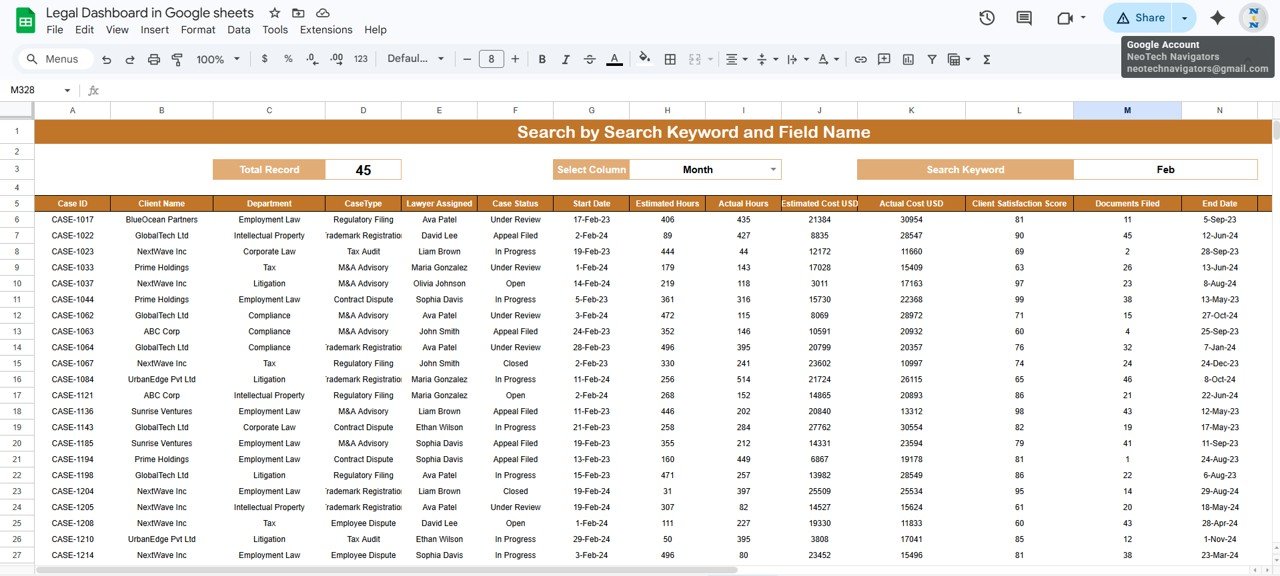
Search Feature: How Can Users Quickly Find Case Information?
The dashboard also includes an advanced Search Feature.
Users can search records based on:
- Case ID
- Client Name
- Department
- Case Type
- Lawyer Assigned
- Case Status
- Month
This functionality allows users to locate case information quickly without manually scanning the dataset.
Click to Buy Legal Dashboard in Google Sheets
Data Sheet and Support Sheet
The dashboard uses structured worksheets to manage data and calculations.
Data Sheet
The Data Sheet contains the raw legal case records used in the dashboard.
Typical columns include:
- Case ID
- Client Name
- Department
- Case Type
- Lawyer Assigned
- Case Status
- Start Date
- Estimated Hours
- Actual Hours
- Estimated Cost
- Actual Cost
- Client Satisfaction Score
- Documents Filed
- End Date
Because the dataset is structured, pivot tables can easily generate charts and reports.
Advantages of the Legal Dashboard in Google Sheets
Organizations gain several benefits from implementing this dashboard.
Improved Case Monitoring
-
Managers can track all legal cases in one place.
-
Teams can monitor case progress easily.
Better Financial Visibility
-
Firms can track estimated and actual legal costs.
-
Managers can control legal expenses effectively.
Enhanced Client Management
-
Firms can monitor client satisfaction scores.
-
Managers can improve service quality.
Increased Productivity
-
Lawyers can track workload distribution.
-
Managers can allocate resources efficiently.
Cloud-Based Collaboration
-
Google Sheets allows real-time collaboration.
-
Teams can update case data from anywhere.
Opportunities for Improvement in Legal Analytics
Click to Buy Legal Dashboard in Google Sheets
Although the dashboard provides strong insights, organizations can enhance their legal analytics further.
Integrate Case Management Systems
Connect the dashboard with legal case management software.
Add Automation
Automate data updates using integrations or scripts.
Monitor Legal Compliance
Add compliance-related KPIs for regulatory monitoring.
Introduce Predictive Analytics
Use historical data to forecast legal workload and costs.
These improvements can significantly strengthen legal decision-making.
Best Practices for the Legal Dashboard in Google Sheets
Organizations should follow several best practices to maintain an effective legal dashboard.
Maintain Clean Data
-
Avoid duplicate records
-
Use consistent naming conventions
-
Validate data regularly
Update the Dashboard Regularly
-
Add new cases frequently
-
Update case status promptly
Focus on Key Metrics
Monitor important KPIs such as:
-
Total Cases
-
Open Cases
-
Legal Costs
-
Case Completion Time
-
Client Satisfaction Score
Keep Dashboard Design Simple
-
Avoid excessive charts
-
Highlight important metrics clearly
These practices ensure that the dashboard remains reliable and effective.
Conclusion
Click to Buy Legal Dashboard in Google Sheets
Legal operations require careful monitoring of cases, costs, and client satisfaction. Without structured analytics, managing legal performance becomes extremely challenging.
The Legal Dashboard in Google Sheets provides a powerful solution for tracking legal case progress, analyzing lawyer workload, monitoring legal expenses, and evaluating client satisfaction.
Because the dashboard transforms raw legal data into meaningful insights, managers can quickly identify operational issues and improve decision-making.
As law firms continue to manage increasing workloads and complex legal matters, implementing a data-driven legal analytics system becomes essential for long-term success.
Frequently Asked Questions (FAQs)
Click to Buy Legal Dashboard in Google Sheets
What is a Legal Dashboard?
A legal dashboard is a visual reporting system that tracks legal operations such as case progress, legal costs, lawyer workload, and client satisfaction.
Why should law firms use dashboards?
Dashboards help law firms monitor case performance, control legal costs, improve productivity, and make data-driven decisions.
Can Google Sheets handle legal dashboards effectively?
Yes. Google Sheets supports charts, pivot tables, formulas, and collaborative features, which makes it suitable for legal dashboards.
Visit our YouTube channel to learn step-by-step video tutorials
Youtube.com/@NeotechNavigators
Watch the step-by-step video tutorial: