Managing employee performance and workforce costs has become one of the most important responsibilities of modern HR teams. Organizations must continuously monitor employee productivity, salary distribution, bonuses, department performance, and regional workforce trends. However, many companies still rely on scattered spreadsheets and static reports, which makes HR analytics slow and inefficient.HR Employee Performance Analytics Dashboard in Google Sheets
Therefore, businesses need a centralized analytics solution that transforms employee data into clear insights.HR Employee Performance Analytics Dashboard in Google Sheets
This is exactly where the HR Employee Performance Analytics Dashboard in Google Sheets becomes extremely valuable.
The HR Employee Performance Analytics Dashboard in Google Sheets is a ready-to-use workforce analytics solution designed to help HR professionals track employee performance, analyze workforce costs, monitor department productivity, and evaluate employee distribution across regions.
Because Google Sheets provides powerful data visualization, real-time collaboration, and automated calculations, organizations can easily convert complex HR data into interactive dashboards.
In this comprehensive guide, we will explore the HR Employee Performance Analytics Dashboard in Google Sheets, including its features, dashboard pages, advantages, best practices, and how HR teams can use it to improve workforce management.
What is an HR Employee Performance Analytics Dashboard in Google Sheets?
Click to Buy HR Employee Performance Analytics Dashboard in Google Sheets
An HR Employee Performance Analytics Dashboard in Google Sheets is an interactive reporting tool used to analyze workforce data and employee performance metrics.
Instead of reviewing multiple HR reports manually, HR managers can analyze employee data using visual charts and KPI indicators.
The dashboard typically tracks metrics such as:
-
Total employees
- Salary cost
- Bonus distribution
- Employee performance ratings
- Department productivity
- Regional workforce distribution
- Employee nationality analysis
- Monthly workforce trends
Because the dashboard presents this data visually, HR teams can easily identify trends, workforce patterns, and performance insights.
As a result, organizations can make faster and smarter HR decisions.
Why Do Organizations Need an HR Performance Analytics Dashboard?
Modern organizations generate large volumes of HR data. HR departments must analyze salary costs, workforce performance, regional employee distribution, and departmental productivity.
However, manual HR reporting creates several challenges.
Common HR Reporting Challenges
- Disconnected HR data across multiple files
- Difficulty analyzing workforce costs
- Time-consuming manual HR reports
- Lack of visibility into department productivity
- Difficulty analyzing regional workforce distribution
- Limited insights into employee compensation trends
Therefore, organizations require a powerful analytics system that converts HR data into actionable insights.
The HR Employee Performance Analytics Dashboard in Google Sheets solves these problems by offering a structured and interactive HR reporting solution.
Key Features of the HR Employee Performance Analytics Dashboard
Click to Buy HR Employee Performance Analytics Dashboard in Google Sheets
The dashboard includes several advanced features that make HR data analysis easier.
1. Interactive HR Filters
The dashboard includes multiple filters that allow users to explore HR data instantly.
Examples include:
- Gender
- Country
- Region
- City
- Ethnicity
- Job Level
- Department
- Employee Name
These filters allow HR managers to perform deeper workforce analysis.
2. HR KPI Cards
The dashboard displays important HR metrics using KPI cards such as:
- Total Employees
- Total Cost (USD)
- Total Salary (USD)
- Total Bonus (USD)
- Average Performance Rating
These KPIs help HR leaders quickly evaluate workforce performance and compensation costs.
3. Visual HR Charts
The dashboard includes several charts to analyze workforce performance and HR metrics.
These charts help HR teams identify trends quickly and make data-driven decisions.
Dashboard Pages in the HR Employee Performance Analytics Dashboard
Click to Buy HR Employee Performance Analytics Dashboard in Google Sheets
The dashboard contains multiple analytical pages designed to analyze HR data from different perspectives.
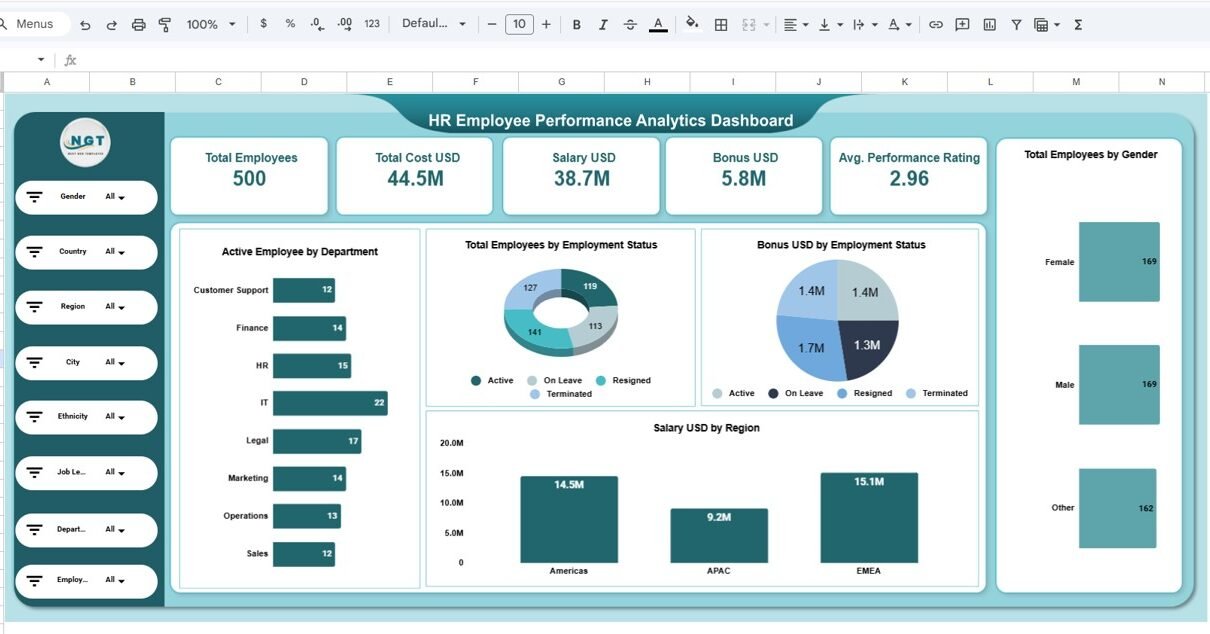
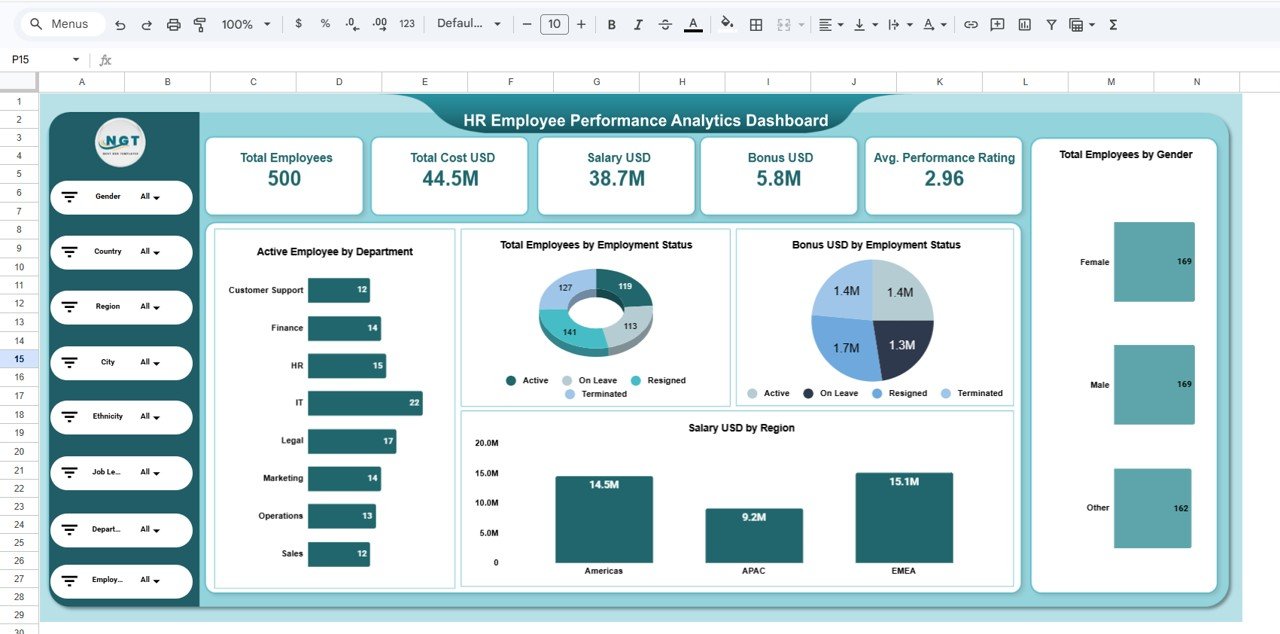
1. HR Overview Dashboard
The Overview Dashboard provides a summary of overall HR performance.
It shows important workforce metrics and employee distribution insights.
KPI Metrics Included
- Total Employees: 500
- Total Cost: 44.5M USD
- Total Salary: 38.7M USD
- Total Bonus: 5.8M USD
- Average Performance Rating: 2.96
Charts in the Overview Page
- Active Employee by Department
- Employee Status Distribution
- Bonus Distribution by Employment Status
- Salary by Region
- Employee Distribution by Gender
This page helps HR leaders quickly understand the workforce structure.
Click to Buy HR Employee Performance Analytics Dashboard in Google Sheets
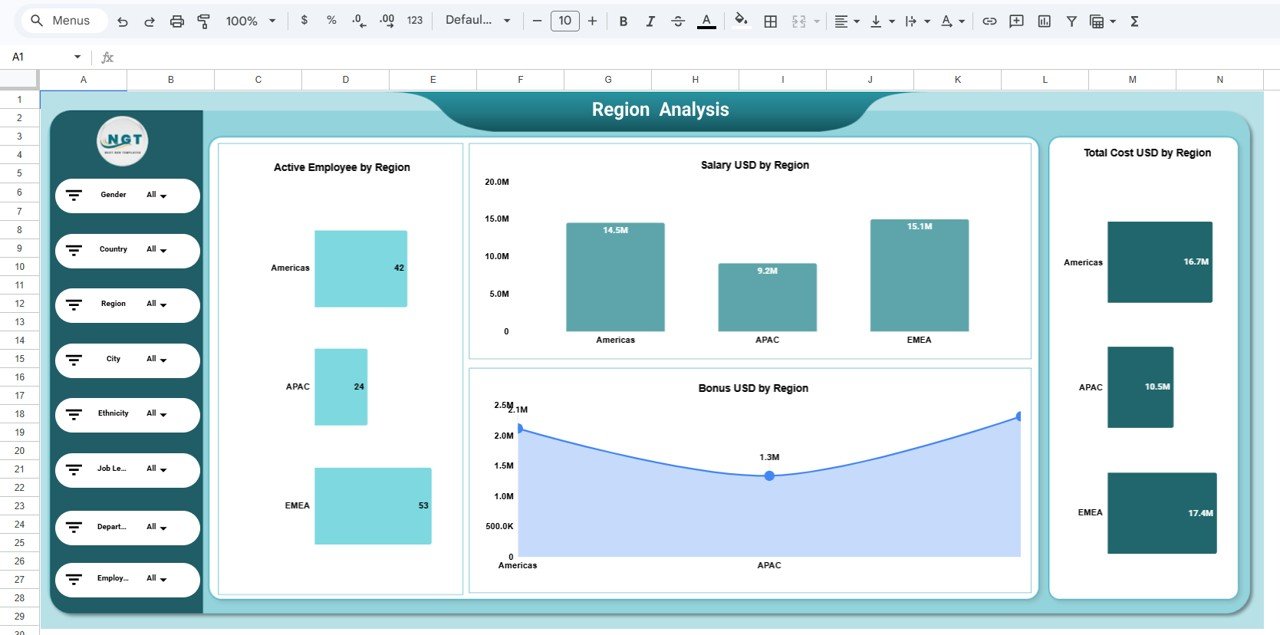
2. Region Analysis Dashboard
The Region Analysis Dashboard evaluates workforce performance across different regions.
Organizations often operate across multiple global regions, such as:
- Americas
- APAC
- EMEA
Therefore, HR teams must track regional employee distribution and costs.
Charts in the Region Analysis Page
- Active Employee by Region
- Salary Distribution by Region
- Bonus Distribution by Region
- Total HR Cost by Region
This analysis allows HR managers to identify regions with high workforce costs and salary expenses.
Click to Buy HR Employee Performance Analytics Dashboard in Google Sheets
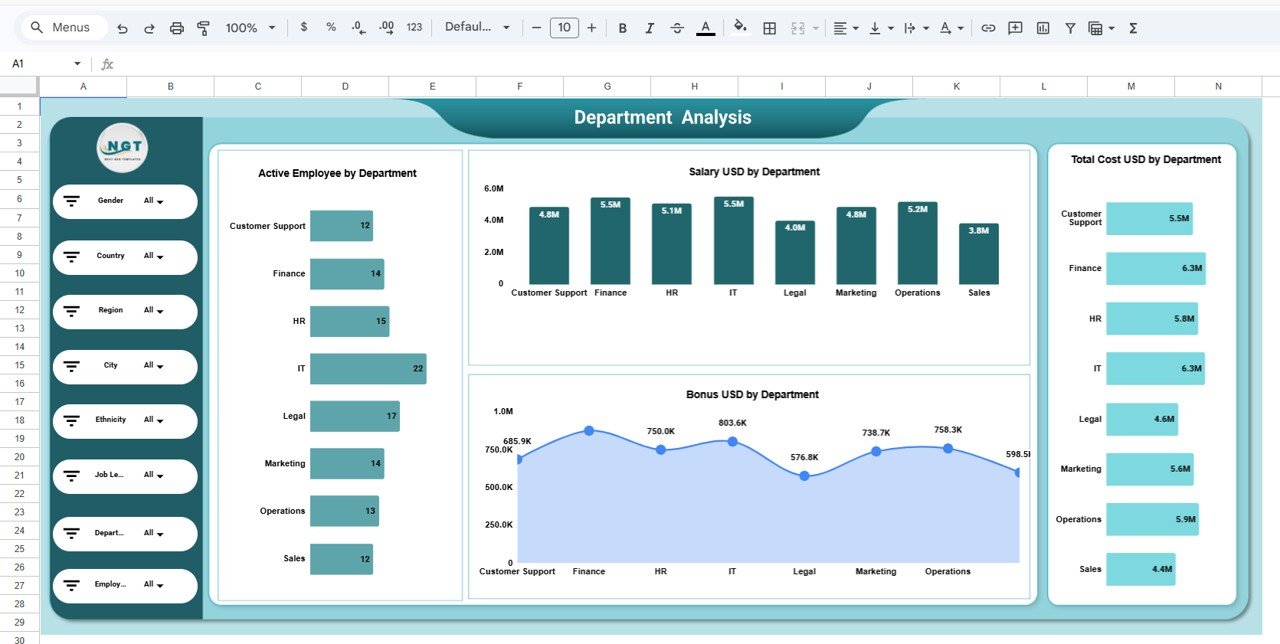
3. Department Analysis Dashboard
Departments form the foundation of organizational productivity. HR teams must analyze department-level workforce costs and employee distribution.
The Department Analysis Page provides detailed insights into department performance.
Charts Included
- Active Employees by Department
- Salary Cost by Department
- Bonus Distribution by Department
- Total HR Cost by Department
Departments analyzed include:
- Customer Support
- Finance
- HR
- IT
- Legal
- Marketing
- Operations
- Sales
This page helps HR teams identify departments with high salary costs and evaluate workforce distribution.
Click to Buy HR Employee Performance Analytics Dashboard in Google Sheets
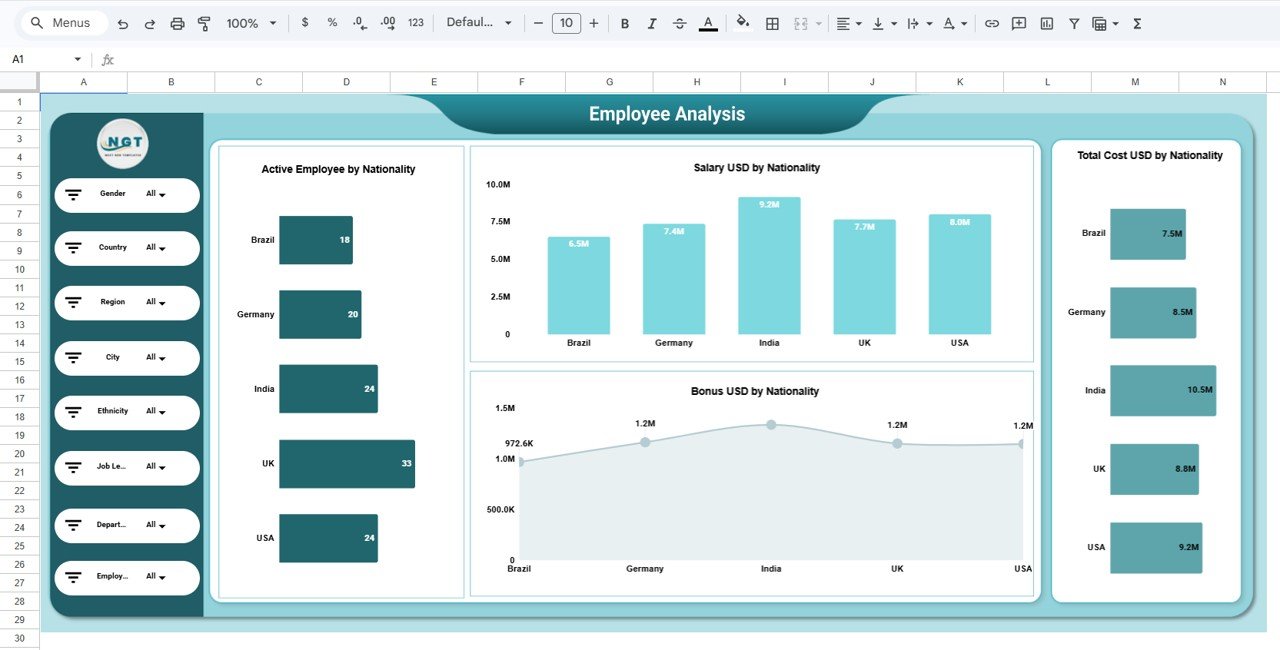
4. Employee Analysis Dashboard
The Employee Analysis Dashboard focuses on workforce nationality and employee distribution.
Organizations with global teams often manage employees from multiple countries.
Charts Included
- Active Employee by Nationality
- Salary Distribution by Nationality
- Bonus Distribution by Nationality
- Total HR Cost by Nationality
Example nationalities analyzed include:
- Brazil
- Germany
- India
- UK
- USA
This analysis helps HR leaders understand workforce diversity and compensation trends.
Click to Buy HR Employee Performance Analytics Dashboard in Google Sheets
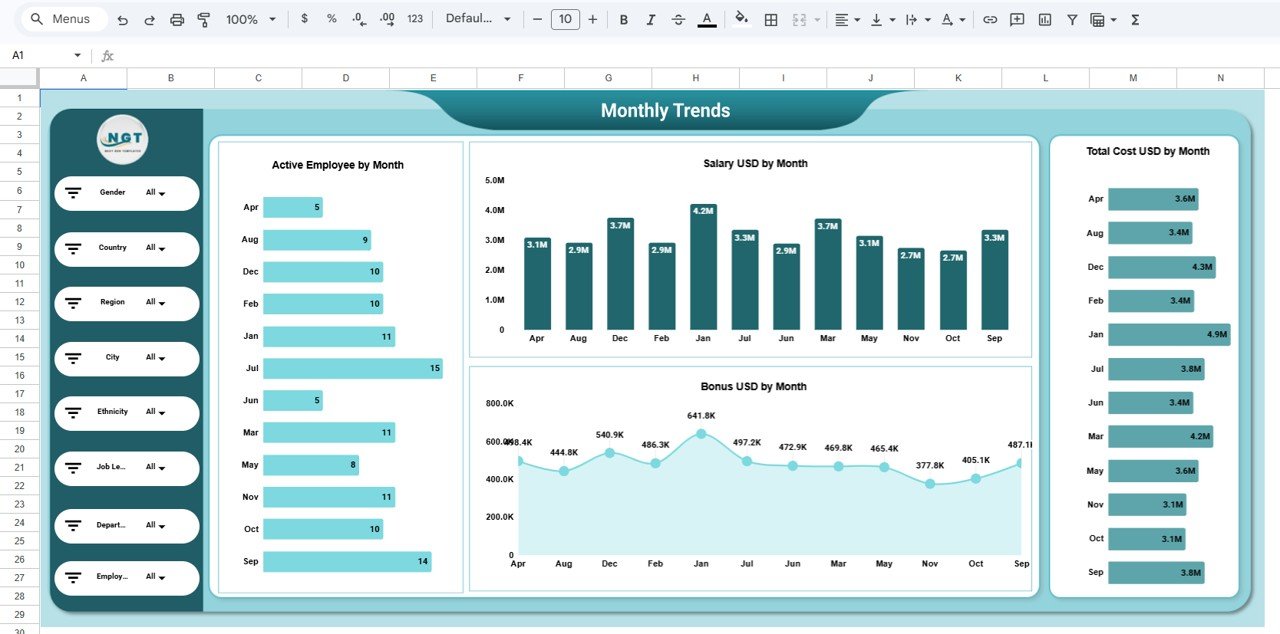
5. Monthly Trends Dashboard
The Monthly Trends Page analyzes HR metrics over time.
Workforce costs and hiring activity often change throughout the year.
Charts Included
- Active Employee by Month
- Salary Distribution by Month
- Bonus Distribution by Month
- Total HR Cost by Month
This analysis allows HR teams to identify seasonal trends in workforce management.
Click to Buy HR Employee Performance Analytics Dashboard in Google Sheets
Advantages of HR Employee Performance Analytics Dashboard
Organizations gain several benefits from using this HR dashboard.
1. Centralized HR Reporting
The dashboard combines multiple HR metrics into a single analytics platform.
2. Faster Workforce Analysis
HR managers can instantly identify performance trends using visual charts.
3. Improved Workforce Planning
Organizations can analyze employee distribution across departments and regions.
4. Better Cost Management
The dashboard helps HR teams track salary and bonus expenses.
5. Data-Driven HR Decisions
Visual analytics help organizations make smarter HR strategies.
6. Improved Workforce Transparency
Managers can easily monitor workforce performance and employee metrics.
Best Practices for HR Employee Performance Analytics Dashboard
Click to Buy HR Employee Performance Analytics Dashboard in Google Sheets
To maximize the benefits of the dashboard, HR teams should follow several best practices.
Maintain Accurate Employee Data
Ensure that HR data remains clean, accurate, and consistent.
Update Workforce Data Regularly
Regular updates ensure that HR insights remain current and reliable.
Track Key HR Metrics
Focus on important metrics such as:
-
Salary expenses
-
Bonus distribution
-
Workforce size
-
Employee performance ratings
Use Filters for Deeper Insights
Apply filters to analyze specific regions, departments, or employee categories.
Monitor Workforce Trends
Analyze monthly workforce trends to identify hiring patterns or cost changes.
Conclusion
Click to Buy HR Employee Performance Analytics Dashboard in Google Sheets
Workforce management requires accurate insights into employee performance, compensation, and distribution across departments and regions.
However, manual HR reporting often limits the ability to analyze large volumes of workforce data.
The HR Employee Performance Analytics Dashboard in Google Sheets provides a powerful solution for modern HR teams.
By combining KPI monitoring, interactive charts, and advanced HR analytics, this dashboard helps organizations understand workforce performance and cost structures more effectively.
As a result, HR teams can improve decision-making, optimize workforce planning, and enhance organizational productivity.
In today’s data-driven workplace, the HR Employee Performance Analytics Dashboard in Google Sheets becomes an essential tool for HR analytics and workforce management.
Visit our YouTube channel to learn step-by-step video tutorials
Youtube.com/@NeotechNavigators
Watch the step-by-step video tutorial:
Click to Buy HR Employee Performance Analytics Dashboard in Google Sheets