Infrastructure projects require careful monitoring and structured performance measurement. Organizations responsible for infrastructure development—such as construction companies, utilities, transportation authorities, and government agencies—must track key performance indicators to ensure projects remain efficient, profitable, and on schedule.
However, many organizations still rely on multiple spreadsheets and manual reports to track infrastructure performance. As a result, managers often struggle to identify delays, analyze operational efficiency, and monitor project outcomes effectively.
Therefore, companies increasingly adopt KPI scorecards to track performance indicators in a structured and visual way.
This is where the Infrastructure KPI Scorecard in Google Sheets becomes extremely useful.
The Infrastructure KPI Scorecard in Google Sheets is a ready-to-use template designed to help organizations track infrastructure performance using key metrics. Moreover, this scorecard provides visual indicators, automated calculations, and trend analysis to simplify performance monitoring.
Because Google Sheets allows real-time collaboration and cloud access, teams can update and review infrastructure KPIs easily from anywhere.
In this comprehensive guide, we will explore the Infrastructure KPI Scorecard in Google Sheets, including its features, structure, KPI framework, advantages, best practices, and frequently asked questions.
What is an Infrastructure KPI Scorecard in Google Sheets?
Click to Buy Infrastructure KPI Scorecard in Google Sheets
An Infrastructure KPI Scorecard in Google Sheets is a performance monitoring tool used to evaluate the efficiency, progress, and outcomes of infrastructure projects.
Instead of analyzing scattered reports, managers can view key performance indicators in a single scorecard.
The scorecard helps organizations monitor metrics such as:
- Project completion rates
- Infrastructure maintenance performance
- Cost efficiency
- Safety performance
- Resource utilization
- Service reliability
Because the scorecard automatically updates KPI results based on selected months, managers can easily track performance trends.
Why Do Infrastructure Organizations Need KPI Scorecards?
Infrastructure projects often involve large budgets, complex timelines, and multiple stakeholders.
Without a structured monitoring system, organizations may face several problems.
For example:
- Difficulty monitoring project performance
- Limited visibility into operational efficiency
- Delays in identifying cost overruns
- Poor tracking of maintenance performance
Therefore, infrastructure teams use KPI scorecards to transform raw data into actionable insights.
A KPI scorecard helps leaders understand performance trends quickly and make better decisions.
Key Features of the Infrastructure KPI Scorecard in Google Sheets
Click to Buy Infrastructure KPI Scorecard in Google Sheets
The Infrastructure KPI Scorecard provides a simple yet powerful way to monitor infrastructure KPIs.
Major features include:
- Ready-to-use Google Sheets template
- Tracking of 10 different infrastructure KPIs
- Interactive month selection dropdown
- Automatic update of scorecard numbers
- Traffic light performance indicators
- Up and down arrow indicators for KPI changes
- MTD and YTD performance analysis
- Trend analysis for KPI performance
Because of these features, organizations can easily analyze infrastructure performance.
How Does the Infrastructure KPI Scorecard Work?
The scorecard uses a simple structure that combines data input sheets and automated KPI calculations.
Users can select a month from the dropdown at the top of the dashboard. Once selected, the entire scorecard updates automatically.
The scorecard also includes options to view:
-
MTD (Month-to-Date) performance
-
YTD (Year-to-Date) performance
Traffic light indicators provide quick performance insights:
-
🟢 Green – KPI performing well
-
🟡 Yellow – KPI requires attention
-
🔴 Red – KPI performing below target
These visual indicators allow managers to identify performance issues instantly.
Structure of the Infrastructure KPI Scorecard
Click to Buy Infrastructure KPI Scorecard in Google Sheets
The Infrastructure KPI Scorecard in Google Sheets includes several structured worksheets.
These worksheets help organize KPI definitions, data input, and trend analysis.
Main sheets include:
- Scorecard Sheet
- Trend Sheet
- KPI Definition Sheet
- Data Input Sheet
- Colour Settings Sheet
Each sheet plays an important role in the KPI monitoring system.
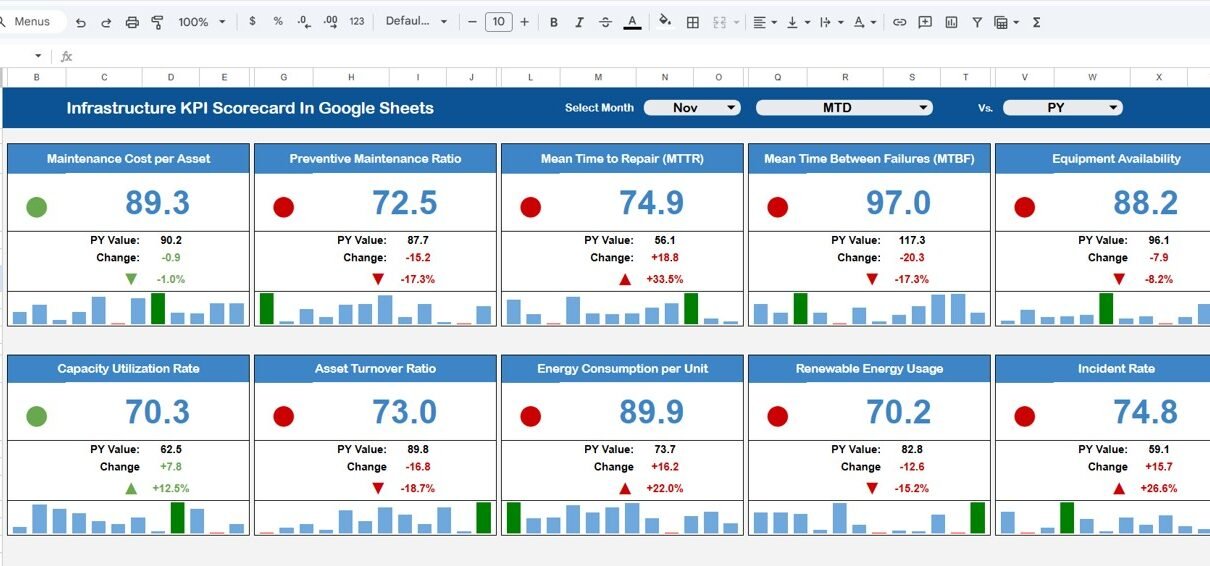
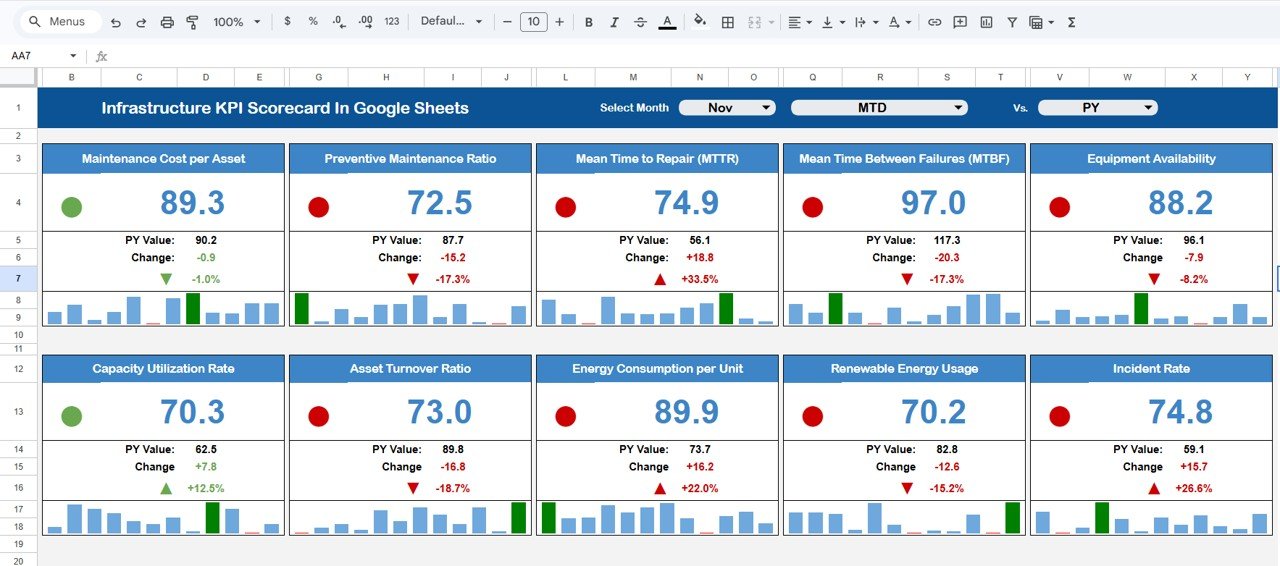
Scorecard Sheet – Main KPI Monitoring Interface
The Scorecard Sheet acts as the main dashboard.
At the top of the scorecard, users can select a month from the dropdown menu.
Once the month changes:
- All KPI values update automatically
- Traffic light indicators change
- Percentage change arrows update
This dynamic system allows users to analyze monthly infrastructure performance easily.
KPI Information Displayed on the Scorecard
Each KPI row includes several performance metrics.
These include:
- KPI Name
- KPI Group
- KPI Unit
- Actual Performance
- Target Value
- Percentage Change
- Performance Indicator
Additionally, users can switch between MTD and YTD views to analyze different performance periods.
Click to Buy Infrastructure KPI Scorecard in Google Sheets
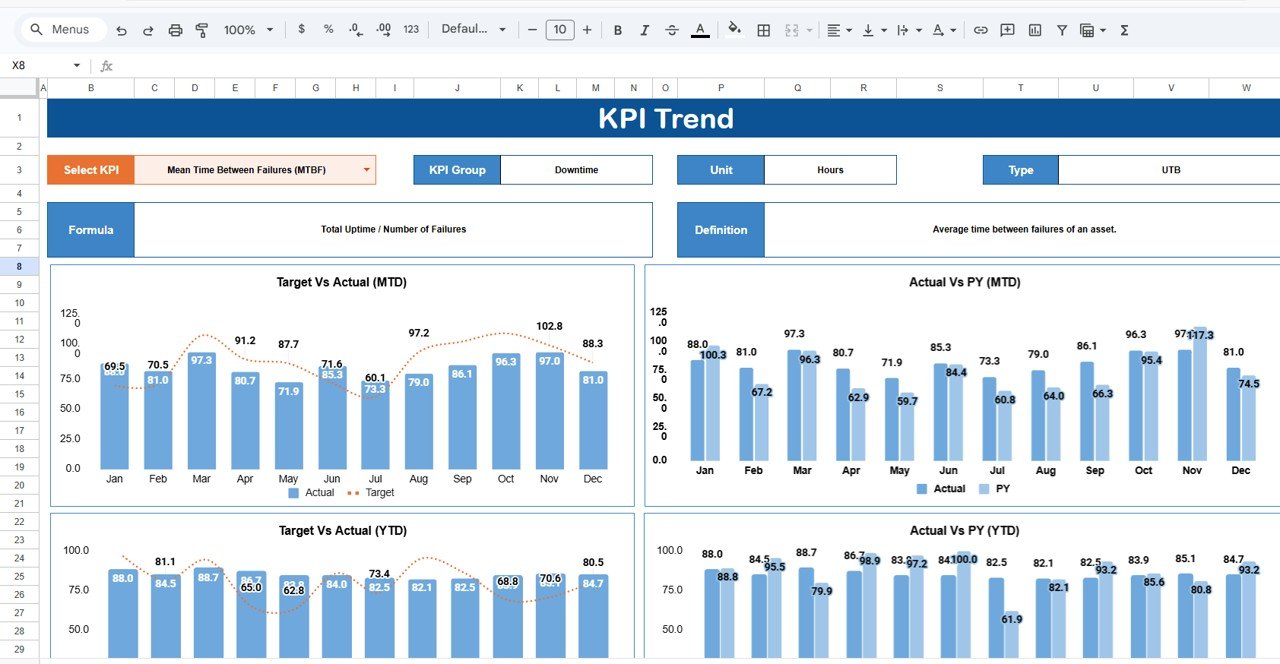
Trend Sheet – Monitor KPI Performance Over Time
The Trend Sheet helps users analyze KPI performance trends.
On cell C3, users can select a specific KPI from the dropdown list.
Once selected, the sheet displays the following information:
- KPI Group
- KPI Unit
- KPI Type (Lower the Better or Upper the Better)
- KPI Formula
- KPI Definition
The sheet also displays trend charts that show how the KPI performs over time.
Because of these charts, managers can easily identify patterns and performance fluctuations.
Click to Buy Infrastructure KPI Scorecard in Google Sheets
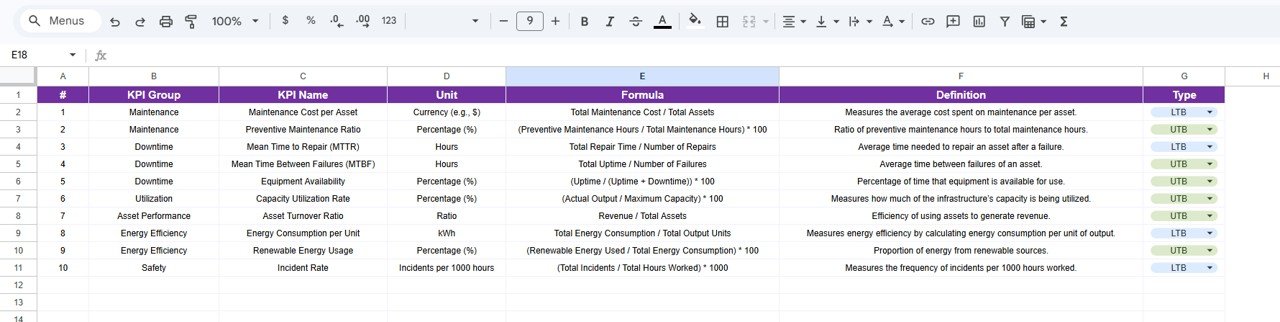
KPI Definition Sheet – Define the KPI Framework
The KPI Definition Sheet contains the detailed information about each KPI.
Users must enter the following details:
- KPI Name
- KPI Group
- Unit of Measurement
- KPI Formula
- KPI Definition
- KPI Type (Lower the Better or Upper the Better)
This sheet ensures that every KPI has a clear definition and calculation logic.
As a result, organizations can maintain consistent KPI reporting across teams.
Click to Buy Infrastructure KPI Scorecard in Google Sheets
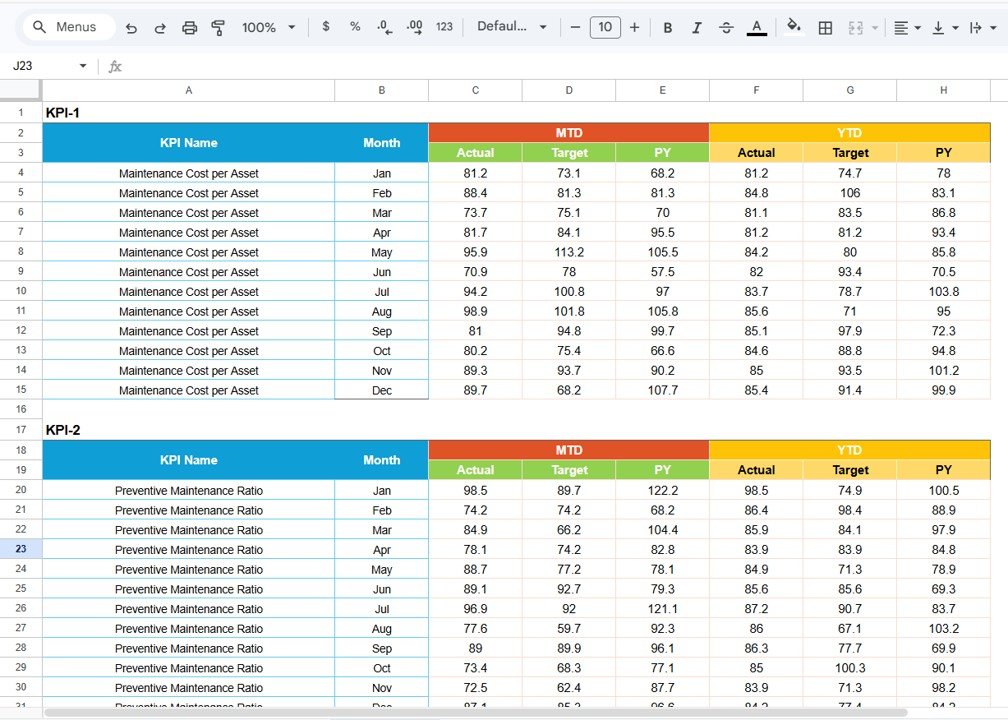
Data Input Sheet – Enter KPI Performance Data
The Data Input Sheet stores the raw KPI data used in the scorecard.
Users must input:
- Monthly KPI values
- Target values
- Actual performance numbers
Once the data is entered, the scorecard automatically calculates KPI results and updates visual indicators.
Click to Buy Infrastructure KPI Scorecard in Google Sheets
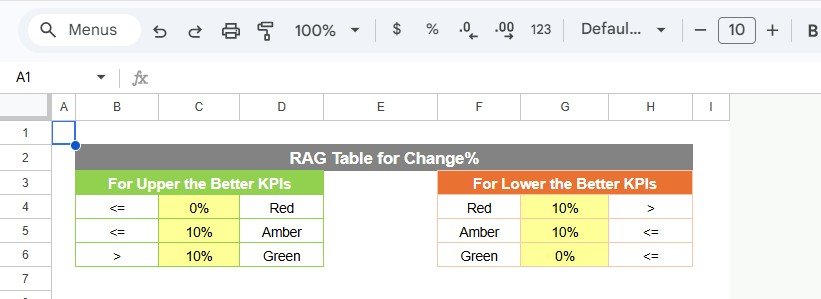
Colour Settings Sheet – Customize Performance Indicators
The Colour Settings Sheet controls the traffic light indicators used in the scorecard.
Organizations can customize performance thresholds to match their KPI strategy.
For example:
- Green for KPI values above target
- Yellow for moderate performance
- Red for KPI values below target
Because of this flexibility, organizations can adapt the scorecard to different performance frameworks.
Click to Buy Infrastructure KPI Scorecard in Google Sheets
Advantages of the Infrastructure KPI Scorecard in Google Sheets
Organizations gain several advantages by using KPI scorecards.
Centralized KPI Monitoring
Managers can track all infrastructure KPIs in one place.
Faster Performance Analysis
Visual indicators simplify KPI evaluation.
Better Decision-Making
Leaders can quickly identify performance issues.
Improved Accountability
Teams clearly understand their performance targets.
Cloud-Based Collaboration
Google Sheets allows teams to collaborate easily.
Best Practices for the Infrastructure KPI Scorecard
Click to Buy Infrastructure KPI Scorecard in Google Sheets
Organizations should follow these best practices when using KPI scorecards.
Define KPIs Clearly
Each KPI should include a clear formula and definition.
Update Data Regularly
Teams should update KPI values monthly.
Monitor KPI Trends
Trend analysis helps identify long-term performance patterns.
Align KPIs with Business Goals
Organizations should track KPIs that directly impact infrastructure performance.
Who Can Use the Infrastructure KPI Scorecard?
Many professionals can benefit from this scorecard.
Examples include:
- Infrastructure project managers
- Construction companies
- Government infrastructure departments
- Engineering firms
- Utilities companies
- Transportation authorities
Any organization managing infrastructure projects can use this scorecard.
Conclusion
Click to Buy Infrastructure KPI Scorecard in Google Sheets
The Infrastructure KPI Scorecard in Google Sheets provides a structured and effective solution for monitoring infrastructure performance.
Instead of relying on scattered spreadsheets, organizations can track key performance indicators through an interactive scorecard.
Moreover, the template simplifies KPI analysis through automated calculations, visual indicators, and trend analysis.
Because it operates in Google Sheets, teams can easily update data and collaborate in real time.
Therefore, organizations that implement infrastructure KPI scorecards gain better visibility into project performance, improve operational efficiency, and support data-driven decision-making.
Visit our YouTube channel to learn step-by-step video tutorials
Youtube.com/@NeotechNavigators
Watch the step-by-step video tutorial: