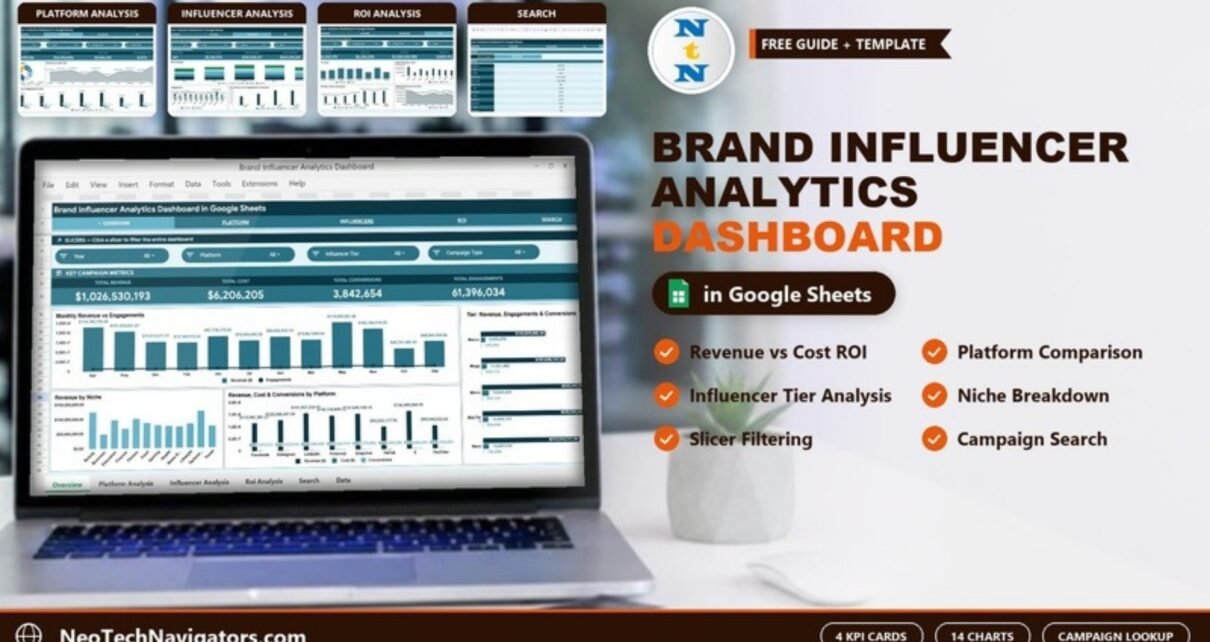
Influencer marketing budgets keep climbing, yet most brand teams still track creator campaigns in scattered tabs with no single view of return. The Brand Influencer Analytics Dashboard in Google Sheets fixes that with four analysis pages (Overview, Platform, Influencers and ROI), each with four KPI cards and four slicers, plus 14 pre-built charts, a campaign Search sheet and one Data sheet. It is a one-time purchase that runs entirely in your browser.
If you run creator campaigns across Facebook, Instagram, LinkedIn, Pinterest, Snapchat, TikTok, X and YouTube, you already know the pain: revenue, cost, reach and engagement live in different places, and proving ROI to a client or founder means rebuilding the same report every month. This dashboard turns one flat Data sheet into a connected reporting system that updates the moment you add a campaign row.
🎥 Watch the Video Tutorial
Get the Brand Influencer Analytics Dashboard
Key Features of the Brand Influencer Analytics Dashboard in Google Sheets
The Overview page leads with four headline KPIs (Total Revenue, Total Cost, Total Conversions and Total Engagements), and the Platform, Influencers and ROI pages each add their own four KPI cards. Fourteen charts break the numbers down by platform, niche, influencer tier, content type, campaign type and month. Every visual recalculates automatically when you edit the Data sheet, so there is no manual chart maintenance.
- 16 KPI cards, four on each analysis page, give a live top-line read on every creator program.
- 14 pre-built charts cover revenue, cost, reach, impressions, engagements, clicks and conversions.
- Native Google Sheets slicers on every analysis page; on the Overview they filter by Year, Platform, Influencer Tier and Campaign Type.
- Campaign Search sheet returns a single campaign’s full record from a dropdown, with no scrolling through the raw data.
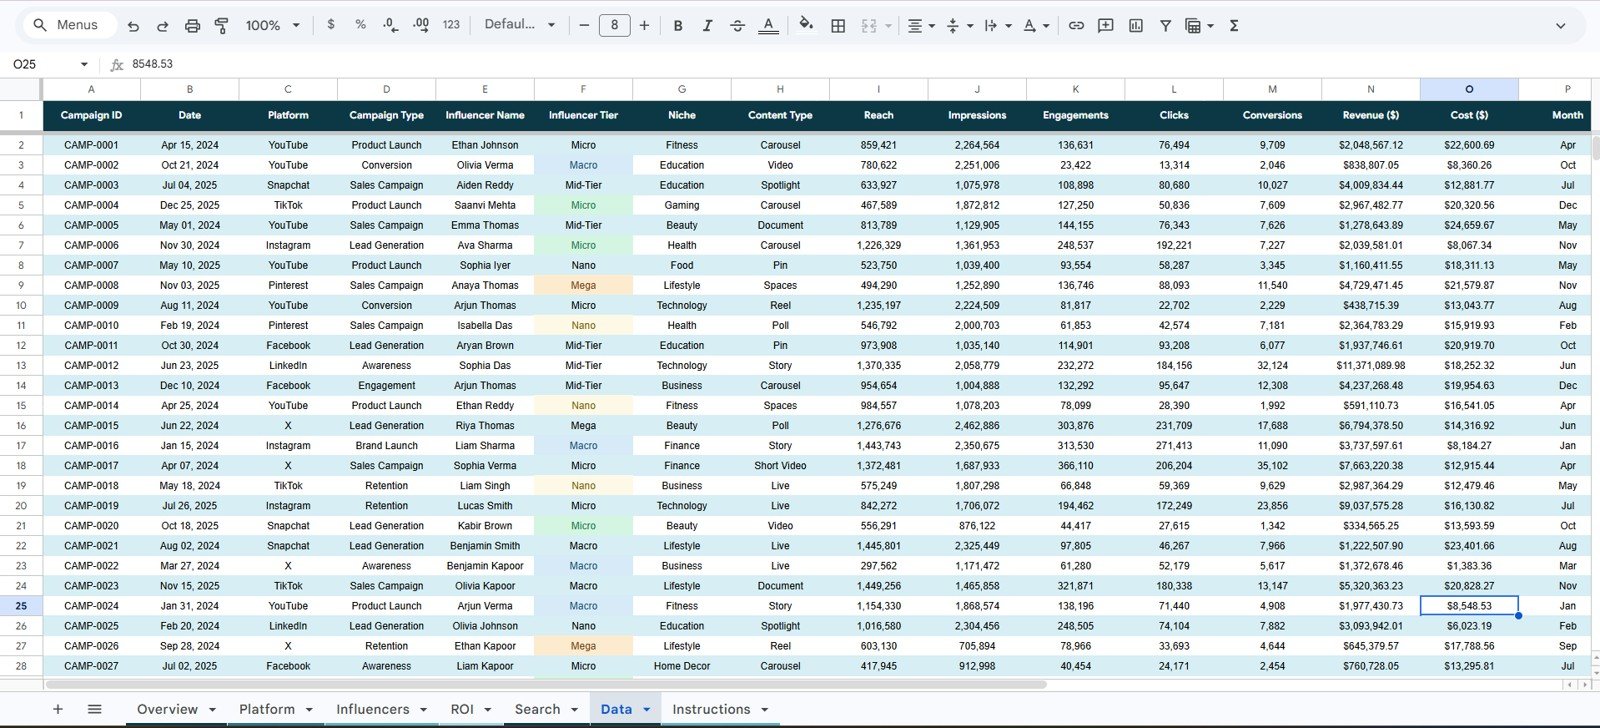
- Structured Data sheet is the single input table; add rows in the same format and everything scales.
Dashboard Pages Explanation
The workbook tabs are Overview, Platform, Influencers, ROI, Search and Data, plus an Instructions tab. Here is what each one does.
Page 1: Overview
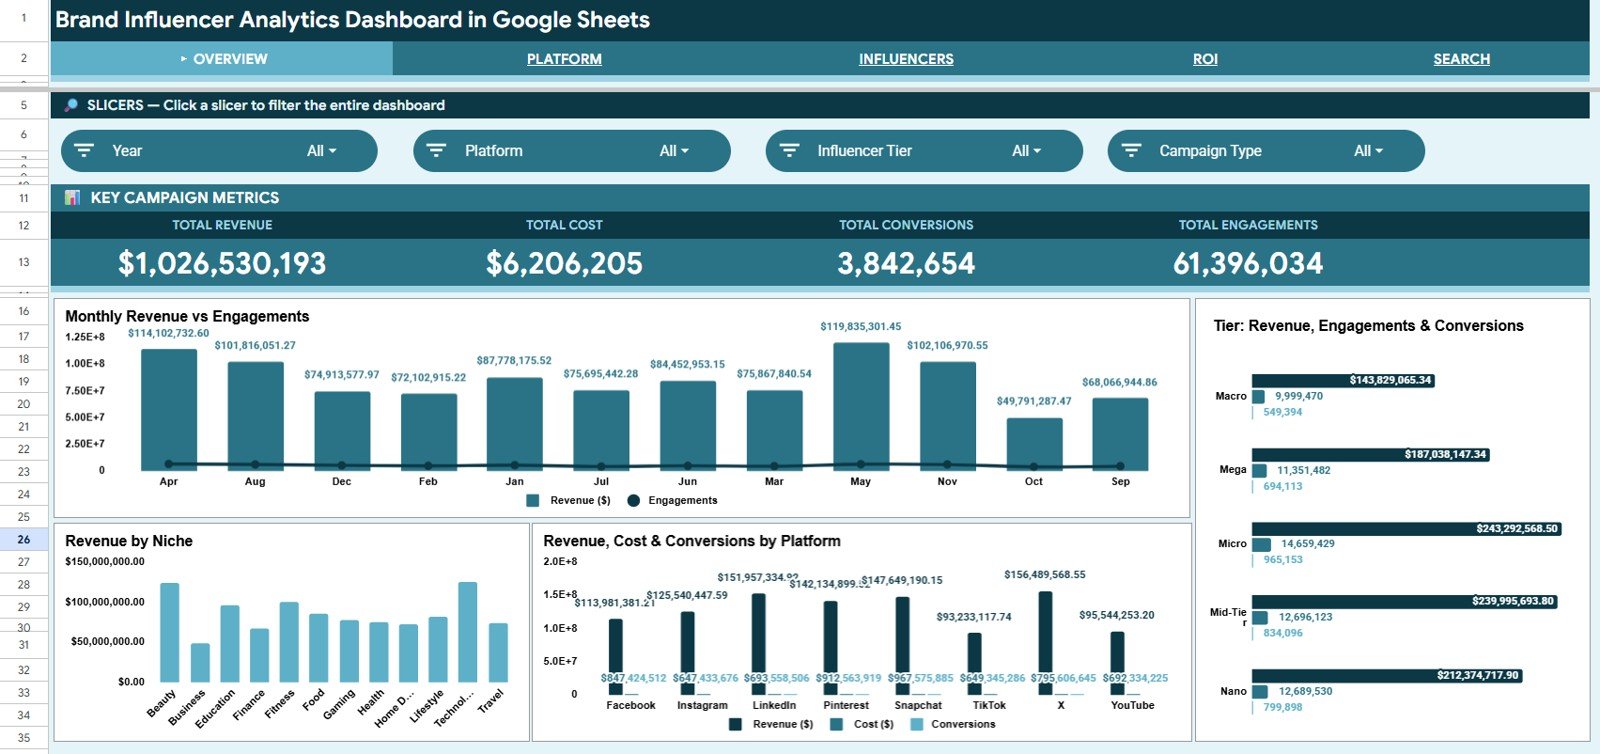
Slicers: Year, Platform, Influencer Tier and Campaign Type. Key Campaign Metrics cards: Total Revenue, Total Cost, Total Conversions and Total Engagements. Charts: Monthly Revenue vs Engagements, Revenue by Niche, Revenue, Cost & Conversions by Platform and Tier: Revenue, Engagements & Conversions, a complete top-line snapshot on one screen.
Page 2: Platform
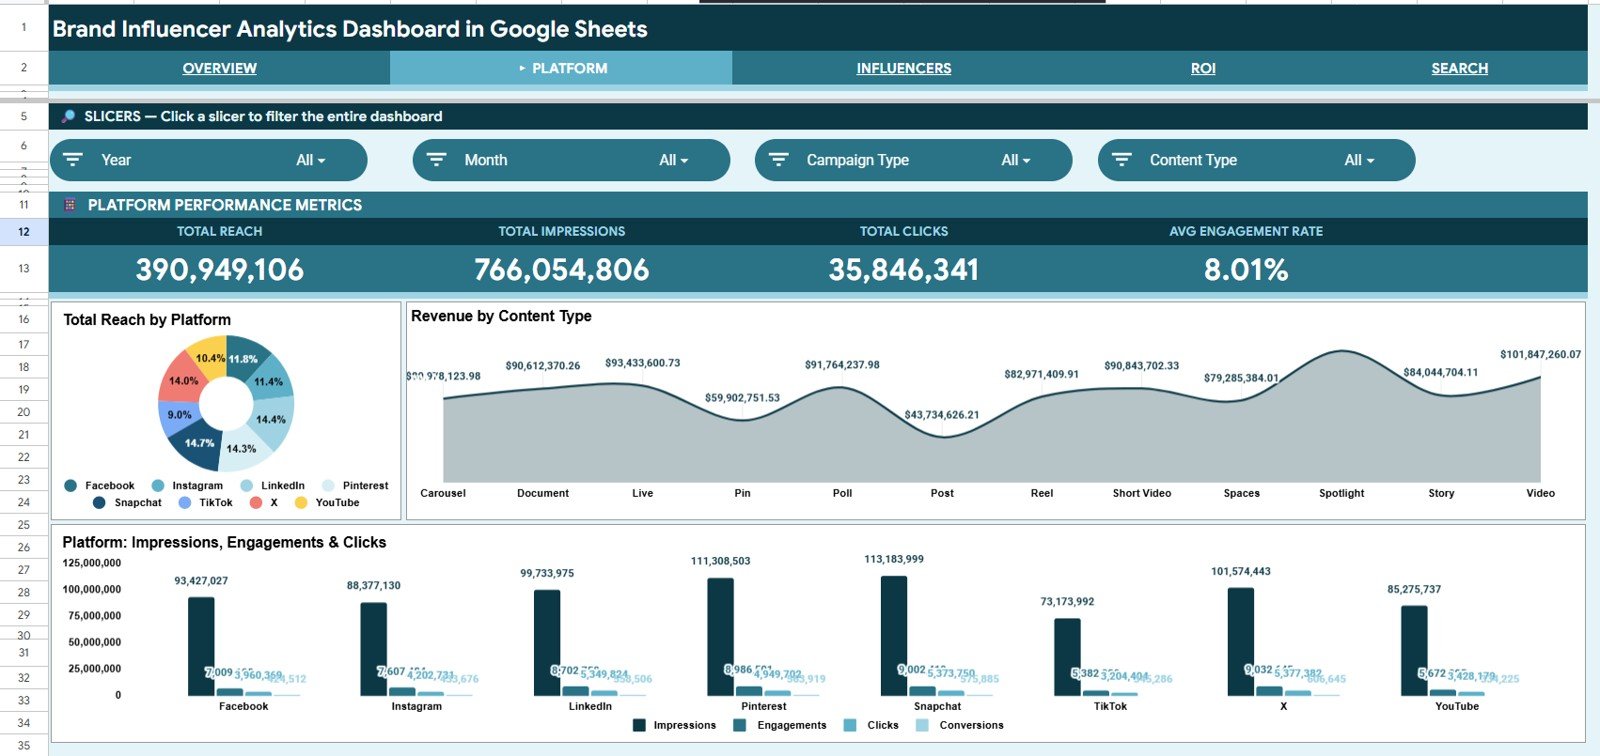
Slicers: Year, Month, Campaign Type and Content Type. Platform Performance Metrics cards: Total Reach, Total Impressions, Total Clicks and Avg Engagement Rate. Charts: Total Reach by Platform, Revenue by Content Type and Platform: Impressions, Engagements & Clicks, so you can see which platforms drive raw reach versus paid return.
Page 3: Influencers
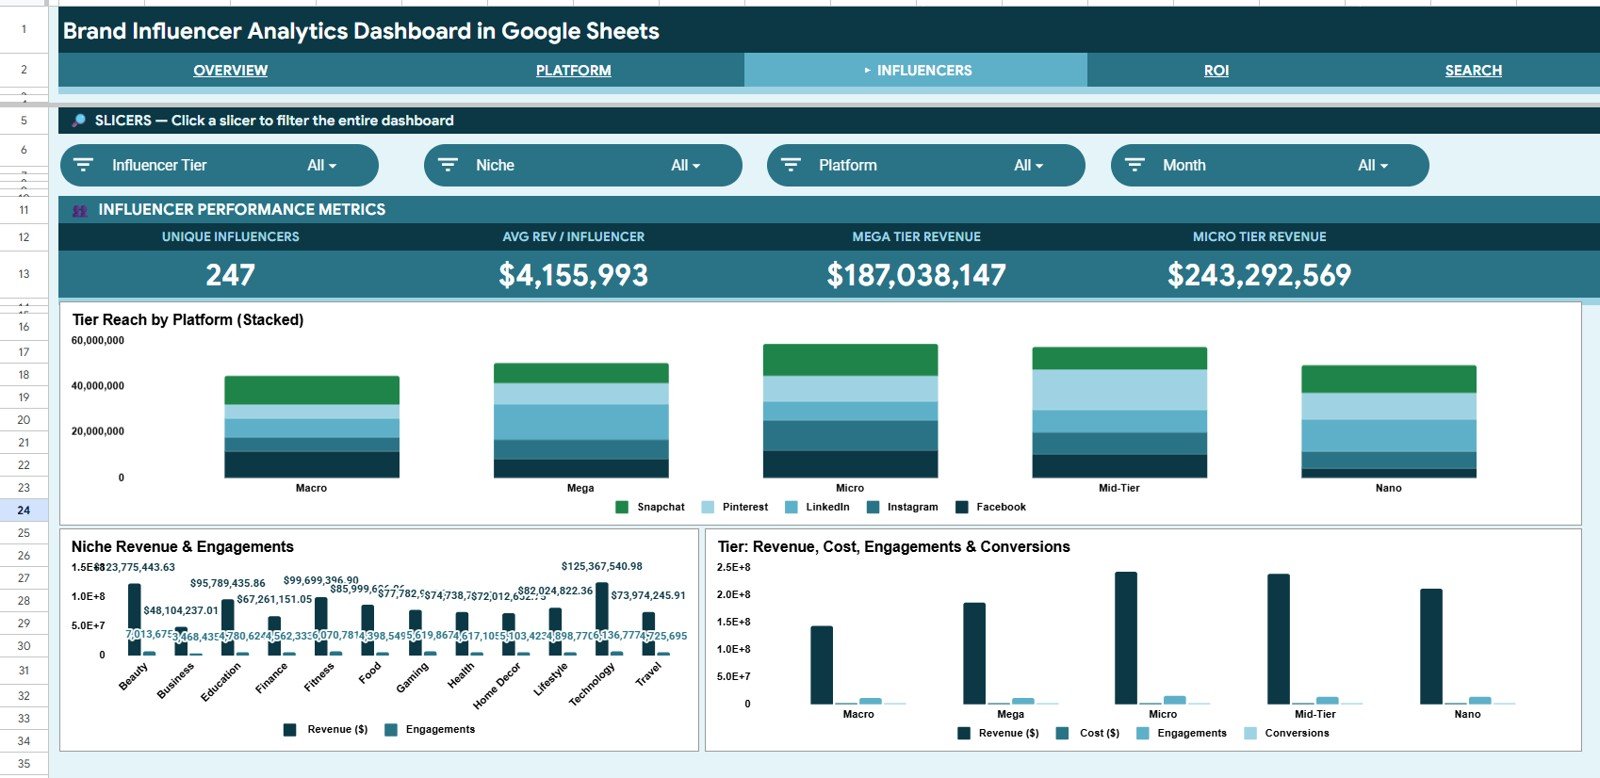
Slicers: Influencer Tier, Niche, Platform and Month. Influencer Performance Metrics cards: Unique Influencers, Avg Rev / Influencer, Mega Tier Revenue and Micro Tier Revenue. Charts: Tier Reach by Platform (Stacked), Niche Revenue & Engagements and Tier: Revenue, Cost, Engagements & Conversions. This is the page for deciding which of the five tiers (Nano, Micro, Mid-Tier, Macro and Mega) gives the best return.
Page 4: ROI
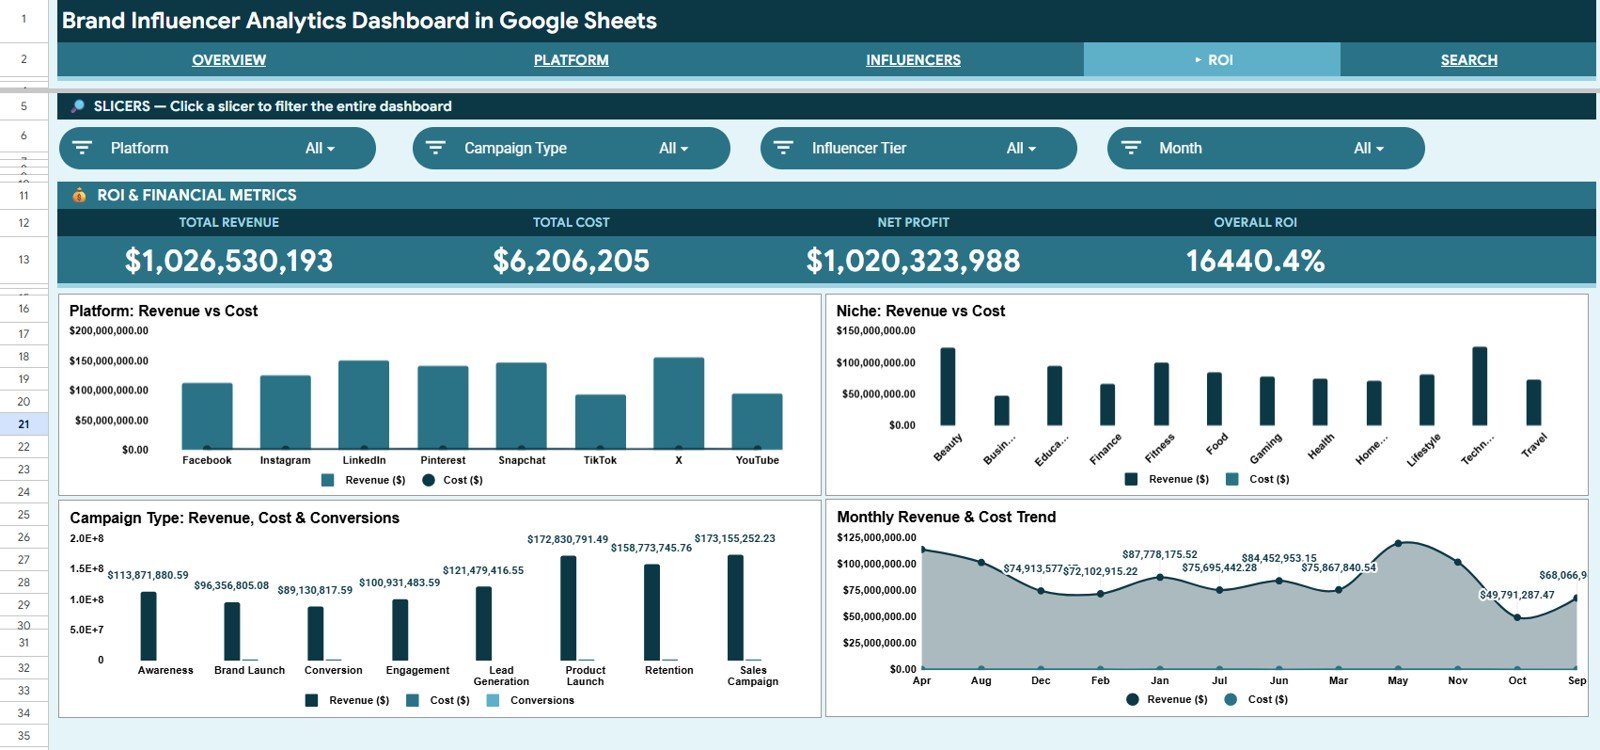
Slicers: Platform, Campaign Type, Influencer Tier and Month. ROI & Financial Metrics cards: Total Revenue, Total Cost, Net Profit and Overall ROI. Charts: Platform: Revenue vs Cost, Niche: Revenue vs Cost, Campaign Type: Revenue, Cost & Conversions and the Monthly Revenue & Cost Trend, which make profitable channels and formats obvious at a glance.
Search Sheet
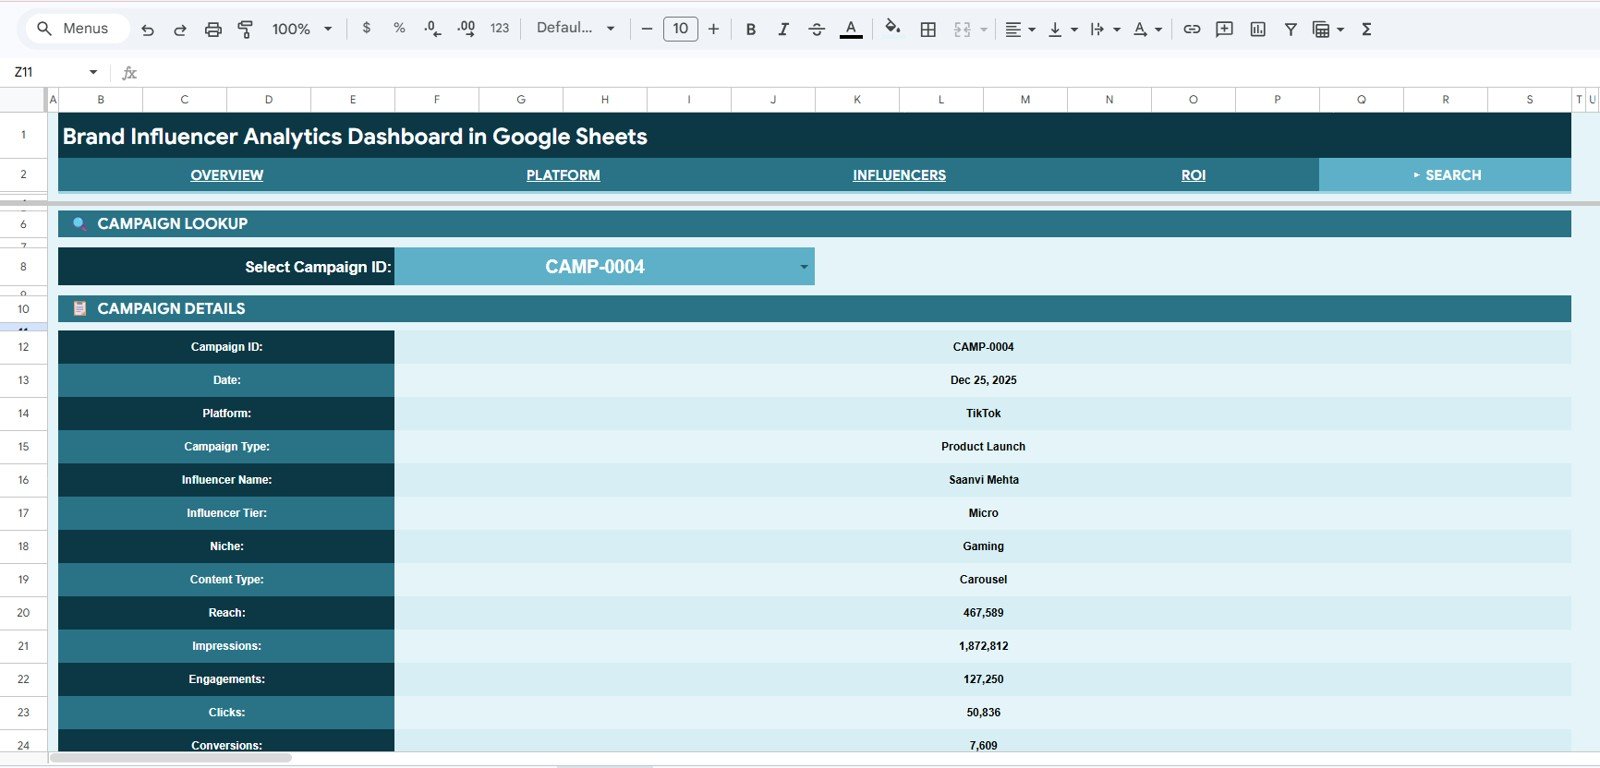
The Search sheet is a campaign lookup. Select any Campaign ID from the dropdown (for example CAMP-0004) and it returns the full record: Date, Platform, Campaign Type, Influencer Name, Influencer Tier, Niche, Content Type, Reach, Impressions, Engagements, Clicks and Conversions.
Data Sheet
The Data sheet is the single source for the whole workbook, with one row per campaign: Campaign ID, Date, Platform, Campaign Type, Influencer Name, Influencer Tier, Niche, Content Type, Reach, Impressions, Engagements, Clicks, Conversions, Revenue ($), Cost ($) and Month. Add your campaigns in the same column format and every KPI card, chart, slicer and lookup expands automatically to include the new rows.
How the Calculated KPIs Work
Most cards are simple totals of a Data sheet column. The calculated ones below reproduce the numbers shown in the sample screenshots.
| KPI (page) | What it measures | Formula | Better when |
|---|---|---|---|
| Avg Engagement Rate (Platform) | How often an impression turns into an engagement | Total Engagements ÷ Total Impressions (61,396,034 ÷ 766,054,806 = 8.01%) | Higher |
| Avg Rev / Influencer (Influencers) | Revenue generated per creator | Total Revenue ÷ Unique Influencers (247 in the sample) | Higher |
| Net Profit (ROI) | Money left after creator cost | Total Revenue − Total Cost | Higher |
| Overall ROI (ROI) | Return on every dollar spent on creators | Net Profit ÷ Total Cost × 100 | Higher |
| Mega / Micro Tier Revenue (Influencers) | Revenue from the two tiers shown on the cards | Sum of Revenue ($) where Influencer Tier is Mega or Micro | Higher |
The sample data is illustrative, so the very large ROI figure in the screenshots simply reflects how the demo revenue and cost values were generated. With your own campaigns, expect far more realistic numbers.
Brand Influencer Analytics Dashboard vs. Excel vs. Paid Influencer SaaS
| Feature | Brand Influencer Analytics Dashboard (Google Sheets) | Microsoft Excel Dashboard | Paid Influencer SaaS (GRIN / Upfluence / CreatorIQ) |
|---|---|---|---|
| Cost | One-time purchase | One-time purchase | Monthly subscription |
| Platform | Google Sheets (browser, free) | Microsoft Excel (desktop) | Proprietary web app |
| Setup time | Under 10 minutes | Under 10 minutes | Days (onboarding + integrations) |
| Real-time team collaboration | ✅ Built-in via Google Drive | Needs OneDrive/SharePoint | ✅ Included |
| Mobile access | ✅ Google Sheets app | Excel mobile, limited | ✅ Included |
| Customizable fields | ✅ Fully editable | ✅ Fully editable | Locked to vendor schema |
| Campaign ID lookup | ✅ Built-in Search sheet | With formulas | ✅ Included |
| Live API data, discovery, contracts | No (manual entry) | No (manual entry) | Usually yes |
Who Should Use This Template
Perfect for:
- Brand marketing managers running influencer campaigns across multiple platforms who need one tracker for spend and return
- Small and mid-size agencies reporting creator results to clients without an expensive monthly platform
- Social media teams comparing Nano, Micro, Mid-Tier, Macro and Mega influencers on cost and conversions
- Freelancers and consultants who want a clean, shareable Google Sheets report per client
Not a fit if:
- You need automatic API ingestion from Instagram, TikTok or YouTube; this is a manual-entry analytics tracker
- You require built-in influencer discovery, contracts or payment processing
- You want a fully managed dashboard service and never open Google Sheets
Real-World Use Cases
In-house brand team: an influencer manager at a small beauty brand compares revenue and cost across Instagram and TikTok, spots which niches convert, and shows the founder a clean monthly ROI view.
Social media agency: the agency keeps one copy per client, filters the Influencers page by tier, and shows each client whether micro creators return more revenue per dollar than larger names.
Freelance consultant: uses the Search sheet to answer ad-hoc client questions on a call, pulling a single campaign’s reach, engagements and conversions in seconds.
Advantages
A one-time purchase replaces a monthly reporting workload that would otherwise push teams towards a subscription tool. Because it lives in Google Sheets, the whole team can open, edit and share it from any browser or the mobile app, with no install and no per-user licence. The slicer-driven pages turn a client review that used to need an hour of copy-paste into a few filter clicks, and the chart ranges expand as your campaign history grows.
Opportunities for Improvement
This dashboard is a manual-entry analytics tool, so it does not pull live data from social platform APIs; you (or a connected export) supply the campaign rows. It also does not handle influencer discovery, contract management or creator payments. Teams that need automated nightly syncs or enterprise access controls should treat it as a reporting layer rather than a system of record.
Best Practices
- Keep the Data sheet column order intact, because every chart and the Search lookup depend on it.
- Standardise platform, niche and tier labels (e.g. always “Instagram”, not “IG”) so slicers group cleanly.
- Add campaigns as they close rather than in a monthly batch, so the Overview always reflects current spend.
- Duplicate the file per client if you run an agency, so each report stays isolated and shareable.
- Use the ROI page before renewing any creator contract to confirm revenue actually exceeded cost.
Want to build reports like this from your own campaign data? The Excel Pivot Tables and Dashboards course on NextGenTemplates Academy teaches the summarising, charting and slicer techniques step by step.
Related Influencer and Social Media Dashboards
If you track KPIs against monthly targets, see the Influencer ROI KPI Dashboard in Google Sheets and the Influencer Marketing KPI Dashboard. For campaign-level tracking, the Influencer Campaign Dashboard and the Social Media Influencer Tracking Dashboard are close companions, and the Social Media ROI KPI Dashboard covers organic and paid social as a whole.
Related templates on NextGenTemplates: the Social Media Influencer Tracking Dashboard in Google Sheets and the Marketing and Social Media Analytics Kit.
Frequently Asked Questions
What KPIs does the Brand Influencer Analytics Dashboard in Google Sheets track?
The Overview shows Total Revenue, Total Cost, Total Conversions and Total Engagements. The Platform page adds Total Reach, Total Impressions, Total Clicks and Avg Engagement Rate; the Influencers page adds Unique Influencers, Avg Rev / Influencer, Mega Tier Revenue and Micro Tier Revenue; and the ROI page adds Net Profit and Overall ROI.
How long does setup take?
Usually under 10 minutes. Make your own copy, paste your campaign rows into the Data sheet in the existing column order, and every KPI card, chart, slicer and the Search lookup update automatically.
How does this compare to paid influencer SaaS like GRIN or Upfluence?
Paid influencer platforms are monthly subscriptions that add discovery, contracts and live API data. This dashboard is a one-time purchase focused on platform, tier and ROI reporting, without those extra functions.
Can I filter the dashboard by platform or influencer tier?
Yes. Each analysis page has four native slicers. The Overview filters by Year, Platform, Influencer Tier and Campaign Type, and the Influencers and ROI pages also offer Month, Niche and other filters.
Do I need to install anything?
No. It runs entirely in Google Sheets in your browser. Make a copy to your own Google Drive and start entering data.
Can I add more campaigns over time?
Yes. Add new campaign rows to the Data sheet in the same format and every chart range, KPI card, slicer and the Search lookup expand automatically.
About the Author
Built by PK, Microsoft Certified Professional with 15+ years of Excel, Google Sheets, and Power BI experience. Founder of NextGenTemplates. Every template is hand-built and tested before release.
Wrapping Up
If you are spending real money on creators but still rebuilding the same report every month, the Brand Influencer Analytics Dashboard in Google Sheets gives you a connected, slicer-driven view of revenue, cost, engagement and ROI with no subscription and no per-user fees. Load your last few campaigns into the Data sheet and check the ROI page before your next creator renewal.
Get the Brand Influencer Analytics Dashboard
📅 Last updated: October 2026