The Business Development Performance Dashboard in Google Sheets gives sales and business development teams a ready reporting system: 4 executive KPI cards, 16 analysis charts, slicers on every page, a Deal ID search sheet and one editable data sheet. Instead of rebuilding pipeline reports before every sales meeting, you paste your deal records into the Data Sheet and review pipeline value, deal count, win rate, average deal size, rep performance, lead sources, regions, industries and expected close dates in one browser-based dashboard.
It suits teams that want structured pipeline visibility without paying for a full CRM reporting module, especially if you already track deals in Google Sheets or export them from another tool.
🎥 Watch the Video Tutorial
Get the Business Development Performance Dashboard
Key Features of the Business Development Performance Dashboard in Google Sheets
- Working tabs: Overview, Pipeline, Sales Performance, Lead Sources, Search Sheet and Data Sheet, with an Instructions tab in the navigation bar.
- 4 headline KPI cards: Total Pipeline Value, Total Deals, Win Rate and Avg Deal Size, plus four more cards on each analysis tab.
- 16 charts: stages, statuses, regions, months, industries, reps, lead sources, probability and won value.
- Interactive slicers: four per dashboard tab, so you can filter quickly without rebuilding charts.
- Deal lookup: choose a Deal ID and review a single opportunity in detail.
- Editable data structure: replace the sample rows with your own business development records.
- Google Sheets access: use the dashboard from a browser and share it with approved team members.
KPI Cards and Slicers by Tab
| Tab | KPI cards | Slicers |
|---|---|---|
| Overview | Total Pipeline Value, Total Deals, Win Rate, Avg Deal Size | Year, Region, Deal Stage, Sales Rep |
| Pipeline | Open Deals, Open Pipeline Value, Avg Probability, In Negotiation | Year, Deal Stage, Industry, Status |
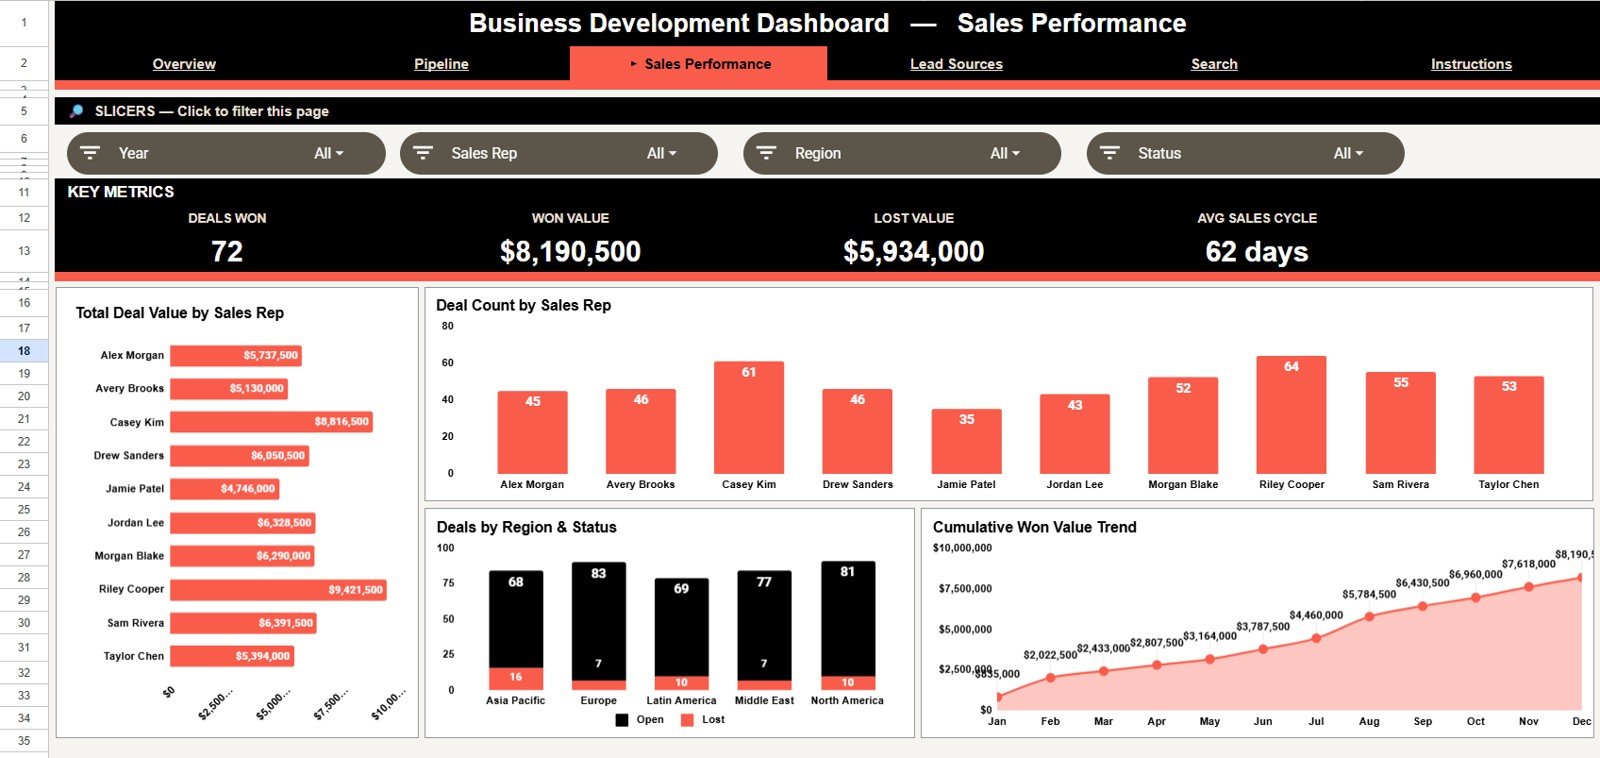
| Sales Performance | Deals Won, Won Value, Lost Value, Avg Sales Cycle | Year, Sales Rep, Region, Status |
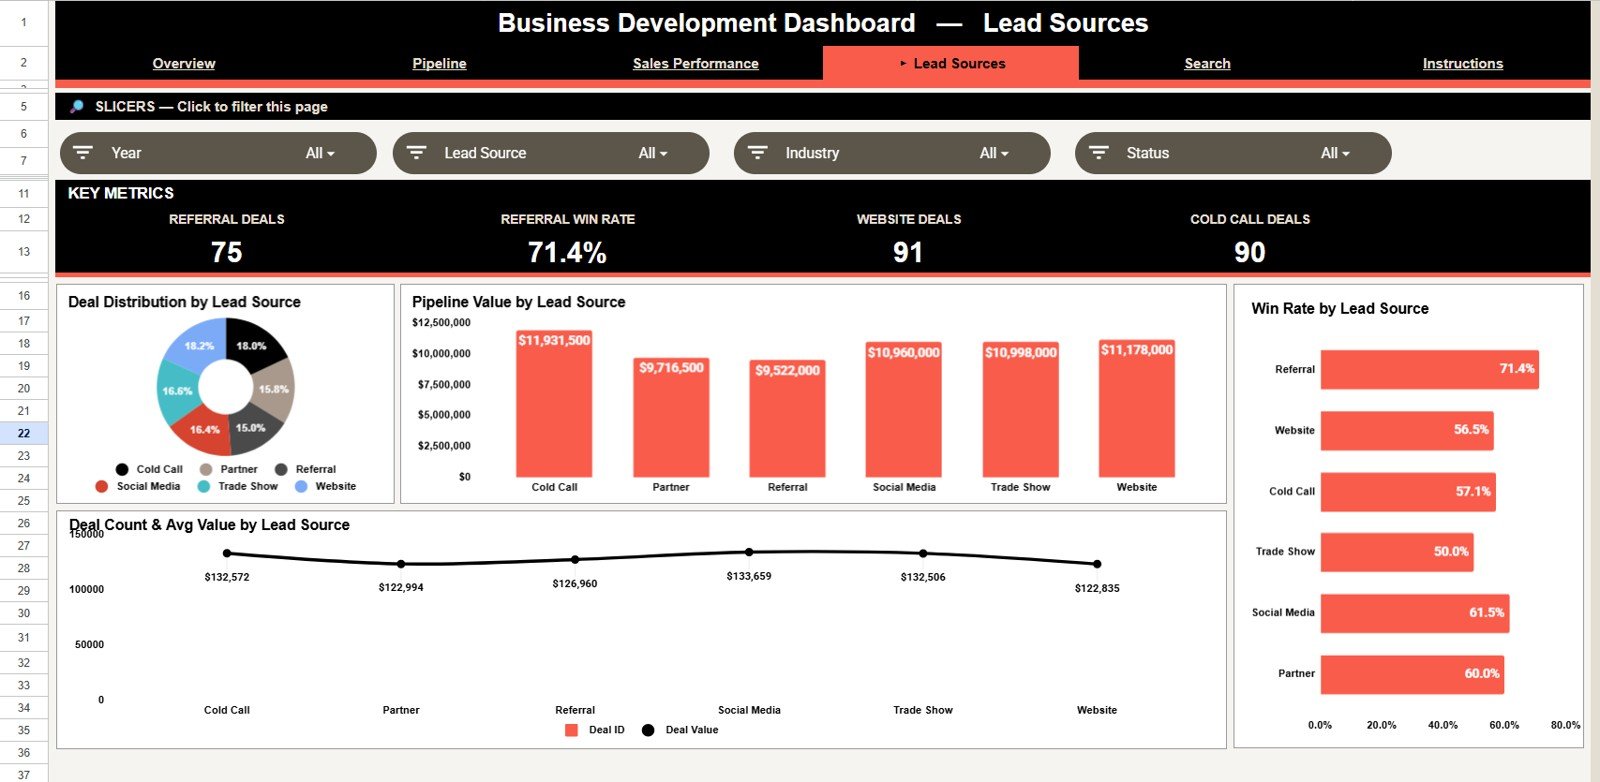
| Lead Sources | Referral Deals, Referral Win Rate, Website Deals, Cold Call Deals | Year, Lead Source, Industry, Status |
Win Rate compares won deals with closed deals. In the sample data, 72 deals are Closed Won and 50 are Closed Lost, so 72 ÷ (72 + 50) = 59.0%, which matches the Overview card.
Dashboard Pages Explained
1. Overview Page
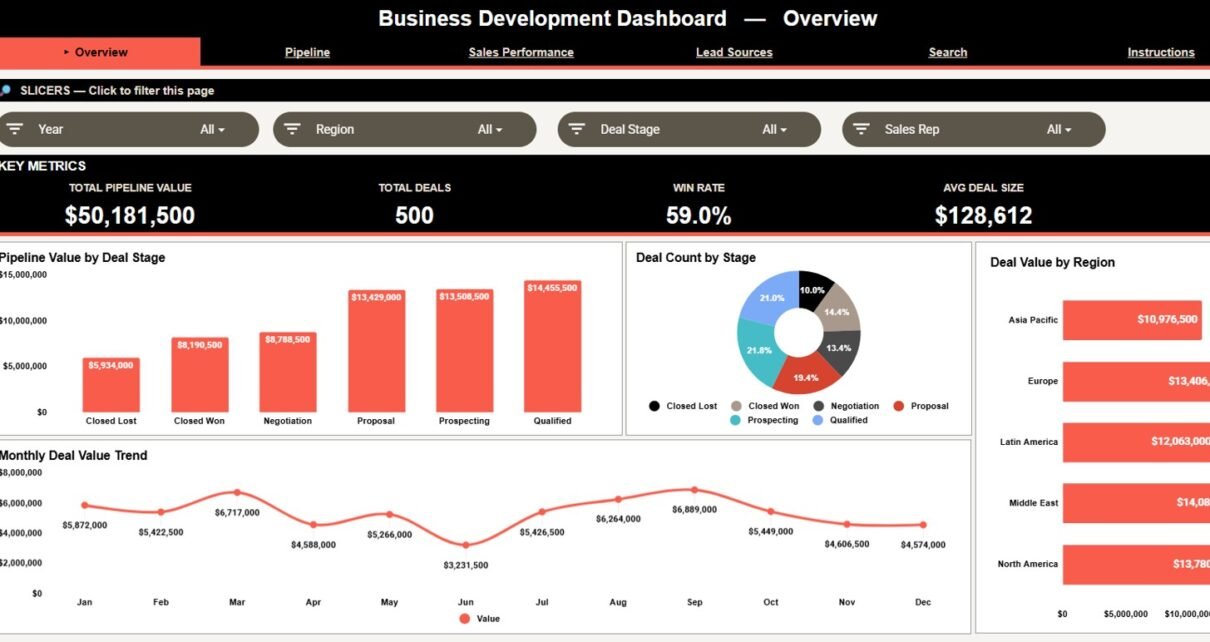
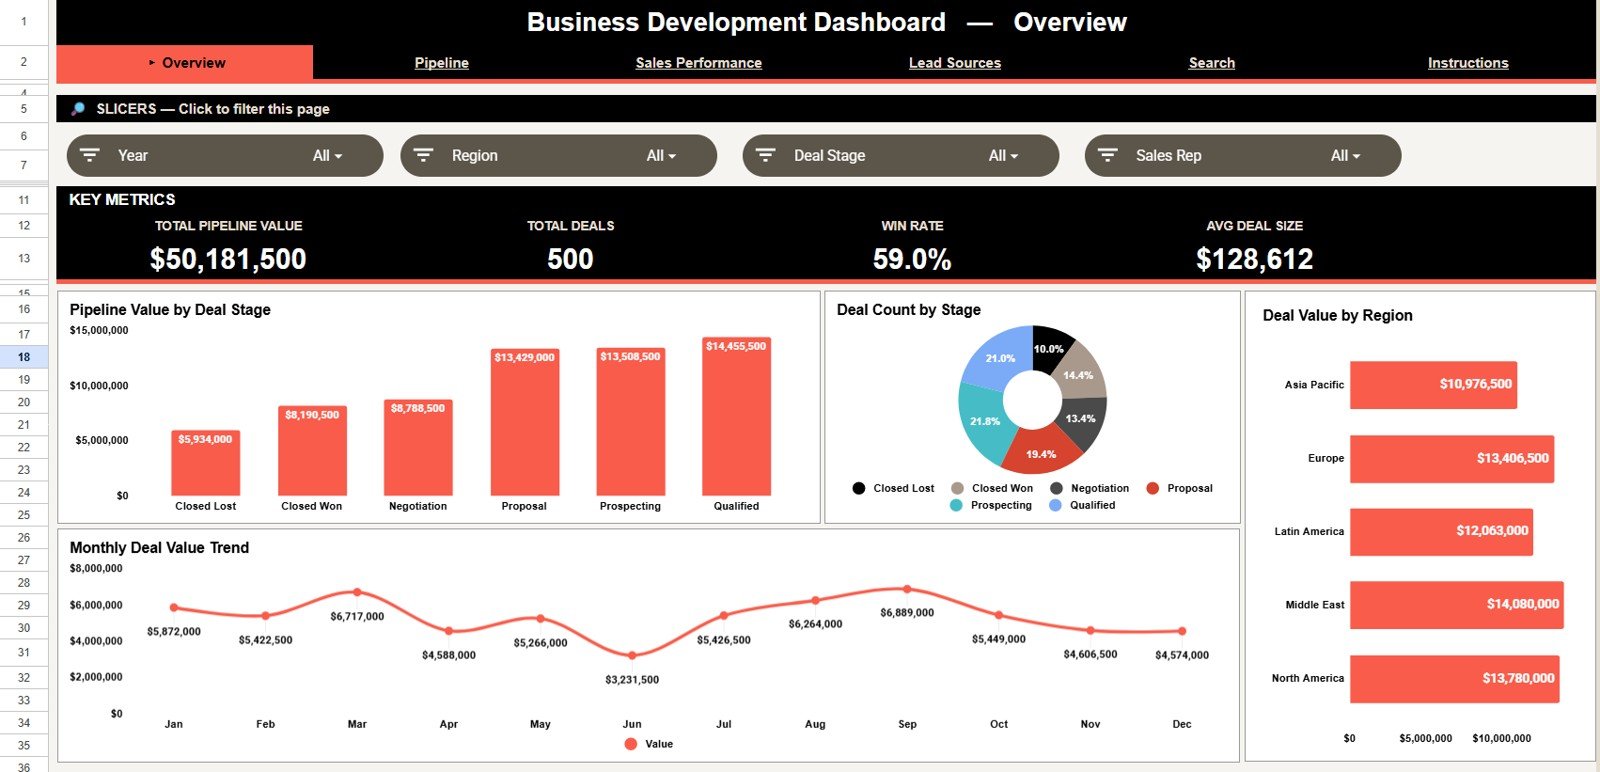
The Overview page is the executive summary. It shows Total Pipeline Value, Total Deals, Win Rate and Avg Deal Size, so managers can see deal volume and pipeline quality before opening the detailed tabs.
Pipeline Value by Deal Stage: shows where value sits across Prospecting, Qualified, Proposal, Negotiation, Closed Won and Closed Lost, and whether value is moving toward close.
Deal Count by Stage: compares the number of deals in each stage to reveal bottlenecks.
Deal Value by Region: compares value across Asia Pacific, Europe, Latin America, Middle East and North America for territory planning.
Monthly Deal Value Trend: shows deal value month by month to spot seasonality, campaign impact and pipeline growth.
2. Pipeline
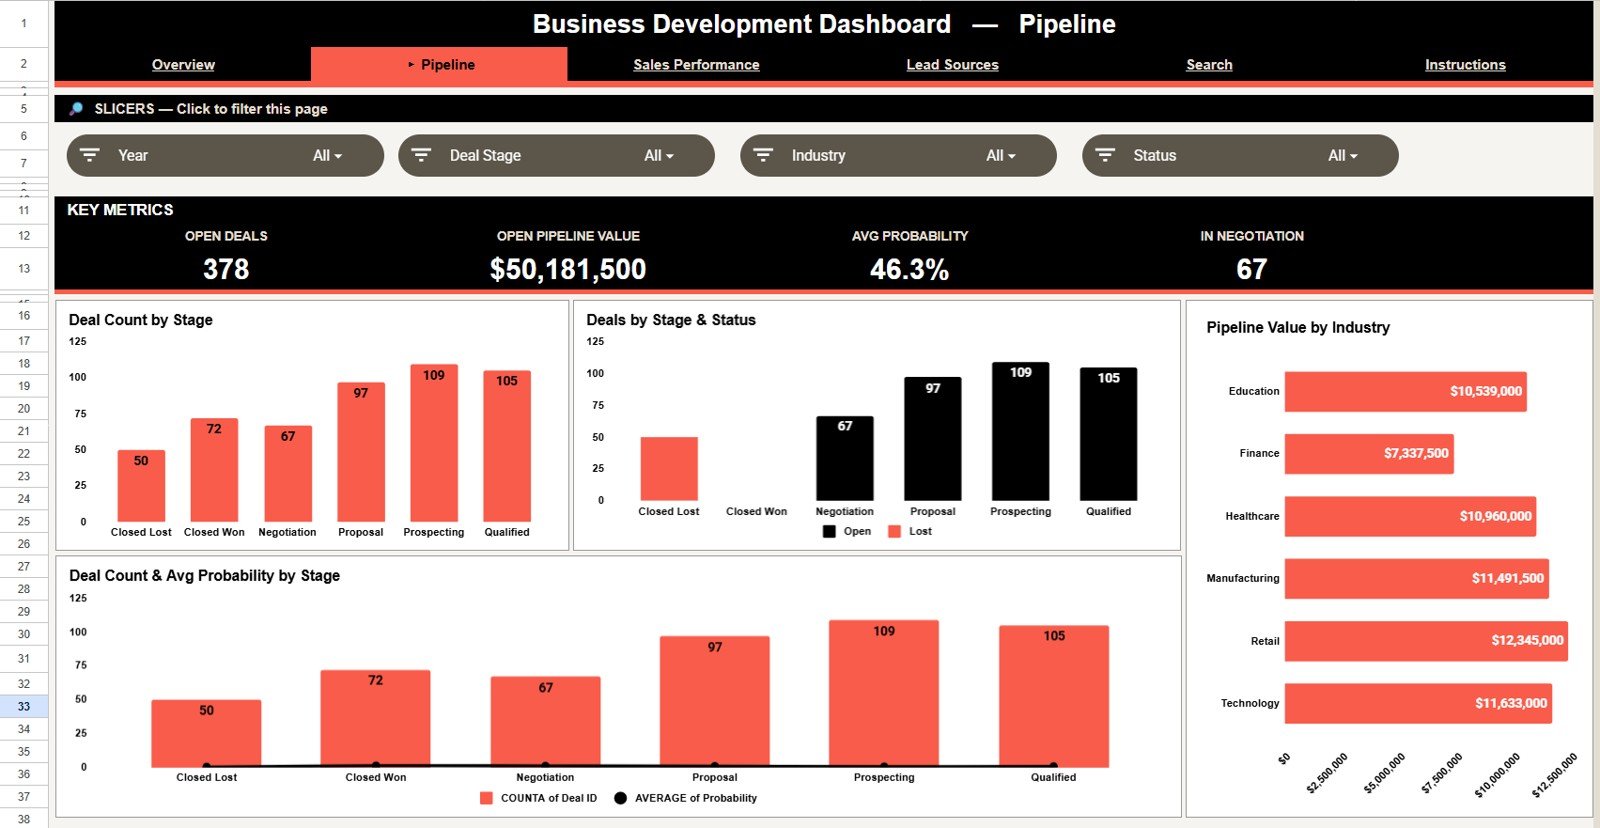
The Pipeline tab looks deeper at stage health, deal status, industry mix and stage probability. It is useful in weekly pipeline reviews because it connects volume, value and close likelihood in one place.
Deal Count by Stage: shows whether the pipeline is balanced or crowded in one stage.
Deals by Stage & Status: splits each stage into Open and Lost deals, separating live opportunities from lost ones.
Pipeline Value by Industry: compares value across Education, Finance, Healthcare, Manufacturing, Retail and Technology.
Deal Count & Avg Probability by Stage: combines stage volume with average probability, so you can see whether crowded stages are also likely to convert.
3. Sales Performance
The Sales Performance tab focuses on rep contribution and regional status, so sales leaders can compare activity, deal value and won value without switching reports.
Total Deal Value by Sales Rep: compares the pipeline value each rep owns.
Deal Count by Sales Rep: shows how many deals each rep handles, for comparing workload with value.
Deals by Region & Status: splits each region’s deals into Open and Lost to show where deals move forward and where they stall.
Cumulative Won Value Trend: shows won value building month by month across the year.
4. Lead Sources
The Lead Sources tab connects prospecting channels with pipeline output, which helps you decide which channels produce volume, value and better conversion. Sources in the sample data are Cold Call, Partner, Referral, Social Media, Trade Show and Website.
Deal Distribution by Lead Source: shows whether pipeline volume depends too heavily on one source.
Pipeline Value by Lead Source: highlights sources that may produce fewer deals but more value.
Win Rate by Lead Source: compares conversion by source, so effort can go to the strongest channels.
Deal Count & Avg Value by Lead Source: separates high-volume sources from those that bring larger deals.
5. Search Sheet Tab
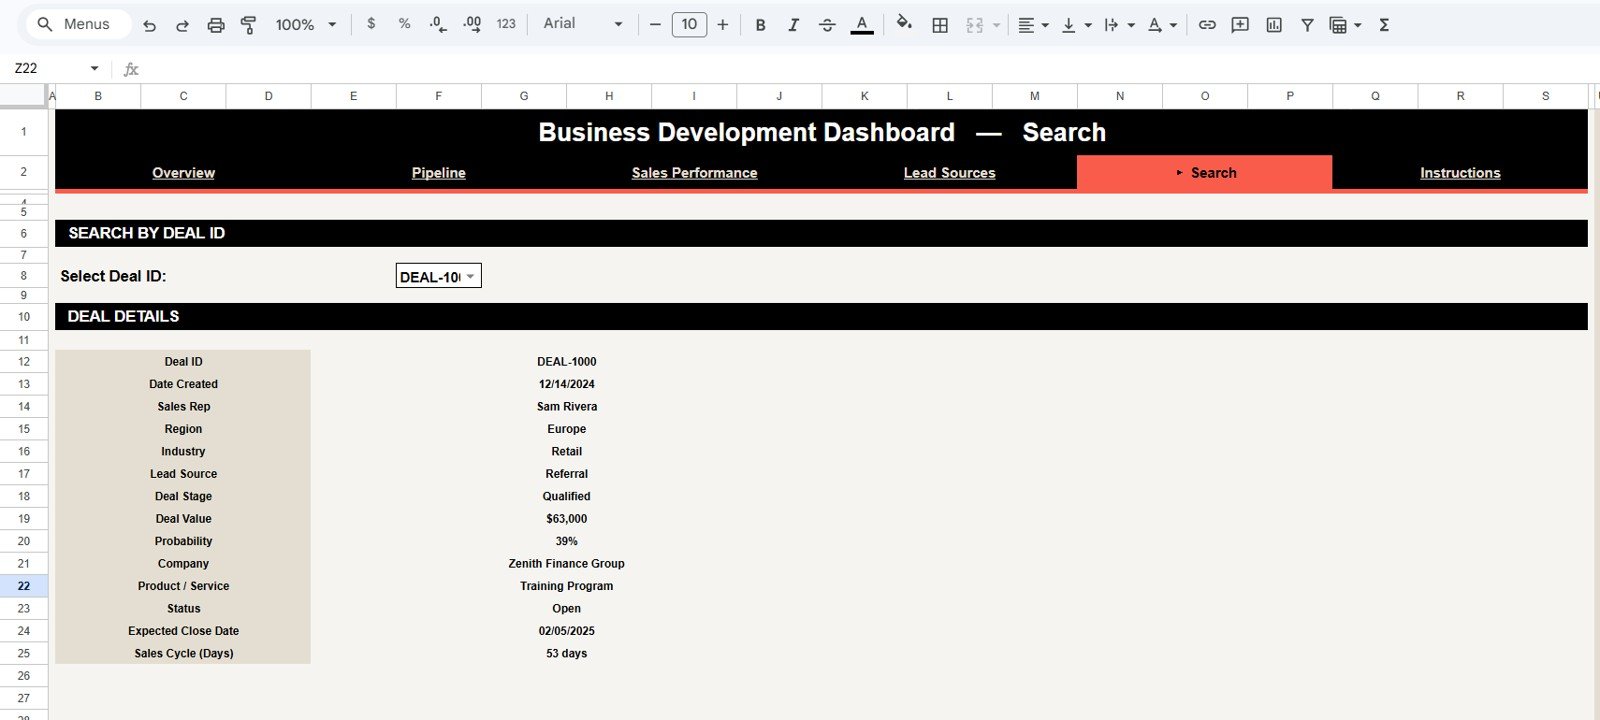
The Search Sheet lets you select a Deal ID and see the deal’s Date Created, Sales Rep, Region, Industry, Lead Source, Deal Stage, Deal Value, Probability, Company, Product / Service, Status, Expected Close Date and Sales Cycle (Days). It is a quick way to review one opportunity in a meeting without filtering the data sheet.
6. Data Sheet Tab
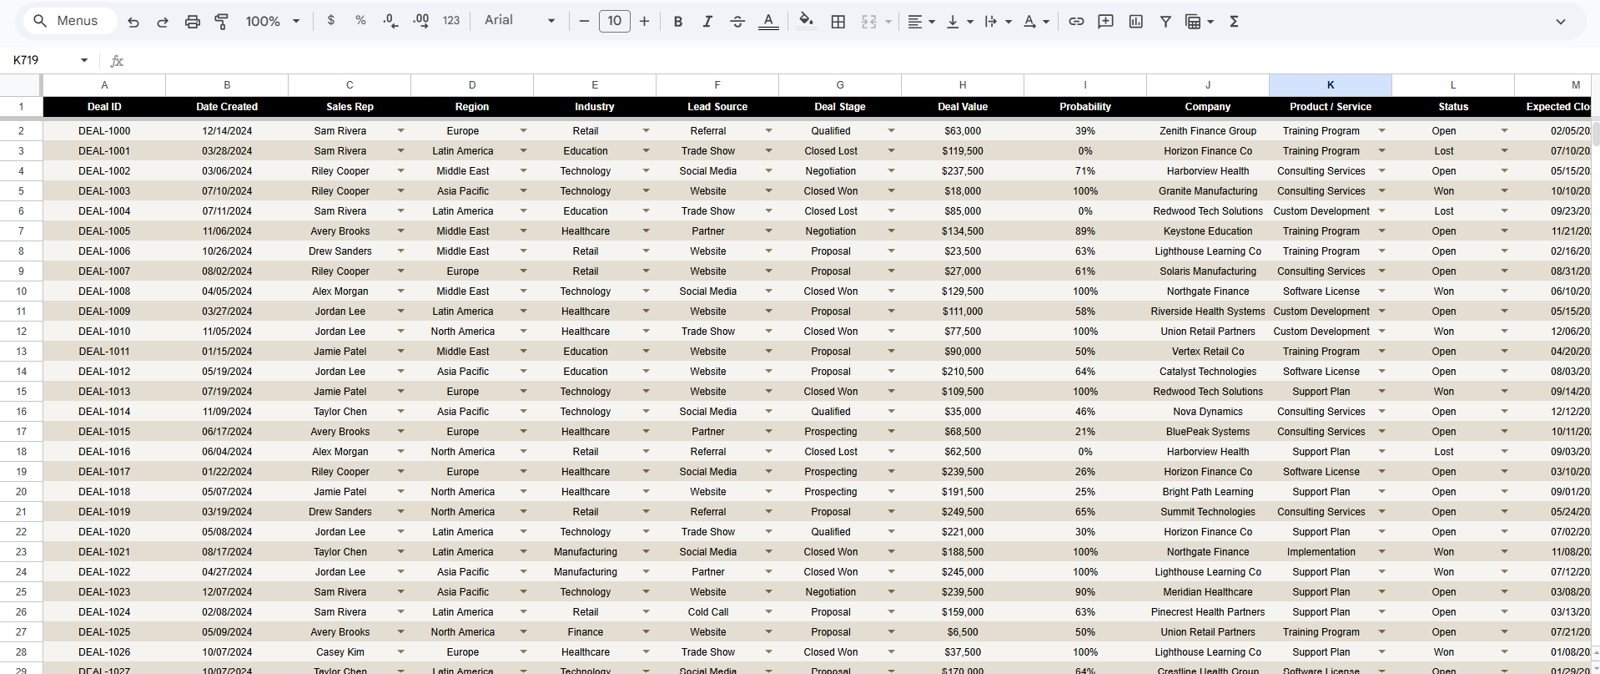
The Data Sheet is where you add or replace the pipeline records that power the dashboard. Keep the same columns: Deal ID, Date Created, Sales Rep, Region, Industry, Lead Source, Deal Stage, Deal Value, Probability, Company, Product / Service, Status (Open, Won or Lost) and Expected Close Date. Several columns use dropdowns to keep entries consistent.
Business Development Performance Dashboard in Google Sheets vs. Excel vs. CRM Software
| Feature | This Google Sheets dashboard | Microsoft Excel dashboard | Paid CRM or sales software |
|---|---|---|---|
| Cost | One-time purchase | Template cost plus Excel licence if needed | Monthly or annual subscription |
| Platform | Google Sheets in the browser | Excel desktop or Microsoft 365 | Vendor-hosted CRM |
| Setup time | Copy sheet and replace sample data | Open workbook and refresh or rebuild | Implementation and onboarding |
| Real-time team collaboration | Built into Google Drive sharing | Requires OneDrive or SharePoint | Usually included |
| Customizable fields | Editable columns, formulas, labels and charts | Editable workbook | Limited by admin settings and plan |
| Contact history, email and reminders | No | No | Yes |
| Best for | Spreadsheet-based pipeline reporting | Offline spreadsheet workflows | Live CRM workflow automation |
Who Should Use This Template
This dashboard is built for business development managers, sales managers, founders, account executives, sales operations analysts, consultants, agencies and small teams that need a clear view of pipeline performance by rep, region, industry, stage, status and lead source.
It is not a full CRM. It does not replace contact history, email automation, lead assignment, reminders, quotes or proposal management. If your team needs those, use this dashboard as a reporting companion to your CRM.
Real-World Use Cases
Anita, business development manager: opens the Overview and Pipeline tabs before weekly reviews to check whether deal value is moving toward closing stages.
Rahul, founder of a B2B services firm: reviews the Lead Sources tab to decide whether referrals, cold calls, trade shows or website leads deserve more attention.
Melissa, sales operations consultant: keeps one copy per client and uses the Data Sheet format to standardise messy CRM exports into one reporting structure.
Advantages of the Business Development Performance Dashboard in Google Sheets
- Fast setup: copy the sheet, replace the sample data and start reviewing.
- Shared visibility: one dashboard for every approved user.
- Practical pipeline views: the numbers managers usually need in pipeline meetings.
- Search support: the Deal ID lookup moves you from summary to record-level review.
- Editable structure: adapt labels, charts and fields as your sales process changes.
Limitations to Know
The template depends on consistent data entry. Define how deal stages, statuses, lead sources and regions are written so slicers and charts stay clean. You can extend it with fields such as forecast category, next step, campaign name or customer segment if those matter to your process.
If you use a CRM, the strongest workflow is to export clean pipeline data on a regular schedule and paste it into the Data Sheet. That keeps the dashboard simple and the CRM as the source of truth.
Best Practices
- Update on a fixed schedule, such as weekly before pipeline review.
- Keep stage and status names consistent across every row.
- Use one unique Deal ID per opportunity so the Search Sheet works reliably.
- Read win rate alongside deal value, not deal count alone.
- Compare lead source volume with average deal value before shifting budget.
- Keep an untouched backup copy before changing formulas or chart ranges.
Related Templates and Guides
If this dashboard fits your workflow, you may also like the Lead Nurturing KPI Dashboard in Google Sheets and the Lead Tracker Data Entry System in Excel.
On NeoTech Navigators, compare it with the earlier Business Development Dashboard in Google Sheets and the Sales Performance Management Dashboard. For KPI tracking, see the CRM KPI Dashboard and the Lead Nurturing KPI Dashboard walkthrough. Teams that want a full browser app can look at the CRM and Sales Pipeline Management System Web App.
If you want to build pipeline reports like this yourself, the Excel Pivot Tables and Dashboards course on NextGenTemplates Academy covers pivots, slicers and dashboard charts in structured lessons.
Frequently Asked Questions
What does the Business Development Performance Dashboard in Google Sheets track?
Total Pipeline Value, Total Deals, Win Rate and Avg Deal Size, plus deal stage, status, region, industry, month, sales rep, lead source, probability, won and lost value, and deal-level details.
How is the win rate calculated?
Won deals divided by closed deals (won plus lost). In the sample data, 72 won and 50 lost deals give a 59.0% win rate.
Can I use this dashboard without Excel?
Yes. It is built for Google Sheets, so you can use it in a browser or the Google Sheets app.
Does this dashboard replace a CRM?
No. It is a reporting dashboard. Use it for pipeline analysis after deals are entered or exported into the Data Sheet.
Can I share it with my team?
Yes. Make your own copy and share it with approved team members through Google Drive permissions.
What is the Search Sheet for?
Select a Deal ID to see one deal in detail, including sales rep, region, industry, stage, value, probability, status, expected close date and sales cycle.
About the Author
Built by PK, a Microsoft Certified Professional with 15+ years of Excel, Google Sheets and Power BI experience. He founded NextGenTemplates, and its YouTube channels reach 300K+ subscribers. Every template is built by hand and tested before release.
Wrapping Up
The Business Development Performance Dashboard in Google Sheets gives sales and business development teams one place to review pipeline value, stages, lead sources, reps, regions, win rate and individual deals. Paste in your latest CRM export, filter by rep or region, and walk into your next pipeline meeting with the numbers ready.
Get the Business Development Performance Dashboard
📅 Last updated: October 2026