The American film and television industry supports 2.01 million jobs, pays $202 billion in wages, and includes more than 162,000 businesses, according to the Motion Picture Association. With that much content, labor, budget, and distribution activity in motion, teams need a faster way to read title performance without rebuilding reports every week. The Film and Television Dashboard in Google Sheets gives studios, broadcasters, streamers, distributors, production teams, and media analysts a ready-to-use reporting workbook for titles, live status, revenue, budgets, margins, ratings, viewers, episodes, genres, platforms, prime slots, releases, runtime, and audience segments.
Get the Film and Television Dashboard in Google Sheets
Because it is built in Google Sheets, the file can fit normal spreadsheet workflows. Google also documents Drive sharing controls for viewer, commenter, and editor access, which makes the format useful for teams that need browser-based collaboration without buying another dashboard subscription.Film and Television Dashboard in Google Sheets
Key Features of Film and Television Dashboard in Google Sheets
- Six reporting tabs: Overview, Next Releases Analysis, Audience Platform Analysis, Audience Segment Analysis, Financial Slate Analysis, and Data Sheet.
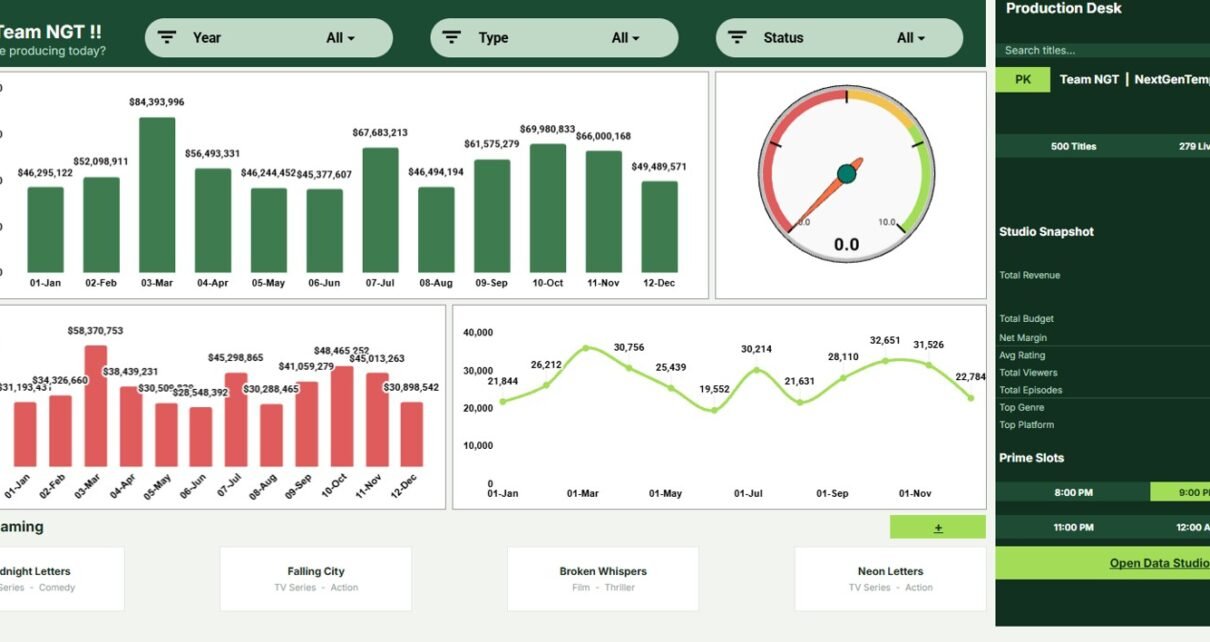
- Executive cards: The Overview Page includes 500 Titles, 279 Live, 7.7 Avg, Total Revenue, Total Budget, Net Margin, Avg Rating, Total Viewers, Total Episodes, Top Genre, Top Platform, and Prime Slots.Film and Television Dashboard in Google Sheets
- Chart-driven pages: Review 24 chart views across revenue, budget, viewers, ratings, episodes, runtime, titles, platforms, fresh releases, trending titles, family favorites, and top earners.
- Slicer-ready workflow: Use dashboard slicers to filter quickly during release meetings, content reviews, financial reviews, and platform discussions.
- Editable data sheet: Replace sample records with your own film and TV catalog data while keeping the same source format.Film and Television Dashboard in Google Sheets
- Built for media teams: The dashboard focuses on title-level decision making rather than generic business reporting.Film and Television Dashboard in Google Sheets
Dashboard Pages Explanation
The template includes multiple dashboard pages so each team can work at the right level of detail. Leadership can start with the Overview Page, then programming, platform, audience, and finance teams can move into the deeper analysis tabs.
1. Overview Page
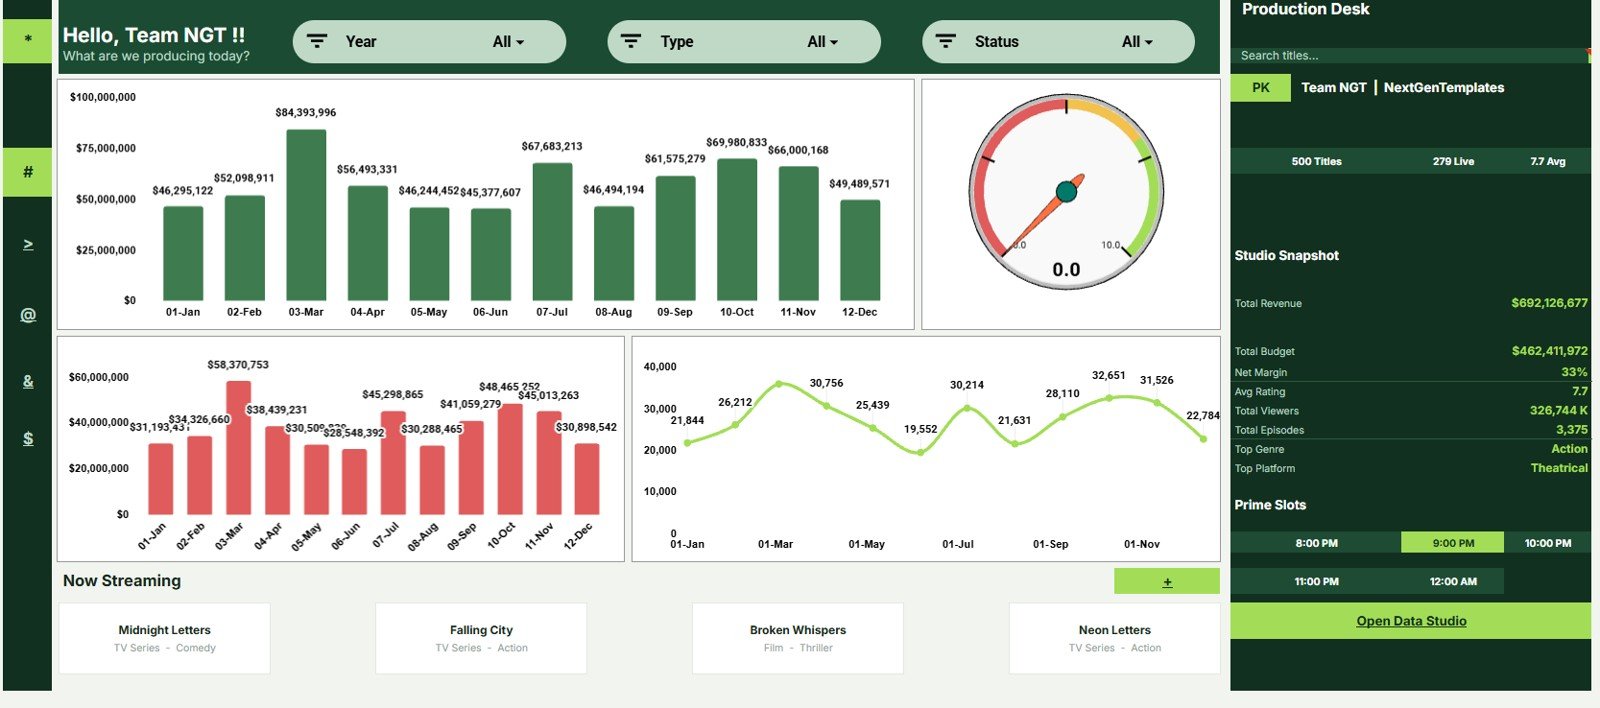
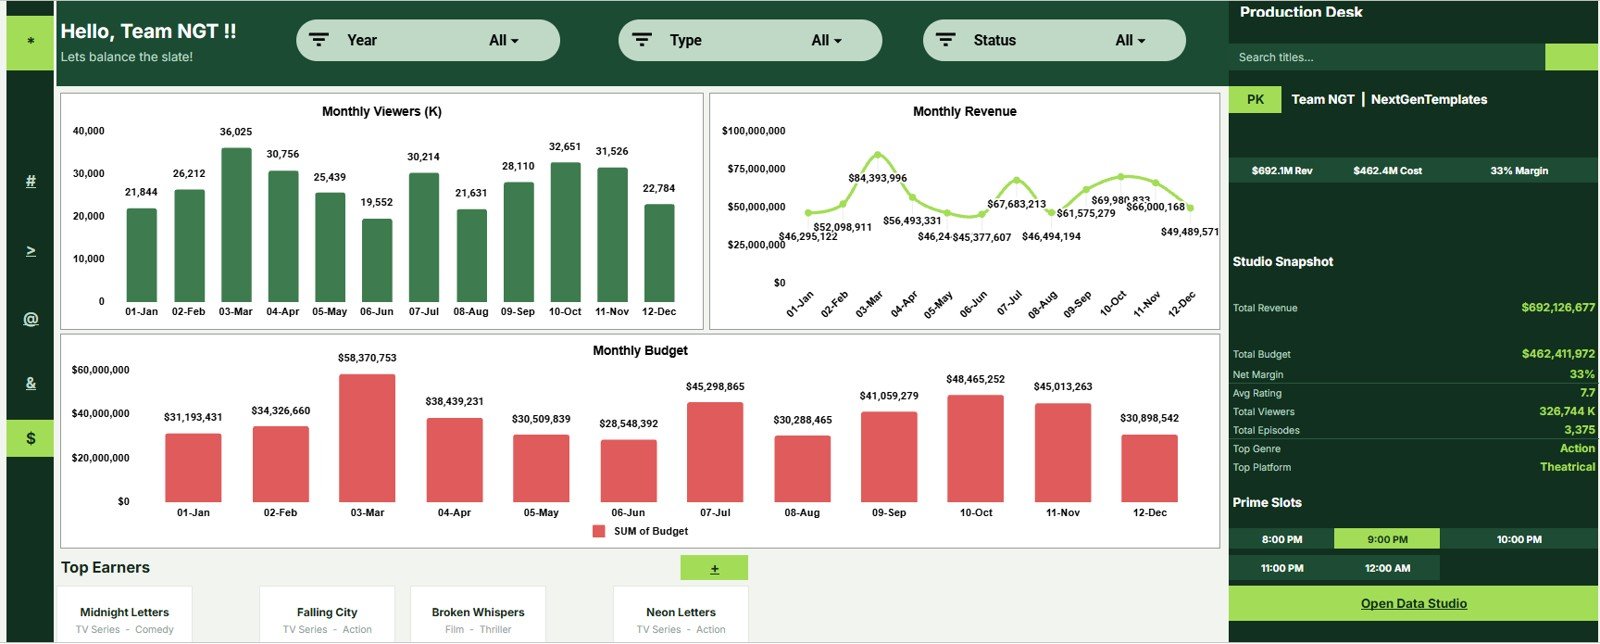
The Overview Page gives a high-level view of the full catalog. Cards at the top summarize 500 Titles, 279 Live, 7.7 Avg, Total Revenue, Total Budget, Net Margin, Avg Rating, Total Viewers, Total Episodes, Top Genre, Top Platform, and Prime Slots.
- Monthly Revenue by Month: This chart shows how revenue changes across the calendar. It helps teams connect seasonality, campaign timing, and release windows to revenue movement.
- Average Rating by Rating Range: This chart groups title ratings into ranges for faster quality review. It helps content leaders see whether the slate is concentrated in strong, average, or low-rating bands.
- Monthly Budget by Month: This chart tracks budget movement month by month. It helps finance teams compare spending pressure against the release and revenue calendar.
- Monthly Viewers by Month: This chart shows viewer volume trends over time. It helps audience teams spot spikes, dips, and months that may need additional promotion.
- Now Streaming by Title: This chart highlights titles currently available to stream. It helps teams keep live content visible during platform, licensing, and marketing reviews.
2. Next Releases Analysis
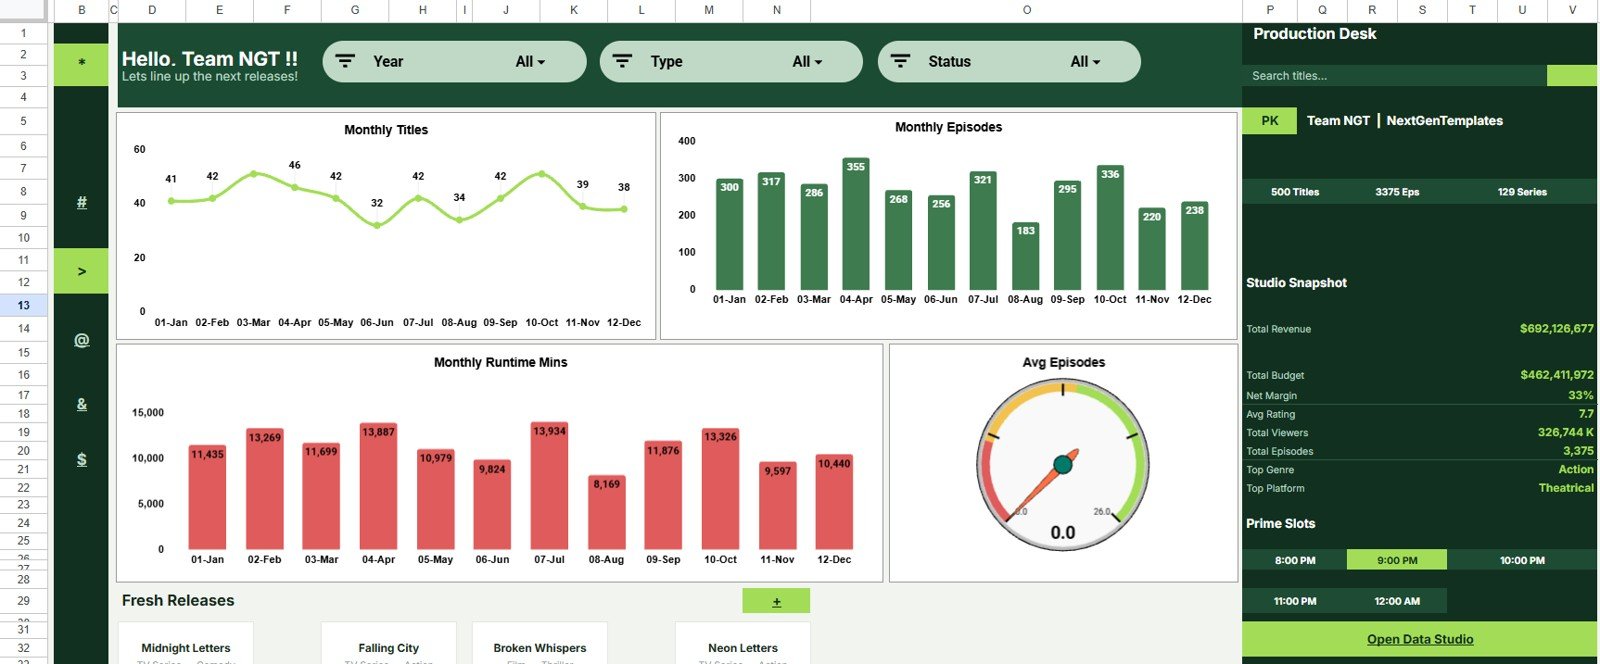
The Next Releases Analysis tab focuses on upcoming titles and launch planning. It helps release teams see how title count, episode volume, runtime, and fresh releases are distributed over time.
- Monthly Titles by Month: This chart shows how many titles are scheduled by month. It helps teams balance the release calendar and avoid overloaded launch periods.
- Monthly Episodes by Month: This chart tracks episode volume across upcoming months. It helps production and programming teams understand where episodic workload is increasing.
- Monthly Runtime Mins by Month: This chart shows total runtime minutes by month. It helps teams compare content volume beyond simple title counts.
- Average Episodes by Episode Range: This chart groups titles by episode ranges. It helps reviewers understand whether the upcoming slate leans toward short runs, mid-size seasons, or longer series.
- Fresh Releases by Title: This chart lists fresh releases by title. It helps teams keep upcoming launches visible for editorial, marketing, and platform planning.
3. Audience Platform Analysis
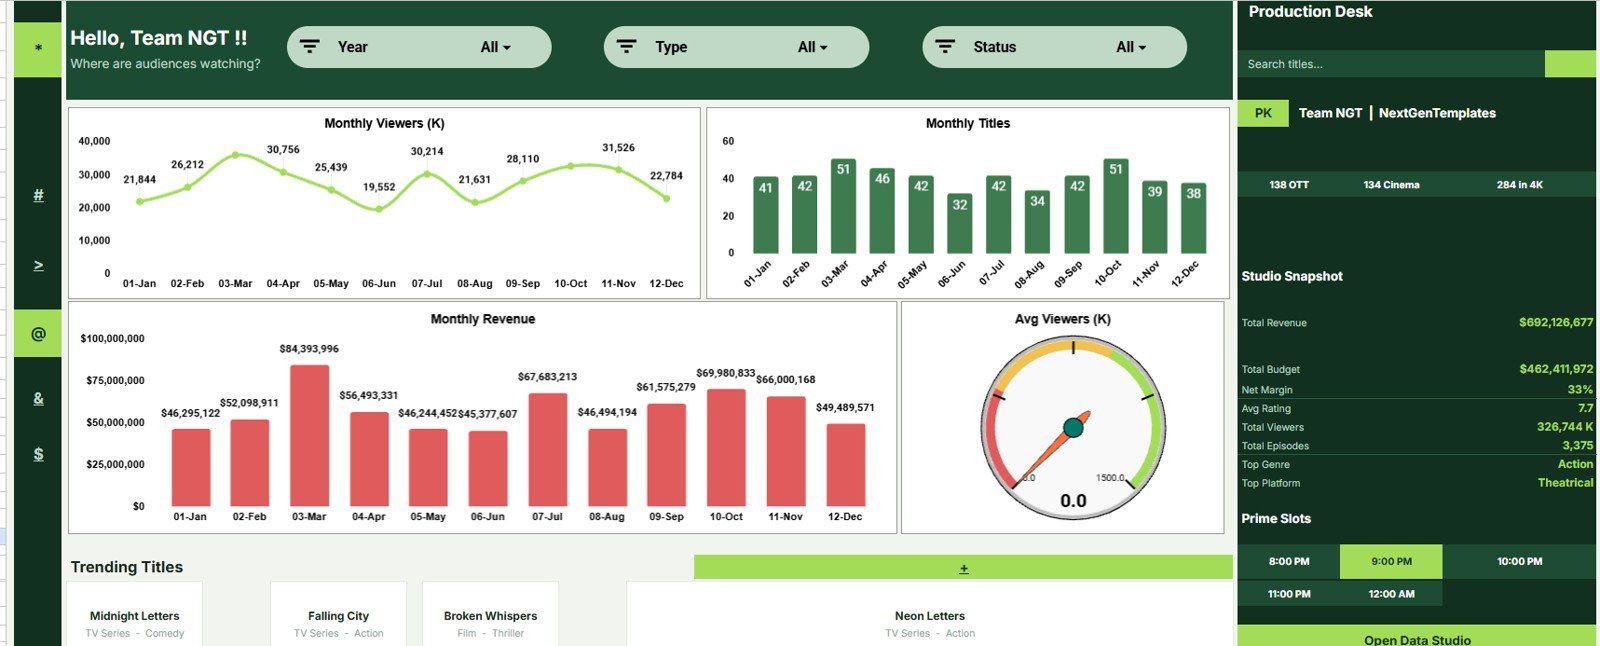
The Audience Platform Analysis tab is built for reviewing how viewers, titles, and revenue behave across platform strategy. It helps users compare streaming, broadcast, theatrical, and other distribution channels from the same source data.
- Monthly Viewers by Month: This chart shows audience volume by month. It helps teams identify when platform demand is rising or falling.
- Monthly Titles by Month: This chart compares title availability across months. It helps users check whether catalog volume supports viewer demand.
- Monthly Revenue by Month: This chart tracks platform revenue trends over time. It helps commercial teams review whether audience growth is converting into revenue.
- Average Viewers by Viewer Range: This chart groups titles by viewer range. It helps analysts see whether performance is concentrated in a small set of hits or spread across the catalog.
- Trending Titles by Title: This chart highlights titles with strong viewer movement. It helps programming and marketing teams decide where to focus attention.
4. Audience Segment Analysis
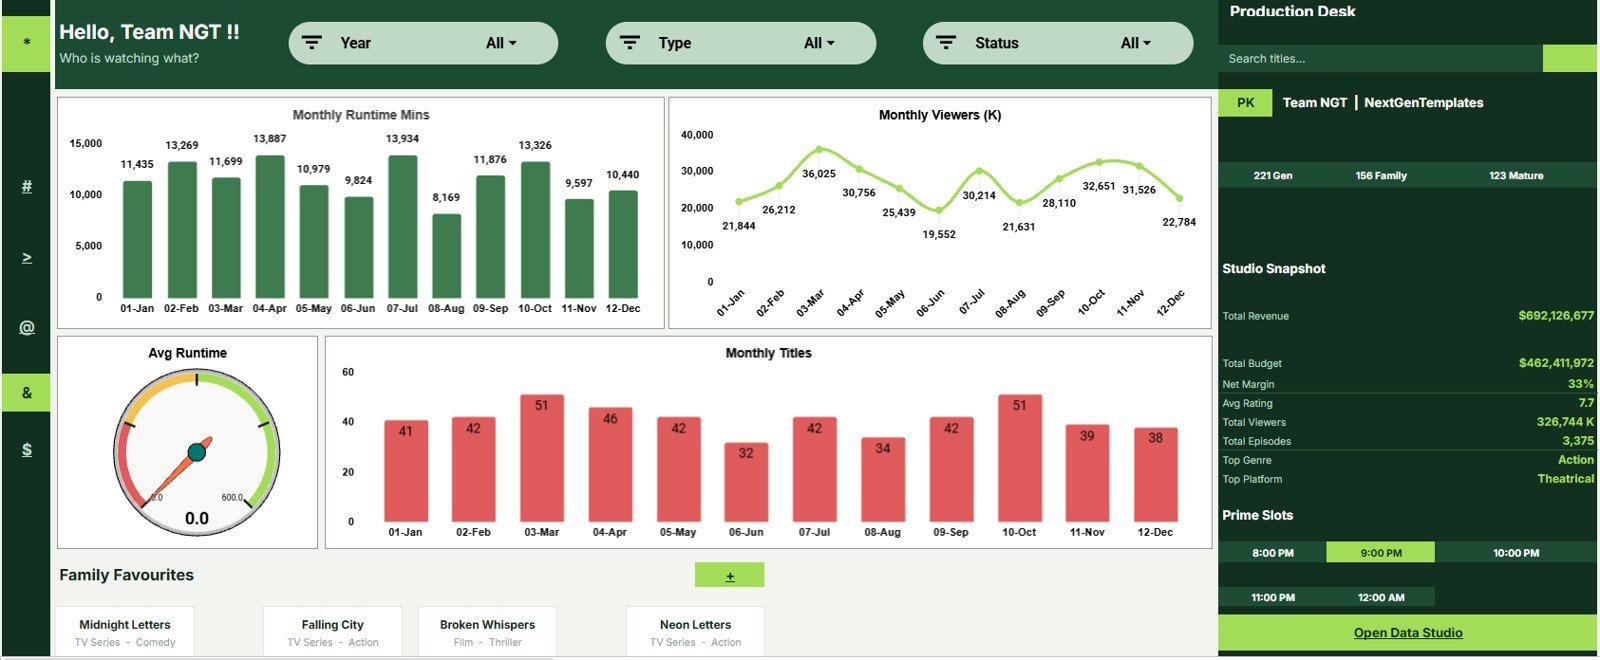
The Audience Segment Analysis tab helps teams understand how runtime, viewer activity, and title mix behave by audience segment. It is useful for family, genre, demographic, and content-fit reviews.
- Monthly Runtime Mins by Month: This chart shows runtime minutes by month. It helps content teams review whether the audience receives enough watchable volume.
- Monthly Viewers by Month: This chart tracks viewer activity across months. It helps segment owners spot audience momentum and slower periods.
- Average Runtime by Runtime Range: This chart groups titles by runtime range. It helps teams compare short-form, standard, and long-form content mix.
- Monthly Titles by Month: This chart shows how many titles appear each month. It helps planners align segment supply with audience demand.
- Family Favourites by Title: This chart surfaces family-friendly titles with strong performance. It helps teams plan promotions, recommendations, and seasonal programming.
5. Financial Slate Analysis
The Financial Slate Analysis tab brings viewer movement, monthly revenue, monthly budget, and title-level earnings into one financial review page. It is useful for production finance, executive reporting, and slate planning.
- Monthly Viewers by Month: This chart tracks viewer movement beside financial context. It helps teams compare audience size with budget and revenue results.
- Monthly Revenue by Month: This chart shows revenue by month. It helps finance leads identify strong months and investigate slower periods.
- Monthly Budget by Month: This chart compares budget by month. It helps teams see when spending is concentrated and whether it aligns with major releases.
- Top Earners by Title: This chart ranks titles by revenue contribution. It helps executives identify which titles carry the strongest commercial value.
6. Data Sheet Tab
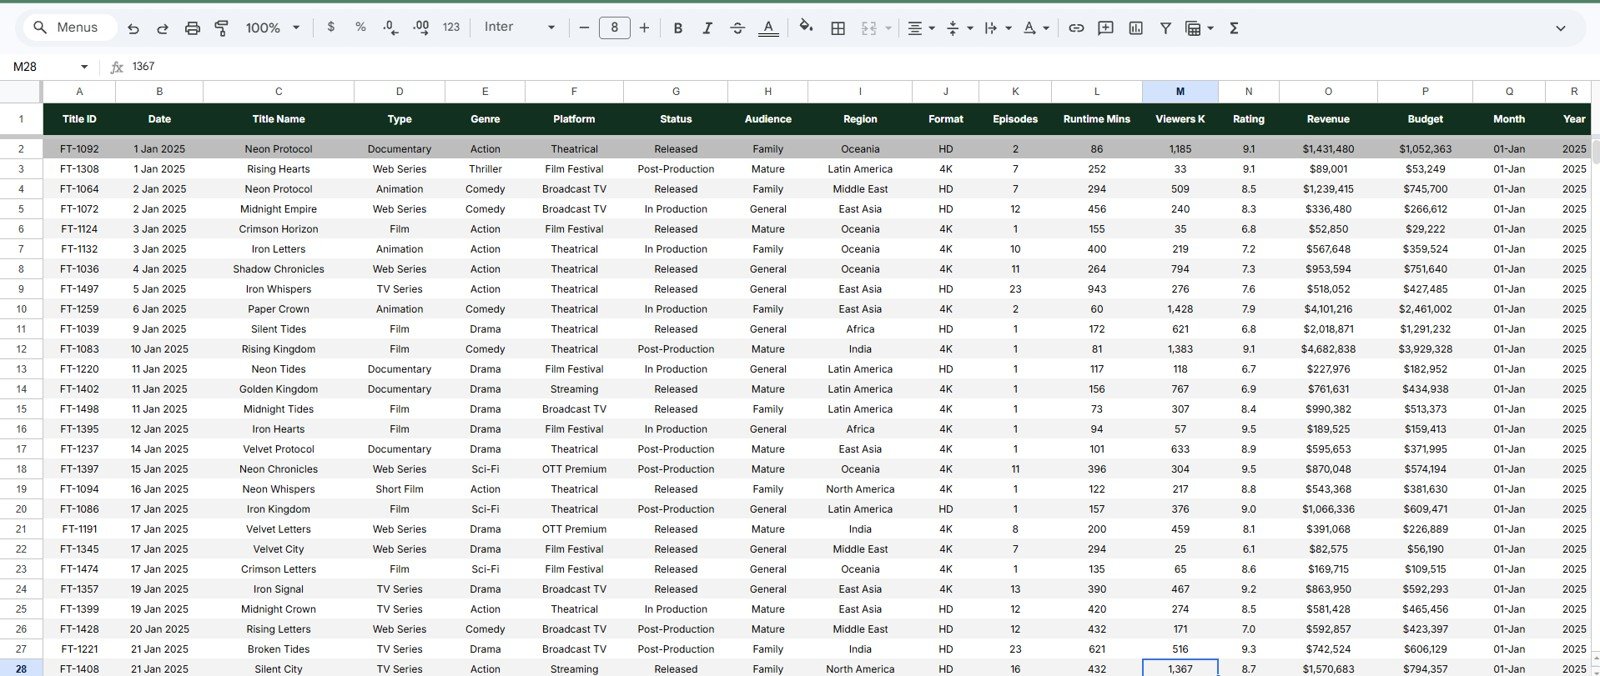
The Data Sheet tab is the source layer for the dashboard. Add the data in the same format shown in the sample file so cards, slicers, and charts continue to group titles correctly.
Film and Television Dashboard in Google Sheets vs. Excel Dashboard vs. Paid CRM/SaaS – Feature Comparison
| Feature | This Google Sheets Dashboard | Microsoft Excel Dashboard | Paid Production SaaS |
|---|---|---|---|
| Cost | $9.99 sale price | Template cost plus Excel access | Recurring subscription or seat cost |
| Platform | Google Sheets in browser | Excel desktop or web | Vendor cloud platform |
| Setup time | Copy the file and replace sample data | Open workbook and replace data | Implementation and onboarding vary |
| Real-time team collaboration | Native Google Drive sharing | Available with Microsoft cloud sharing | Usually included by plan |
| Mobile access | Google Sheets app or browser | Excel app or browser | Vendor app or browser |
| Customizable fields | Editable sheet structure | Editable workbook structure | Limited by vendor configuration |
| Share with link | Yes, with owner-controlled permissions | Yes, with compatible cloud storage | Usually account based |
| Year-1 cost at 5 users | $9.99 template price | Depends on existing licenses | Often hundreds or thousands per year |
| Film and TV title analysis | Built around titles, viewers, budgets, revenue, ratings, episodes, and platforms | Possible with custom setup | Varies by product module |
Who Should Use This Template
- Film studios and independent production teams tracking title-level performance.
- Television networks reviewing episodes, slots, ratings, and viewer trends.
- Streaming content teams comparing title availability, viewer ranges, and now-streaming records.
- Distribution and licensing teams reviewing platform-level revenue and demand.
- Production finance teams comparing monthly budget, revenue, margin, and top earners.
- Media consultants who need a shareable reporting layer for client discussions.
Real-World Use Cases
Nina, content strategy manager: starts each weekly meeting on the Overview Page, then opens Audience Platform Analysis to explain why certain titles are trending across viewer ranges.
Arjun, production finance lead: reviews the Financial Slate Analysis page before month-end reporting so he can compare budget pressure, monthly revenue, viewer movement, and top earners.
Maya, distribution analyst: filters the dashboard by platform and release timing before preparing a licensing recap for a regional partner.
Advantages of Film and Television Dashboard in Google Sheets
- Lower reporting friction: Teams can work from one editable file instead of rebuilding charts from scattered exports.
- Fast review structure: The page split mirrors common media workflows: overview, releases, platforms, segments, financials, and data.
- Easy collaboration: Google Sheets makes browser-based sharing practical for distributed media teams. Review Google Drive access settings before sharing sensitive data.
- Title-level visibility: The dashboard keeps individual titles visible alongside monthly and range-based trends.
- No template subscription: Buy the template once and use it from your own Google Drive copy.
Opportunities for Improvement
This dashboard is intentionally spreadsheet-based, so it does not include automatic streaming platform connectors, rights management workflows, or production schedule automation. Teams with live platform APIs, royalty accounting, multi-currency finance systems, or enterprise content operations may eventually need a data warehouse or specialized media SaaS. For many small and mid-sized media teams, though, this template is a practical first reporting layer.
Best Practices
- Keep the Data Sheet column order consistent before adding new records.
- Use one naming convention for titles, platforms, genres, audience segments, and release status.
- Check blank dates, duplicate title names, unusual budgets, and outlier viewer counts before review meetings.
- Separate final reporting copies from working copies if several team members are editing at the same time.
- Use Google Drive permissions carefully. Google’s document sharing guide explains how access settings affect who can view or edit files.
Explore Relevant Templates
- Film and Television KPI Dashboard in Excel
- Arts and Culture Dashboard in Google Sheets
- Advertising Dashboard in Google Sheets
- Digital Comic Startups Dashboard in Power BI
- Browse the Google Sheets templates and Google Sheets dashboard templates collections.
If you would like to build dashboards like this yourself, the Excel Pivot Tables & Dashboards course on NextGenTemplates Academy is a good place to start, and it comes with practice files.
Get the Film and Television Dashboard in Google Sheets
Frequently Asked Questions
Is the Film and Television Dashboard built in Google Sheets?
Yes. It is a Google Sheets dashboard template that you copy into your own Google Drive and edit there.
What pages are included?
The template includes Overview, Next Releases Analysis, Audience Platform Analysis, Audience Segment Analysis, Financial Slate Analysis, and Data Sheet tabs.
Can I replace the sample data?
Yes. Add your own film and television records in the Data Sheet tab while keeping the same format so the charts and slicers continue to work.
Does it include automatic streaming platform connections?
No. This version is a spreadsheet dashboard template. You can paste or import exported data, but automated API connectors are not included.
Can my team collaborate on the dashboard?
Yes. After copying the file into Google Drive, you can share it with viewer, commenter, or editor permissions based on your workflow.
Who is this dashboard best for?
It is best for studios, broadcasters, streamers, distributors, production finance teams, content strategists, and media analysts who need editable title-level reporting.
About the Author
Built by PK – Microsoft Certified Professional with 15+ years of Excel, Google Sheets, and Power BI experience. Founder of NextGenTemplates, reaching 300K+ subscribers across YouTube channels. Every template is hand-built and tested before release.
Conclusion
The Film and Television Dashboard in Google Sheets gives media teams a focused way to track catalog performance, upcoming releases, platform trends, audience segments, and financial slate movement in one editable workbook. If your team is still comparing title data across separate exports, this template gives you a faster reporting base for recurring reviews.
Instant download. One-time payment. No template subscription.
Last updated: July 28, 2026.