Daily Production Output Tracker in Google Sheets is a ready-to-use production reporting template for manufacturers, plant supervisors, operations managers, quality teams, and production planners who need one place to monitor daily units, targets, efficiency, rejects, shifts, lines, products, operators, and status values.Daily Production Output Tracker in Google Sheets
Even a small production team can create dozens of daily entries across shifts, lines, operators, and products. When those updates sit in separate files or informal messages, the daily review meeting becomes slower than it should be. This Google Sheets tracker focuses on the operating numbers that matter first: total units produced, target quantity, actual quantity, efficiency percentage, rejects, and production runs by shift.
The template includes 2 main pages, 4 production charts, 5 controlled list groups, and a clean overview page for fast review. It is designed for teams that want a lightweight Google Sheets template before they invest in a heavier MES, ERP, or manufacturing SaaS system.
Get the Daily Production Output Tracker in Google Sheets from NextGenTemplates
For teams sharing spreadsheet work across users, Google explains how Sheets supports collaboration, filters, and filter views in its official help documentation: Collaborate in Sheets – Google Docs Editors Help.
Get the Daily Production Output Tracker in Google Sheets
Key Features of Daily Production Output Tracker in Google Sheets
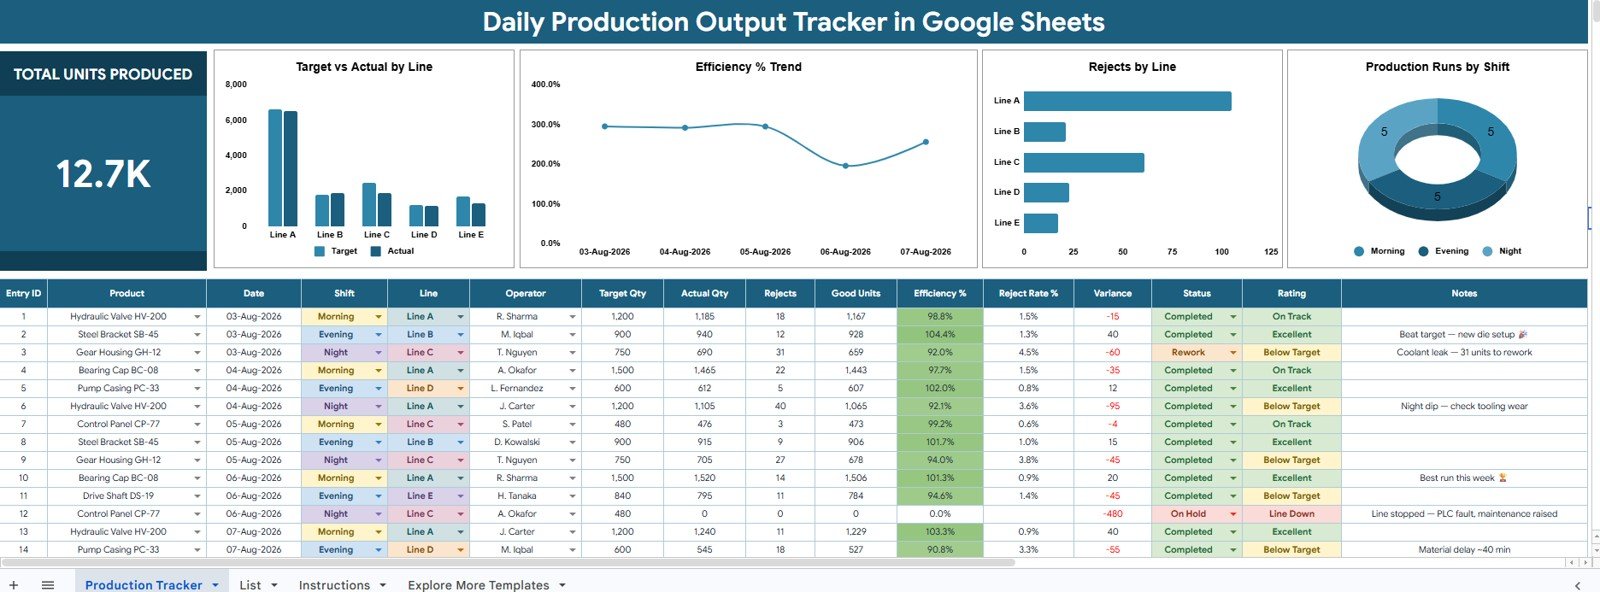
- Overview dashboard: A main page that summarizes production output and charts the most important daily manufacturing metrics.
- Total Units Produced card: A high-level card that gives managers an immediate view of the production volume captured in the tracker.
- Target vs actual tracking: Compare target quantity and actual quantity by production line to see where the team is ahead or behind.Daily Production Output Tracker in Google Sheets
- Efficiency trend: Review efficiency percentage by date to understand whether performance is improving, stable, or slipping.Daily Production Output Tracker in Google Sheets
- Rejects analysis: Track rejects by line so quality issues are visible without waiting for month-end reporting.Daily Production Output Tracker in Google Sheets
- Shift analysis: Review production runs by shift to compare workload, staffing, and output timing.
- List tab controls: Standardize shift, line, product, operator, and status dropdown options.
- Google Sheets format: Share the file, customize fields, update list values, and collaborate through Drive permissions.
Dashboard Pages Explanation
1. Overview Page
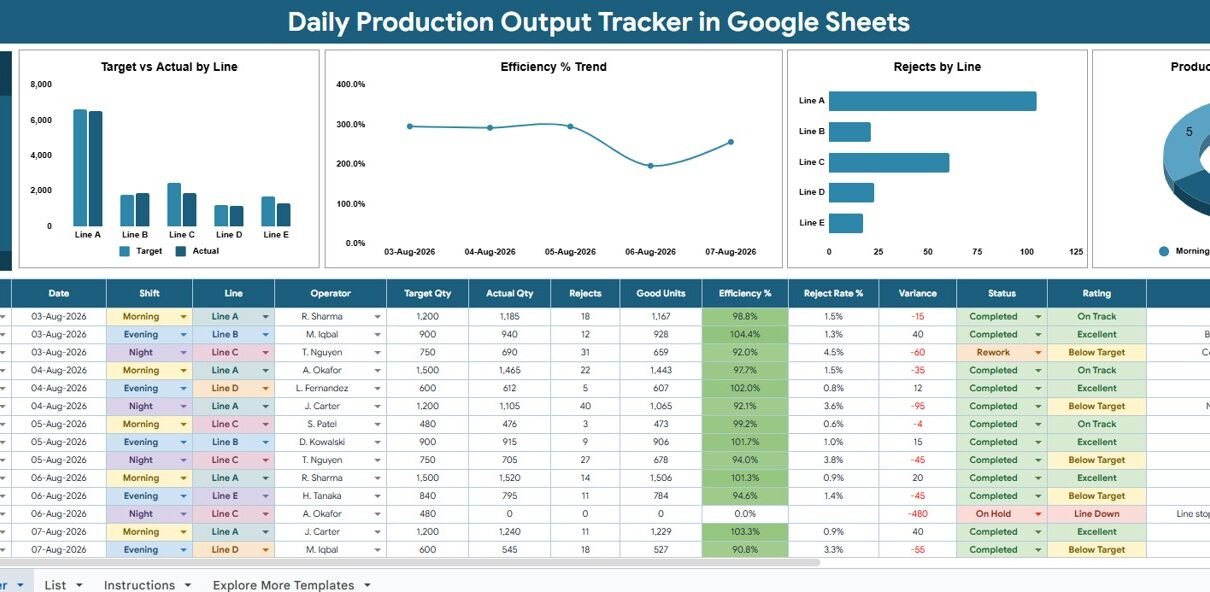
The Overview Page is the main dashboard for daily production review. It places the Total Units Produced card at the top and then uses four charts to explain line performance, daily efficiency, rejected units, and shift workload.
Total Units Produced: This card shows the overall production volume captured in the tracker. It is the first number a production manager can review before moving into detailed chart analysis.
Target Qty and Actual Qty by Line
This chart compares planned quantity against actual quantity for every production line. A line that repeatedly misses target becomes easy to identify during daily review.
Supervisors can use the comparison to discuss staffing, machine availability, changeovers, material shortages, or product complexity without searching through raw entries.Daily Production Output Tracker in Google Sheets
Efficiency % by Date
This chart shows how efficiency changes from date to date. It helps managers see whether performance is consistent or if a specific day needs deeper investigation.Daily Production Output Tracker in Google Sheets
When efficiency drops, the team can connect the trend to rejects, shift coverage, product mix, or downtime notes and take action before the same issue repeats.
Rejects by Line
This chart summarizes rejected units by production line. It is useful for quality managers who need to know whether defects are spread across the plant or concentrated in one area.
Line-level reject visibility supports focused corrective action such as operator retraining, machine adjustment, raw material review, or inspection changes.
Production Runs by Shift
This chart counts production runs by shift so managers can compare workload across working periods. It reveals whether one shift is carrying more starts, completions, or interruptions than another.
Shift analysis can support better scheduling, staffing decisions, handover discipline, and supervision during high-volume periods.
2. List Tab
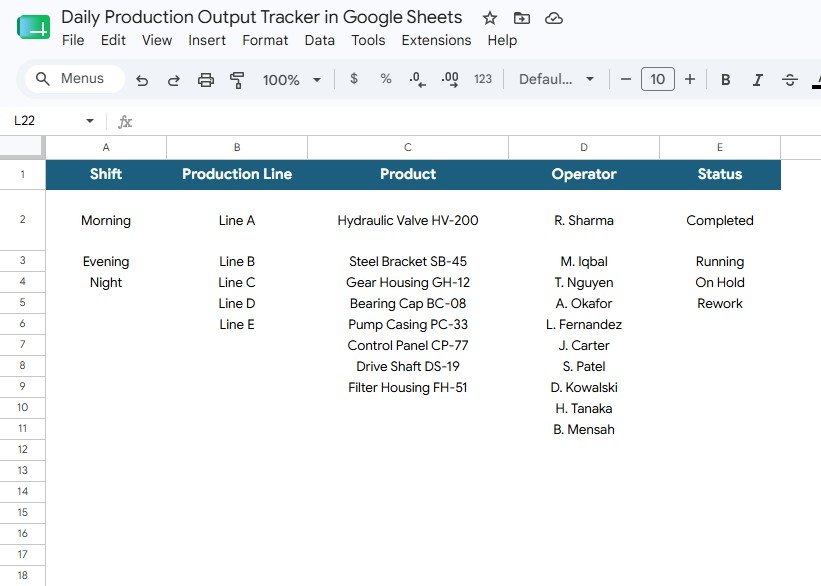
The List Tab keeps dropdown values consistent across the tracker. Instead of allowing users to type different spellings for the same shift, line, product, operator, or status, the list area gives the team a standard controlled set of options.
Shift Options by List Tab
Shift options define the working periods used in the tracker. You can keep standard values such as Morning, Evening, and Night or replace them with your own plant shift structure.
Production Line Options by List Tab
Production line options standardize line names. This matters because the overview charts depend on consistent line values to compare output, targets, and rejects correctly.Daily Production Output Tracker in Google Sheets
Product Options by List Tab
Product options keep item names clean. Standard product names reduce duplicate labels and make production reporting more reliable when several operators enter data.
Operator Options by List Tab
Operator options support accountability and review. The list helps managers connect entries to responsible team members while reducing manual spelling errors.
Status Options by List Tab
Status options keep record progress consistent. Values such as Completed, In Progress, On Hold, and Rejected can be adjusted to match the language used by your production team.
Daily Production Output Tracker in Google Sheets vs. Microsoft Excel Tracker vs. Paid Manufacturing SaaS – Feature Comparison
| Feature | This template | Microsoft Excel tracker | Paid manufacturing SaaS |
|---|---|---|---|
| Cost | $6.99 one-time sale price | Low license cost, but internal build time | Recurring monthly or annual subscription |
| Platform | Google Sheets | Desktop or cloud Excel | Vendor-hosted web app |
| Setup time | Copy file, edit lists, enter data | Build formulas and charts manually | Vendor setup and onboarding |
| Real-time team collaboration | Supported through Google Sheets sharing | Depends on OneDrive, SharePoint, and version control | Usually included by plan |
| Mobile access | Google Sheets app or browser | Excel mobile or browser | Usually browser or mobile app |
| Customizable fields | Editable list tab and sheets | Highly editable but easy to break formulas | Depends on vendor configuration |
| Share with link | Yes, with Drive permissions | Yes, with cloud storage permissions | Usually account based |
| Year-1 cost at 5 users | $6.99 template price | Internal setup and maintenance time | Often much higher due to per-user pricing |
| Line-level production review | Built around target, actual, rejects, and efficiency | Requires custom build | Usually available in manufacturing systems |
| Best use case | Daily shop-floor tracking and review | Offline or highly custom single-user files | Broader ERP, MES, or multi-site workflows |
Who Should Use This Template
This template is a fit for production supervisors, operations heads, plant managers, quality control leads, manufacturing planners, and business owners who need a simple daily production tracker. It works well for small and mid-sized manufacturing teams that want cleaner visibility without introducing a large system.
It is also useful for consultants and analysts who prepare daily, weekly, or monthly production reports for a client or internal leadership team. Because the template is in Google Sheets, the structure is easy to review, adapt, and share.
Real-World Use Cases
Ravi manages Line 2 in a packaging plant. Every evening he checks the target vs actual chart and sees whether the shortfall belongs to one line or the entire shift. That helps him discuss the right issue in the next production meeting.
Anita leads quality review in a fabrication shop. She uses Rejects by Line to decide where to inspect first. Instead of reading every row, she starts with the line that has the highest reject count.
Marco prepares weekly operations reporting. He uses Efficiency % by Date to show leadership which dates performed well and which dates need root-cause analysis.
Advantages of Daily Production Output Tracker in Google Sheets
- Fast daily visibility: The overview page turns raw production data into a quick operating summary.
- Cleaner data entry: The List Tab reduces inconsistent shift, line, product, operator, and status values.
- Lower tool cost: A one-time template can be enough before moving to a larger manufacturing system.
- Flexible structure: Google Sheets makes it easy to adjust labels, lists, rows, and reporting logic.
- Team-friendly access: Shared Google Sheets files can be used by multiple team members with controlled permissions.
Opportunities for Improvement
Teams that need barcode scanning, machine data capture, ERP posting, automated material consumption, work-order routing, or advanced production planning may need a larger system or custom development. This template is focused on daily production output tracking, not full shop-floor automation.Daily Production Output Tracker in Google Sheets
Some teams may also want to add downtime reasons, rework categories, planned hours, actual hours, product family, customer, or supervisor approval fields. Those are logical extensions if your production review becomes more detailed over time.
Best Practices
- Update the List Tab before entering production data so every user works with the same shift, line, product, operator, and status values.
- Keep product names short and consistent because charts are easier to read when labels are clean.
- Review rejects daily, not only at month end, so quality issues are caught early.
- Use the same efficiency calculation method every day to avoid misleading trends.
- Lock formula cells or protect tabs if several users will enter data.
- Use Google Sheets sharing permissions carefully so editors, viewers, and owners have the right access.
Explore Relevant Templates
- Production Planning Dashboard in Google Sheets
- Manufacturing KPI Dashboard in Google Sheets
- Manufacturing Dashboard in Google Sheets
- Manufacturing Incentive Dashboard and Tracker in Google Sheets
- Production Tracking and Dispatch Management System
Browse more Google Sheets trackers from NextGenTemplates.Daily Production Output Tracker in Google Sheets
To see how trackers like this are put together, the NextGenTemplates Academy learning paths offer step-by-step lessons with practice files.
Get the Daily Production Output Tracker in Google Sheets
Frequently Asked Questions
What is included in the Daily Production Output Tracker in Google Sheets?
It includes an Overview Page with a Total Units Produced card and four charts, plus a List Tab for shift, production line, product, operator, and status options.
Which charts are included?
The tracker includes Target Qty and Actual Qty by Line, Efficiency % by Date, Rejects by Line, and Production Runs by Shift.Daily Production Output Tracker in Google Sheets
Can I customize the dropdown lists?
Yes. The List Tab is built for customization. You can edit shift names, line names, product options, operator values, and status labels.Daily Production Output Tracker in Google Sheets
Is this template only for factories?
It is designed for manufacturing and production teams, but any team that tracks daily output against target can adapt it.
Can multiple users work in the same tracker?
Yes, the file is built in Google Sheets, so collaboration depends on your Google Drive sharing permissions and team workflow.
Does this replace ERP or MES software?
No. It is a lightweight production tracker. ERP, MES, barcode scanning, and machine integration are outside the visible scope of the template.Daily Production Output Tracker in Google Sheets
About the Author
Built by PK – Microsoft Certified Professional with 15+ years of Excel, Google Sheets, and Power BI experience. Founder of NextGenTemplates, reaching 300K+ subscribers across YouTube channels. Every template is hand-built and tested before release.Daily Production Output Tracker in Google Sheets
Conclusion
The Daily Production Output Tracker in Google Sheets is a practical way to make daily production review cleaner and faster. It gives managers a high-level units-produced card, line-level target vs actual comparison, daily efficiency trend, reject analysis, shift workload chart, and controlled list values for better data quality.
If your production team needs visibility without committing to a large manufacturing platform, get the Daily Production Output Tracker in Google Sheets and adapt it for your lines, shifts, products, and operators.Daily Production Output Tracker in Google Sheets