Running a building material yard means holding two businesses in your head at once. One is a shop – a counter, a price list, walk-in customers buying two bags of cement. The other is a project supply chain – standing orders, site deliveries, kit costing, a warehouse that has to pick 4,000 units before the vans leave. Most suppliers run the first on a till and the second on a stack of spreadsheets, and the two never reconcile.
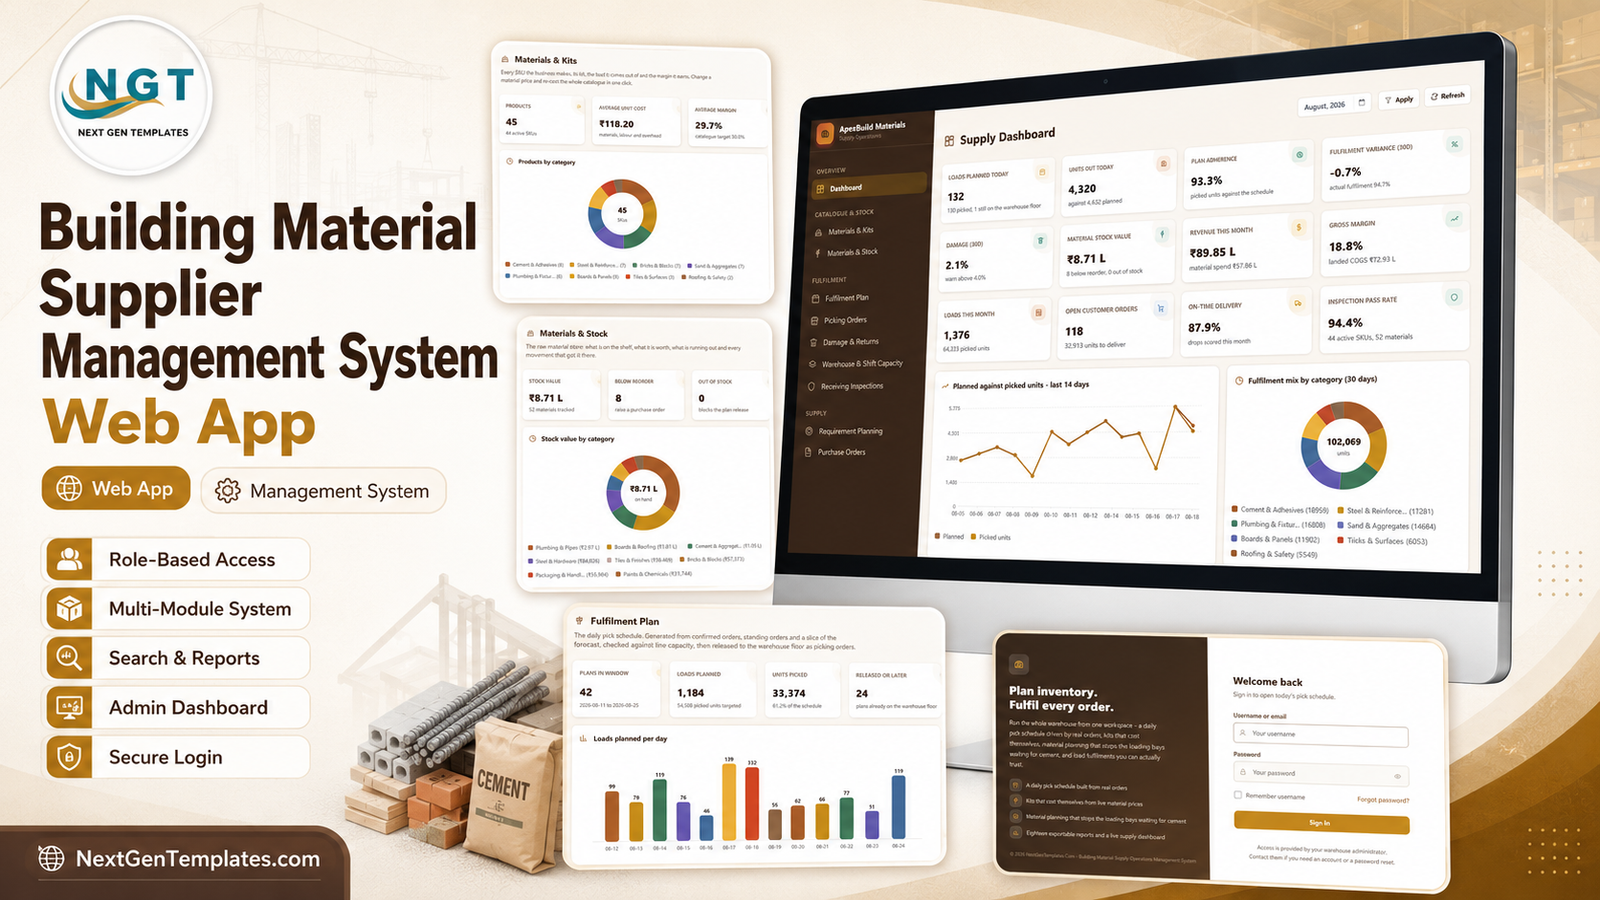
The Building Material Supplier Management System Web App puts both in one place. It is a Google Apps Script web application that stores everything in a Google Sheets database inside your own Google Drive, gives six different roles their own sign-in and their own menu, and covers the full loop: catalogue and kits, material stock, a daily pick schedule, picking orders, damage and returns, receiving inspections, requirement planning, purchase orders and goods receipts, vendors, customer orders, dispatch and routes, landed cost and margin, staff, and eighteen reports. Building Material Supplier Management System Web App
Get the Building Material Supplier Management System Web App
Try the Live Demo
A fully seeded copy of this exact system is deployed and open right now. Sign in as any role below – the dashboard, the pick plan, purchasing, dispatch and the reports are all populated with realistic data.
Demo Sign-in Details
| Role | Username | Password |
|---|---|---|
| Admin | admin | Admin@123 |
| Operations Manager | manager | Manager@123 |
| Warehouse Coordinator | warehouse | Warehouse@123 |
| Procurement Manager | procurement | Procure@123 |
| Sales Executive | sales | Sales@123 |
| Auditor | auditor | Auditor@123 |
These credentials are public on purpose. The demo is a shared, seeded instance that is periodically reset – it is nobody’s live data. Your own copy is deployed under your Google account with your own passwords, changed on first sign-in.
Why a Web App Instead of a Spreadsheet
A spreadsheet is a single surface. Everyone who opens it sees everything, edits anything, and can break a formula without knowing. That is survivable for a stock list and fatal for a business where the warehouse, the buyer and the sales counter all touch the same numbers.
A web app puts a door in front of the data. The Warehouse Coordinator sees the pick plan, the picking orders and the capacity board – and cannot open purchasing or margin at all. The Auditor can read everything operational and export it, but cannot change a single row. The Procurement Manager plans requirements and raises purchase orders but cannot approve them without an authorised approver. Every one of those boundaries is enforced on the server, not just hidden in the sidebar, and every action lands in an audit log.
The Six Roles
- Admin – every module, plus user and menu access, lists, settings, archive, backup, import and export, approvals and the audit record.
- Operations Manager – dashboard, catalogue, stock, fulfilment plans, picking orders, damage and returns, capacity, requirements, purchasing, vendors, sales orders, customers, dispatch, receiving inspections, margin, staff and reports. No user administration.
- Warehouse Coordinator – dashboard, catalogue, fulfilment plans, picking orders, damage and returns, warehouse capacity, receiving inspections, staff and reports. No purchasing, no margin.
- Procurement Manager – dashboard, material stock, requirement planning, purchase orders, goods receipts, vendors and reports.
- Sales Executive – dashboard, customer orders, customers, dispatch visibility, catalogue and reports.
- Auditor – read-only access to stock, purchasing, sales, dispatch, inspections, damage and returns, reports and the audit trail. Export allowed, edits not.
Admin can also override any non-admin user’s visible and permitted menus individually from User Management > Menu Management, so the six shipped roles are a starting point rather than a ceiling. Building Material Supplier Management System Web App
A Tour of the Screens
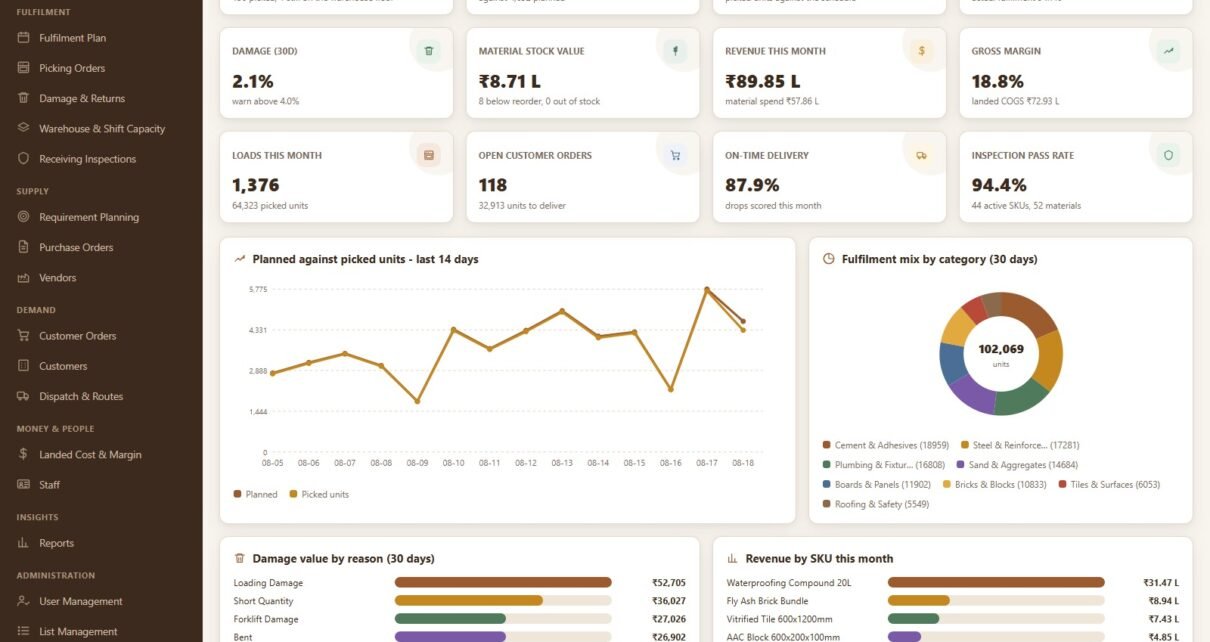
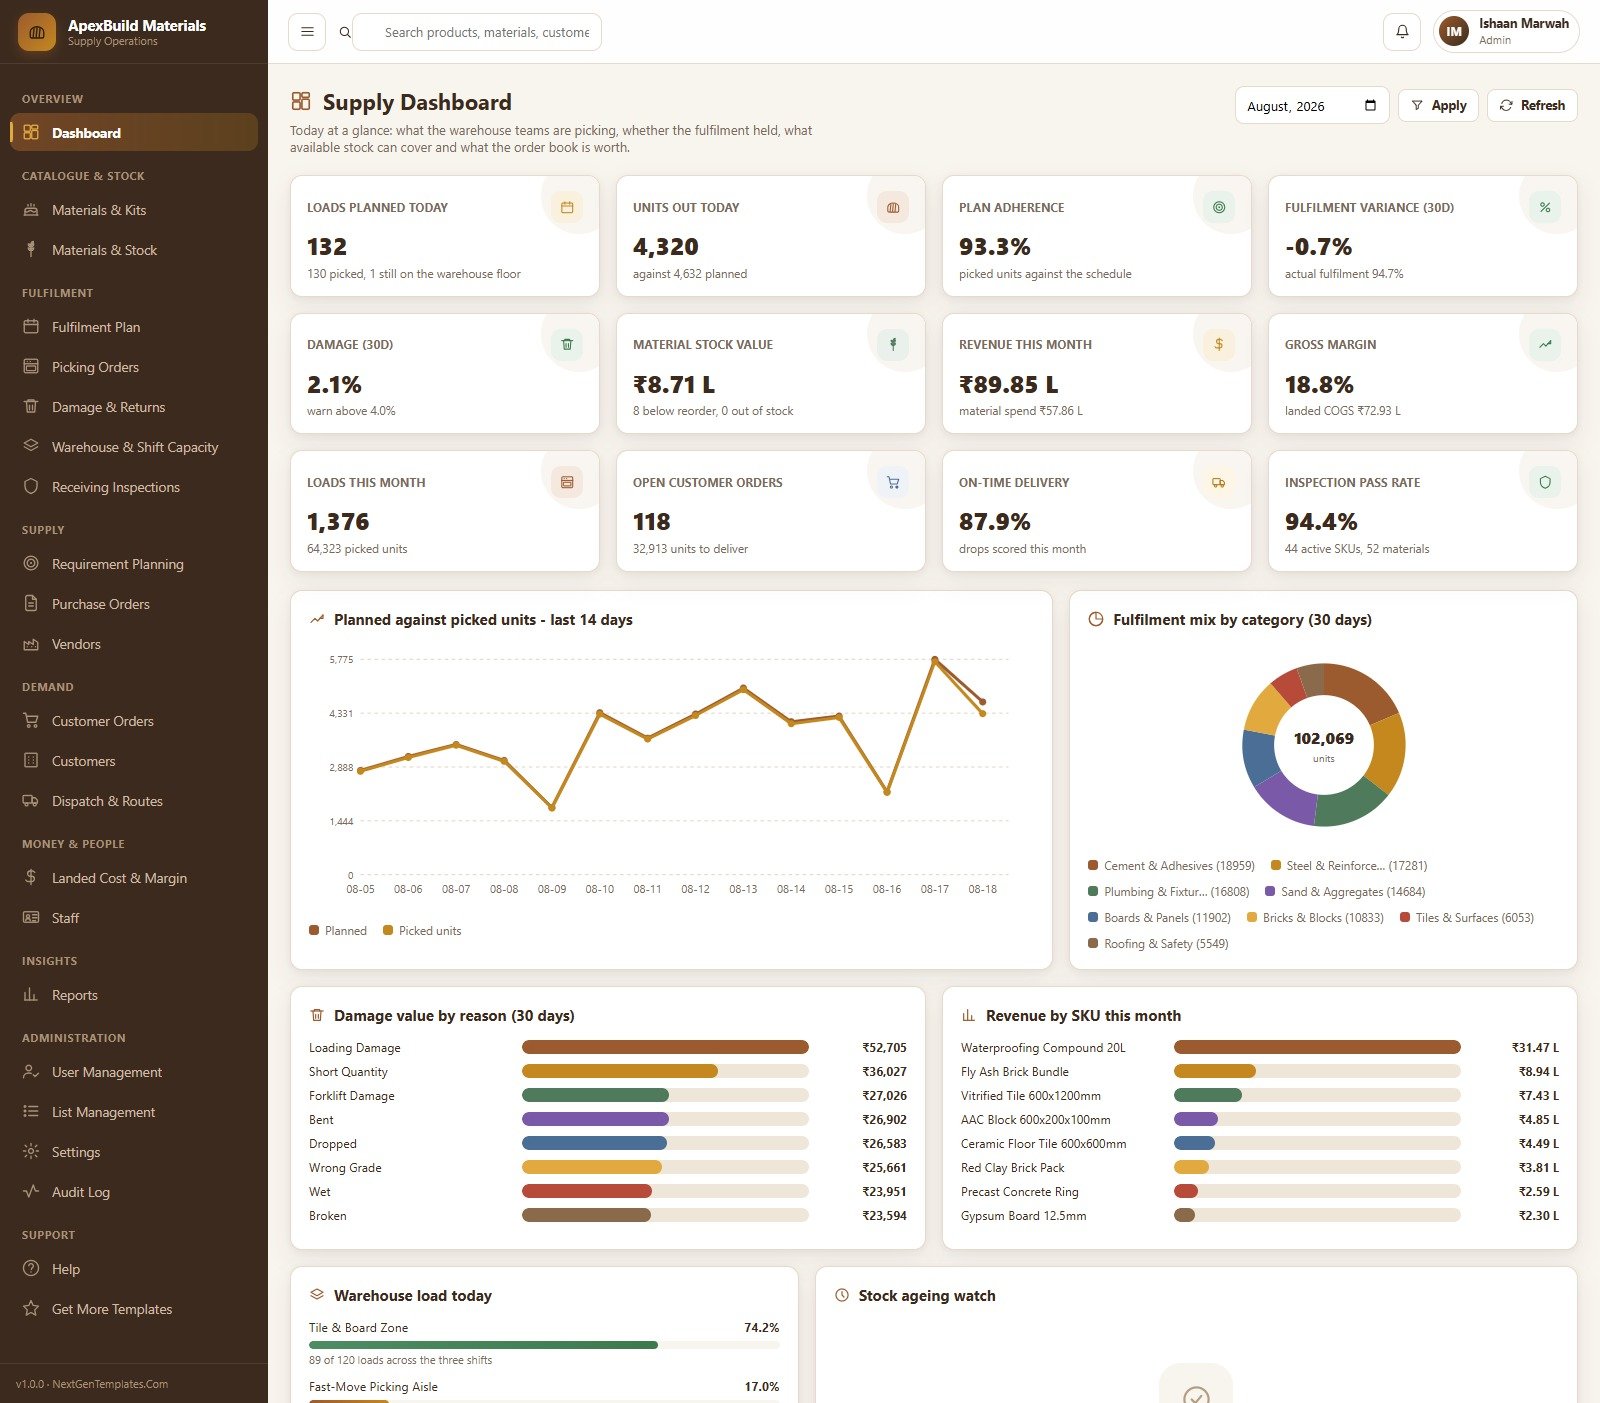
The Supply Dashboard
Twelve KPI cards sit under a month picker: loads planned today, units out today, plan adherence, fulfilment variance over 30 days, damage rate with its warning threshold, material stock value with a below-reorder count, revenue this month, gross margin against landed COGS, loads this month, open customer orders, on-time delivery and inspection pass rate. Building Material Supplier Management System Web App
Below them, planned against picked units over the last 14 days, fulfilment mix by category as a donut, damage value by reason, revenue by SKU this month, warehouse load today by zone with utilisation bars, and a stock ageing watch.
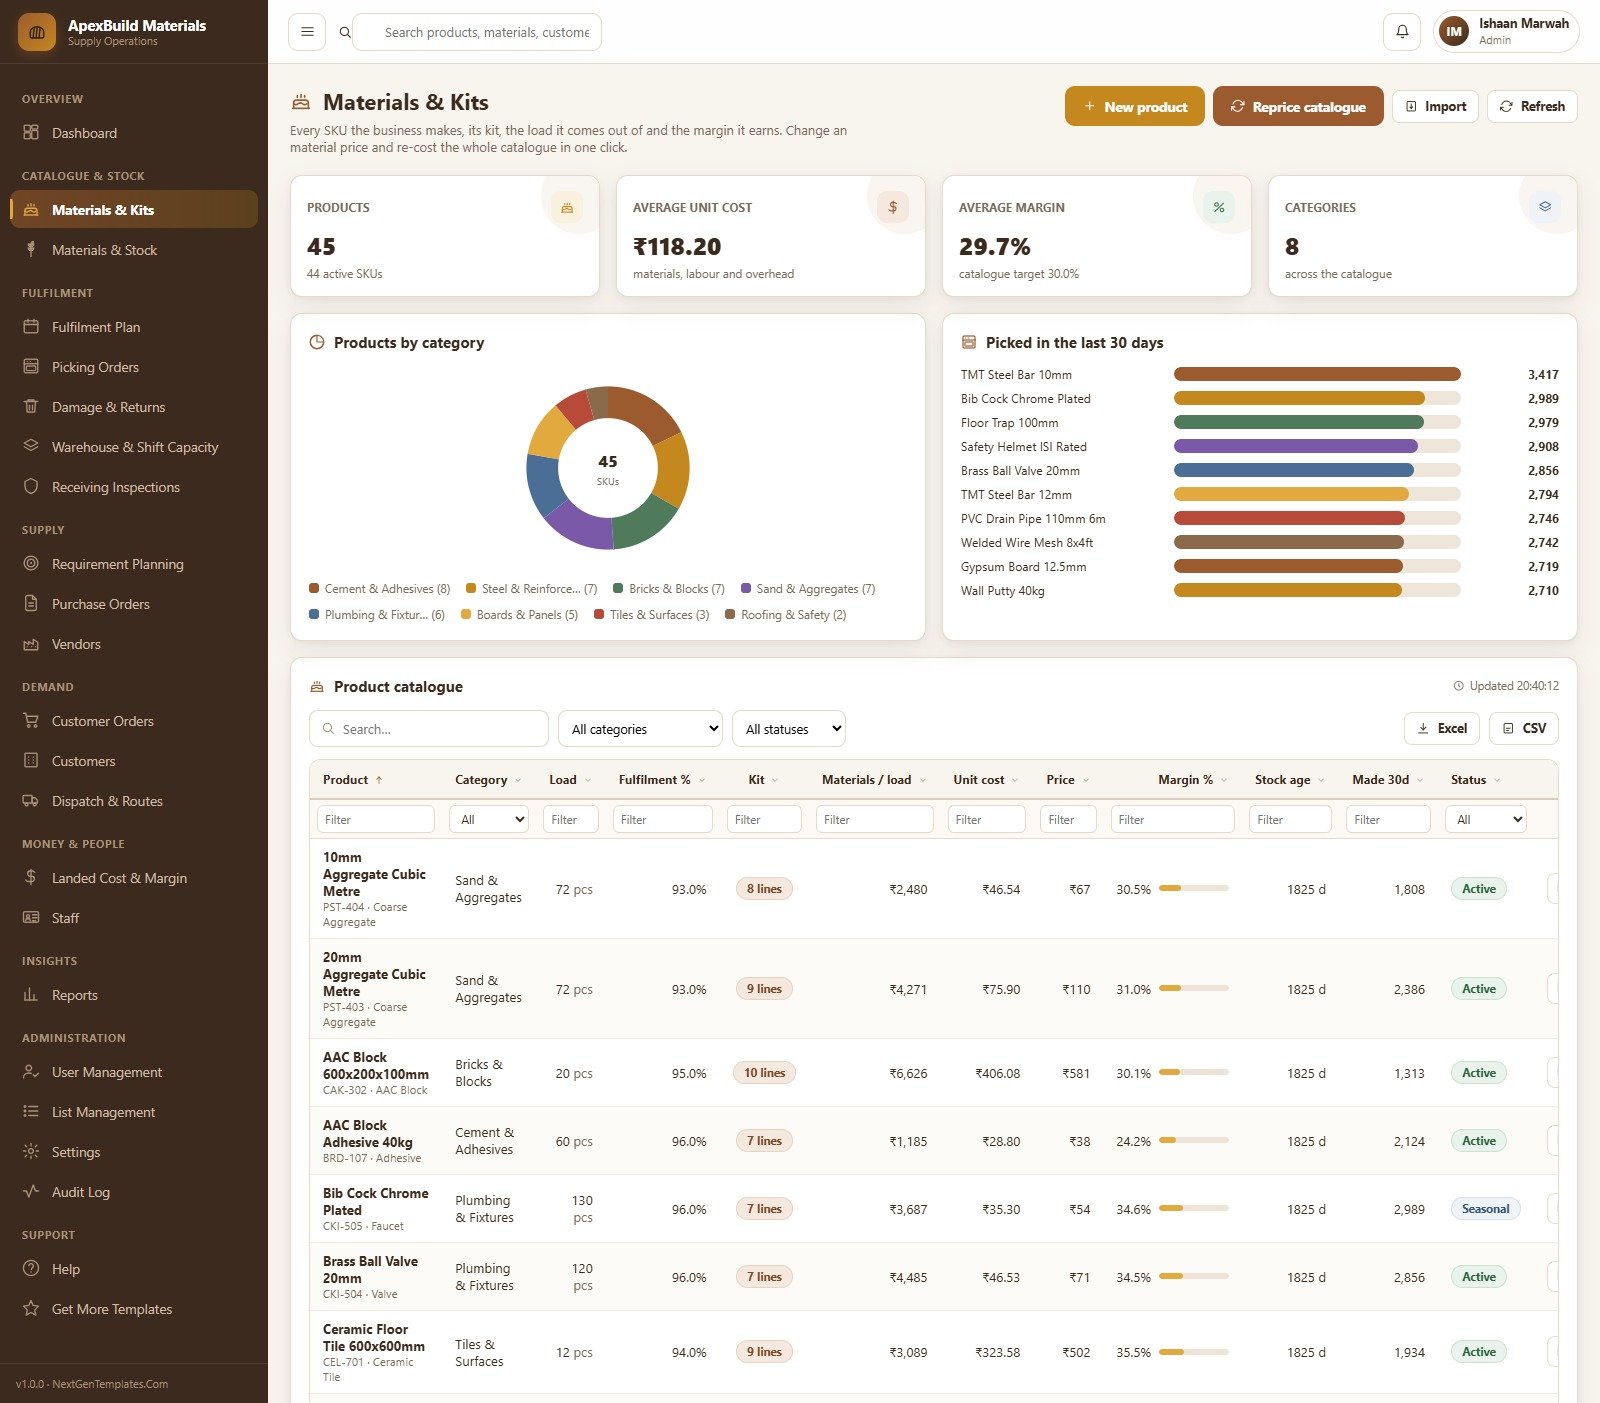
Materials & Kits
Every SKU the business sells, its kit, the load it comes out of and the margin it earns. Cards for products, average unit cost, average margin against the catalogue target and category count, then products by category and the ten most picked SKUs of the last 30 days. The catalogue table itself carries category, load size, fulfilment percentage, kit line count, materials per load, unit cost, price, margin percentage, stock age, units made in 30 days and status – every column filterable, with Excel and CSV export. Change a material price and the Reprice catalogue action re-costs the whole catalogue at once. Building Material Supplier Management System Web App
Materials & Stock
The raw material store. Stock value, materials below reorder, materials out of stock and consumption over 30 days, with stock value split by category and by storage type – covered warehouse, open yard and chemical store. The material table shows unit of measure, on hand, reorder point, days of cover, unit cost, value, vendor, storage location, usage in 30 days and a comfort state per line, so a buyer can see at a glance which lines are on watch.
Fulfilment Plan
The daily pick schedule, generated from confirmed orders, standing orders and a slice of the demand forecast, checked against line capacity, then released to the warehouse floor as picking orders. Cards for plans in the window, loads planned, units picked against the schedule and plans already released, over loads planned per day and plans by status. The schedule table lists date, shift, SKUs, loads, planned units, good units, adherence, release state and status.
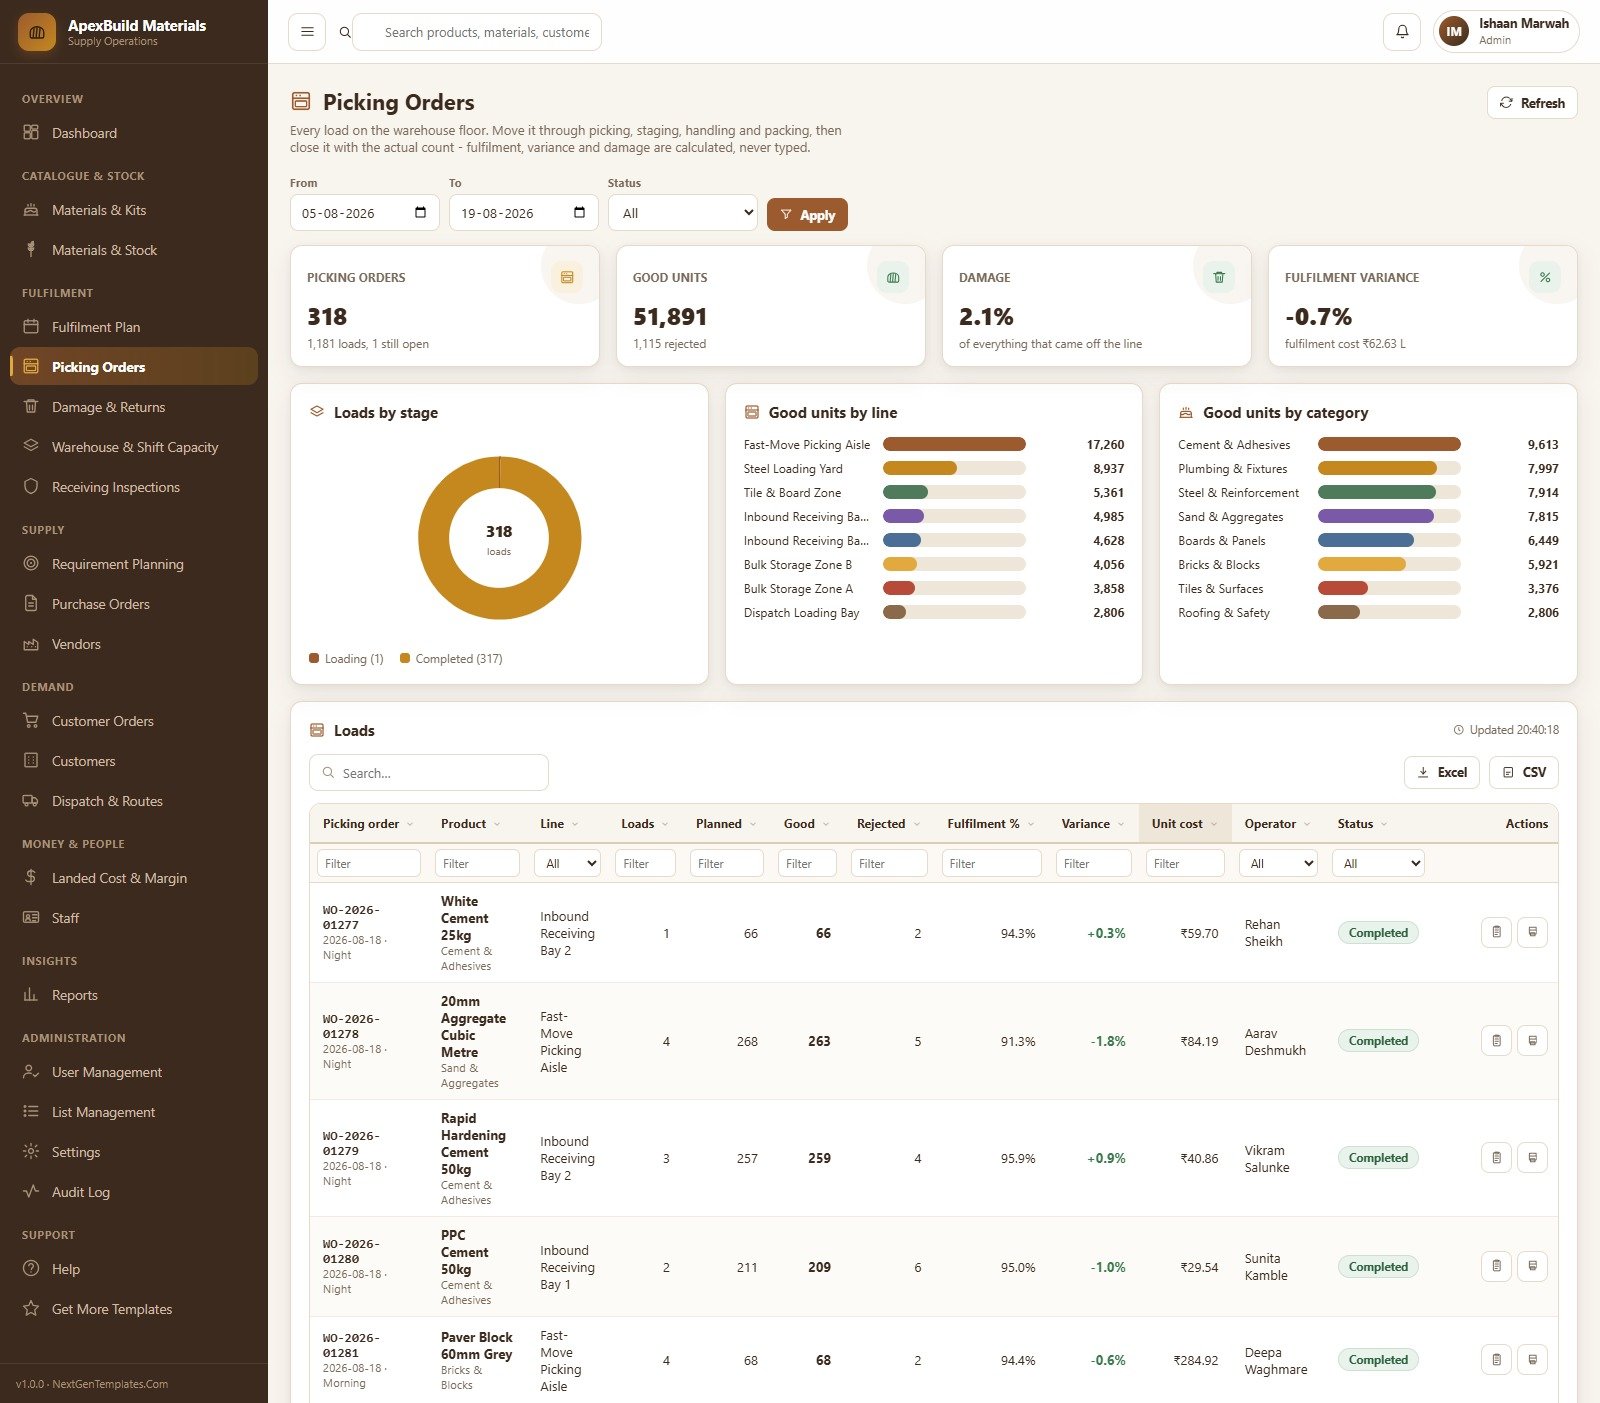
Picking Orders
Every load on the floor, moved through picking, staging, handling and packing, then closed with the actual count. Fulfilment, variance and damage are calculated from that count rather than typed. Loads by stage, good units by line and good units by category sit above a table with planned, good and rejected units, fulfilment percentage, a signed variance, unit cost and the operator who ran the load.
Requirement Planning
What the released plan will consume, against what is on the shelf and what is already on order. Materials short over the horizon, estimated spend to cover the shortfall, requirement value and materials checked, with spend needed by vendor and requirement value by category. The plan table gives required, on hand, on order, shortfall, suggested order quantity, cost, vendor, lead days and an order-by date – and the whole net shortfall becomes purchase orders in one click, or an emailed shortfall list.
Purchase Orders and Goods Receipts
What the store asked for, what turned up and what is late. Purchase order count with open orders, committed value, outstanding value and an overdue count, plus orders by status, spend by vendor and spend by month. Receiving a goods receipt puts the material straight onto the shelf through the stock ledger, so there is no separate stock adjustment step.
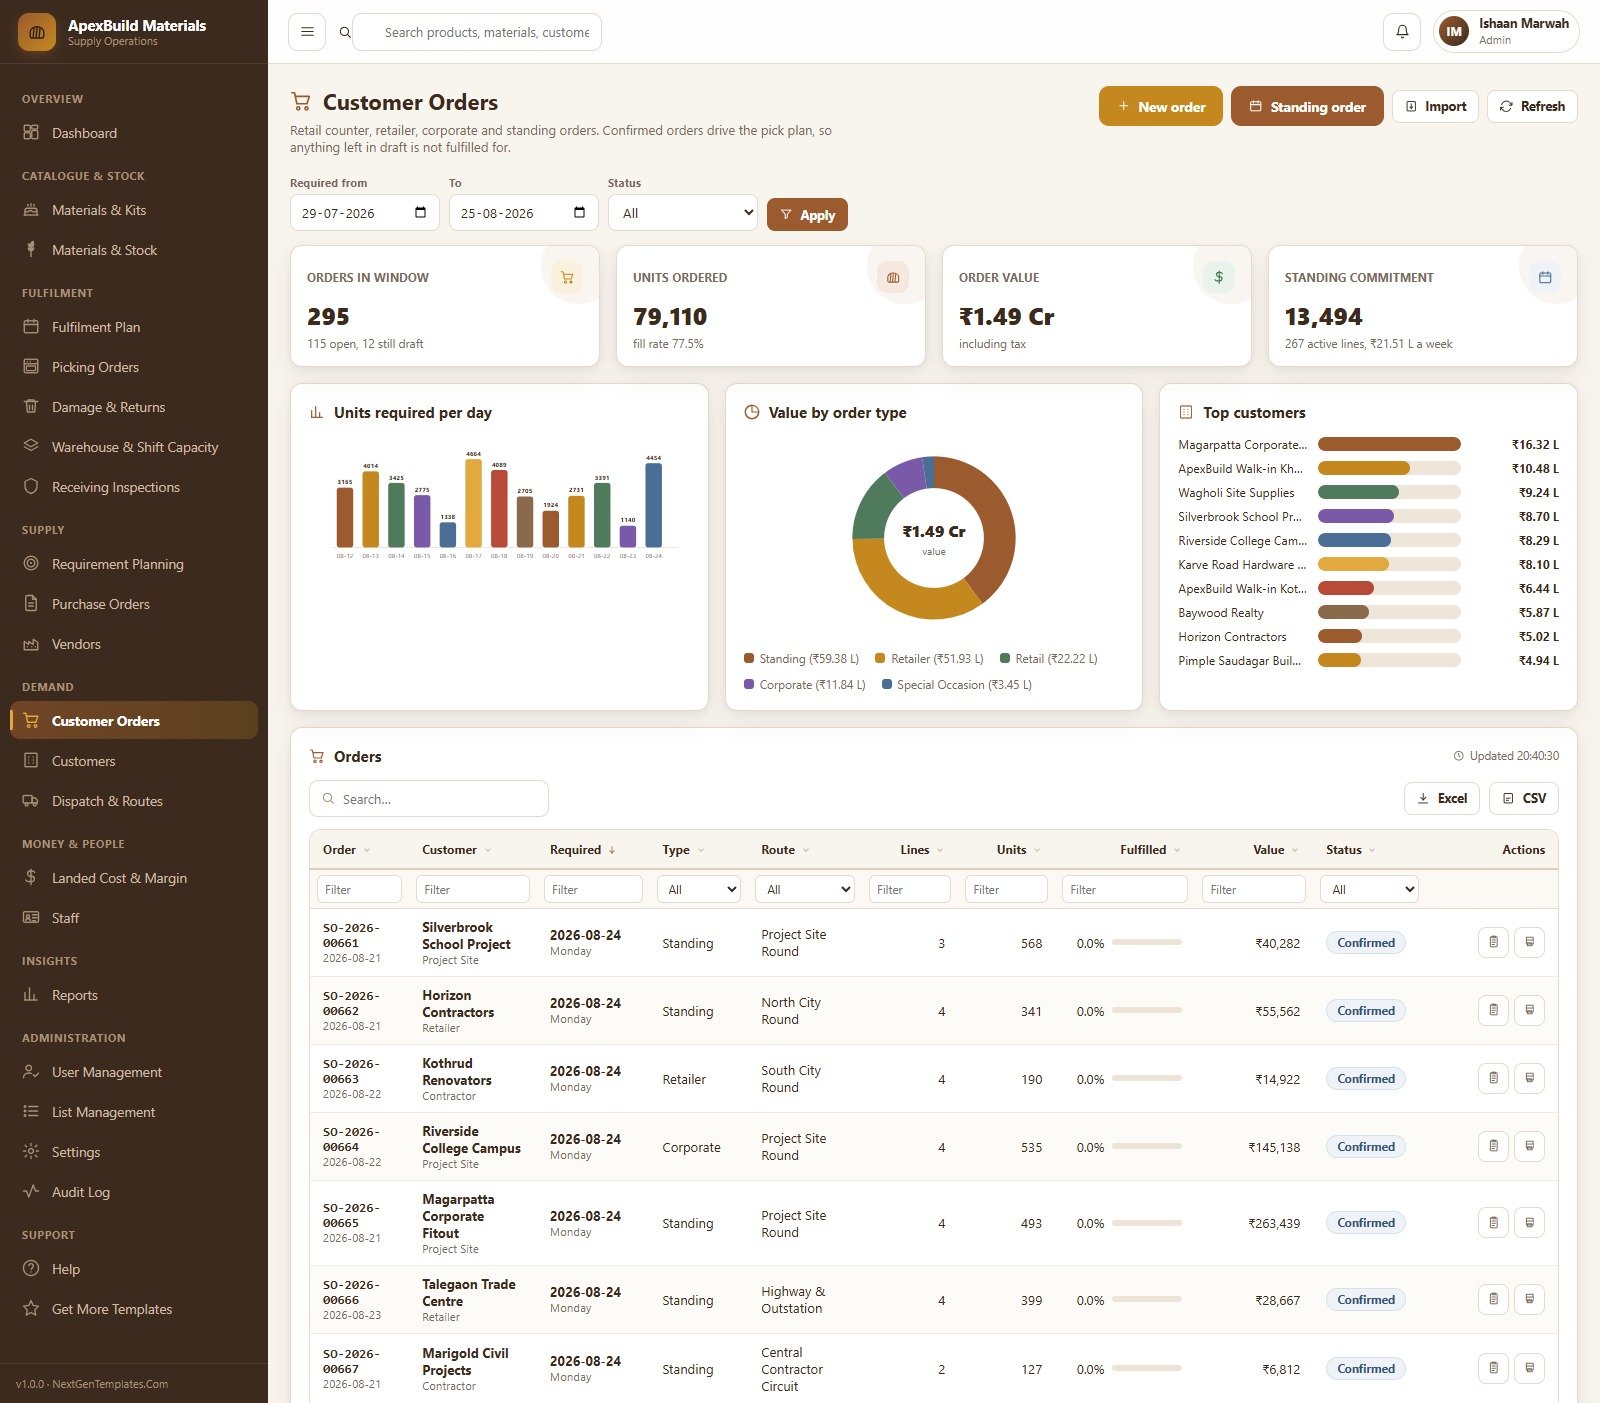
Customer Orders
Retail counter, retailer, corporate and standing orders in one window. Orders in window with open and draft counts, units ordered with a fill rate, order value and the standing commitment expressed as active lines and a weekly value. Units required per day, value by order type and top customers sit above the order table. Confirmed orders drive the pick plan, so anything left in draft is deliberately not fulfilled for – which is a design decision worth knowing before your first live day.
Dispatch & Routes
What leaves the warehouse, on which van, on which round, and whether it arrived when it was supposed to. Drops with a count still on the road, units delivered, delivered value with margin, and on-time delivery percentage, over delivered value by route, drops by status and units by product category. Each dispatch note records route, customer, product, units, value, margin, stop number, departure and delivery times and an on-time flag. Nothing goes out beyond what was picked or past its stock review date.
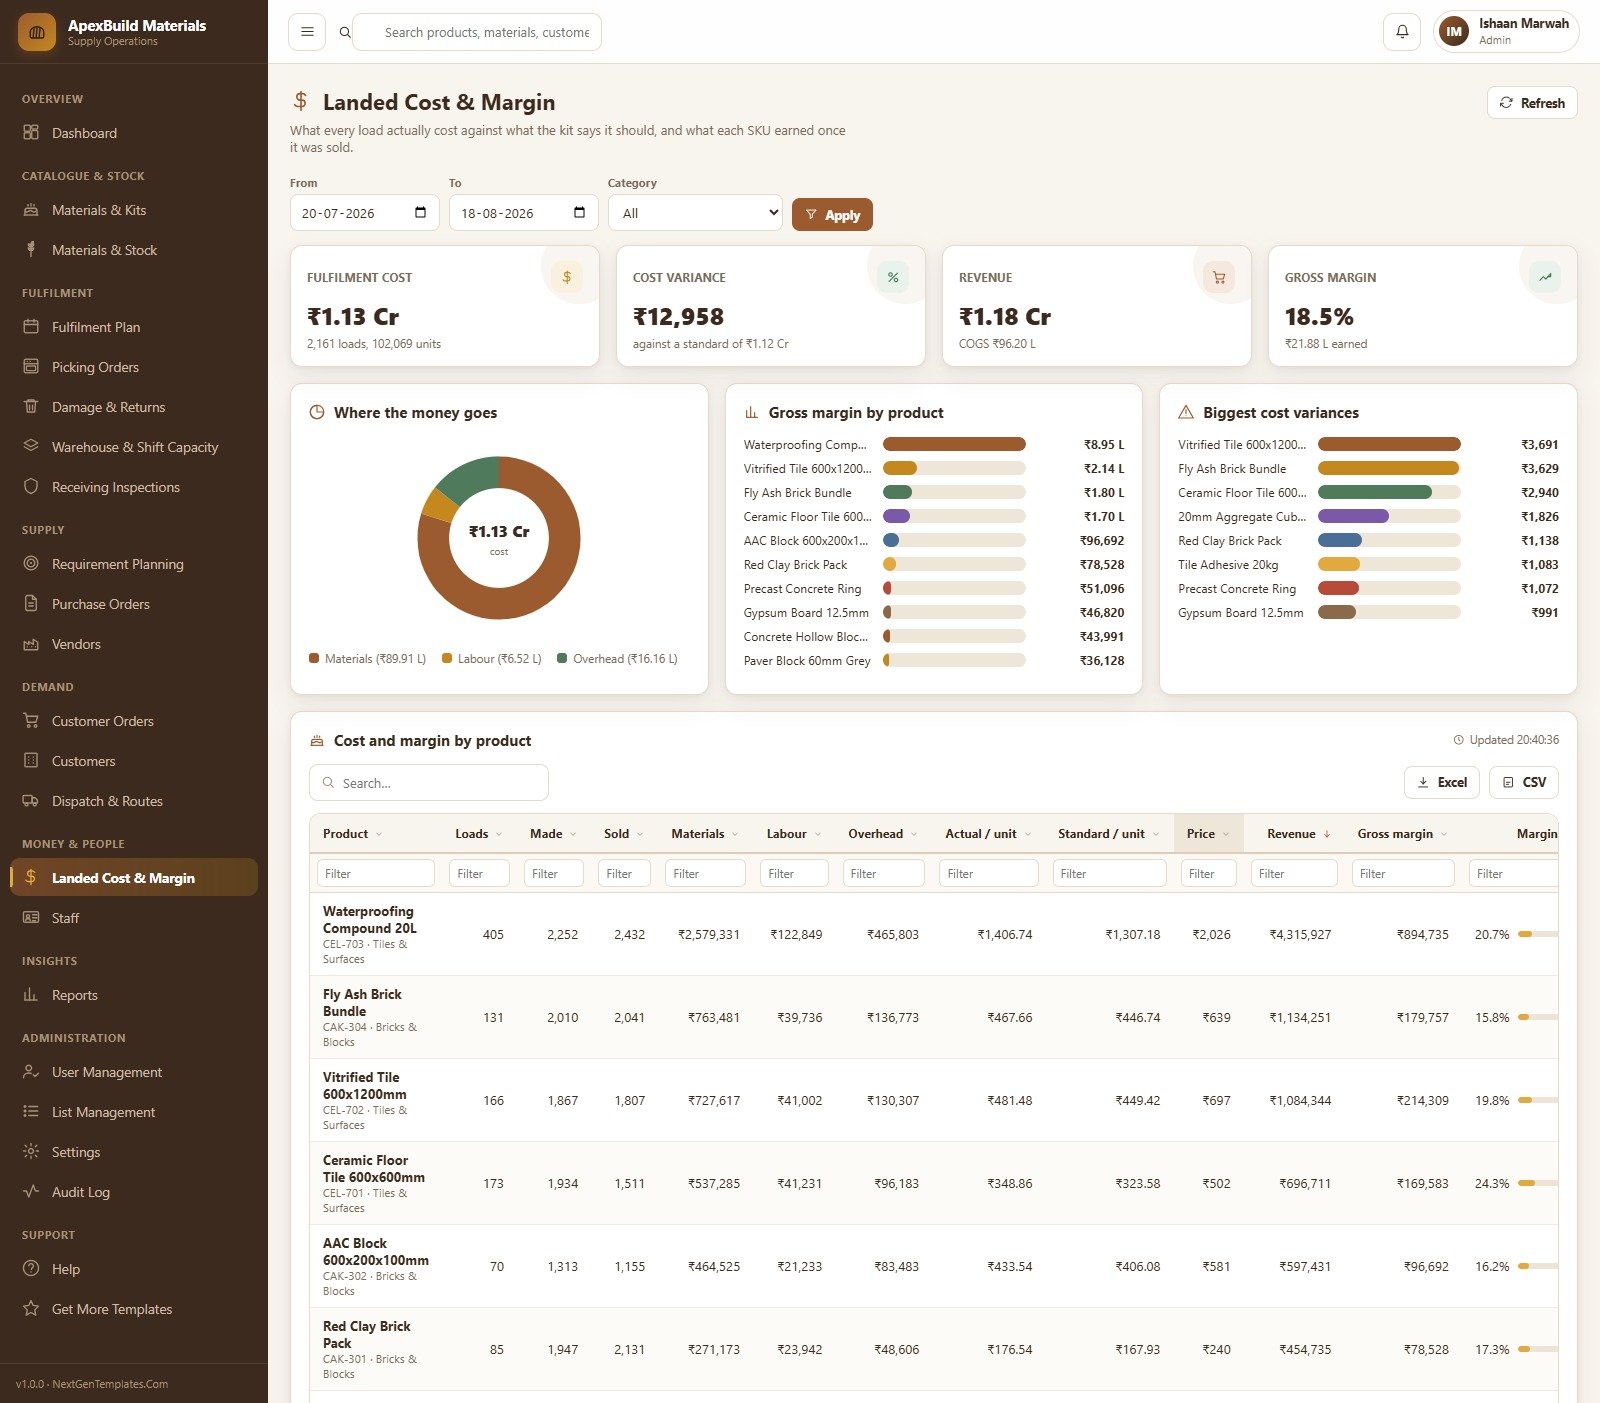
Landed Cost & Margin
What every load actually cost against what the kit says it should, and what each SKU earned once it was sold. Fulfilment cost, cost variance against standard, revenue and gross margin, with a Where the money goes split across materials, labour and overhead, gross margin by product and the biggest cost variances. The detail table runs loads, made, sold, materials, labour, overhead, actual cost per unit, standard cost per unit, price, revenue, gross margin and margin percentage for every product.
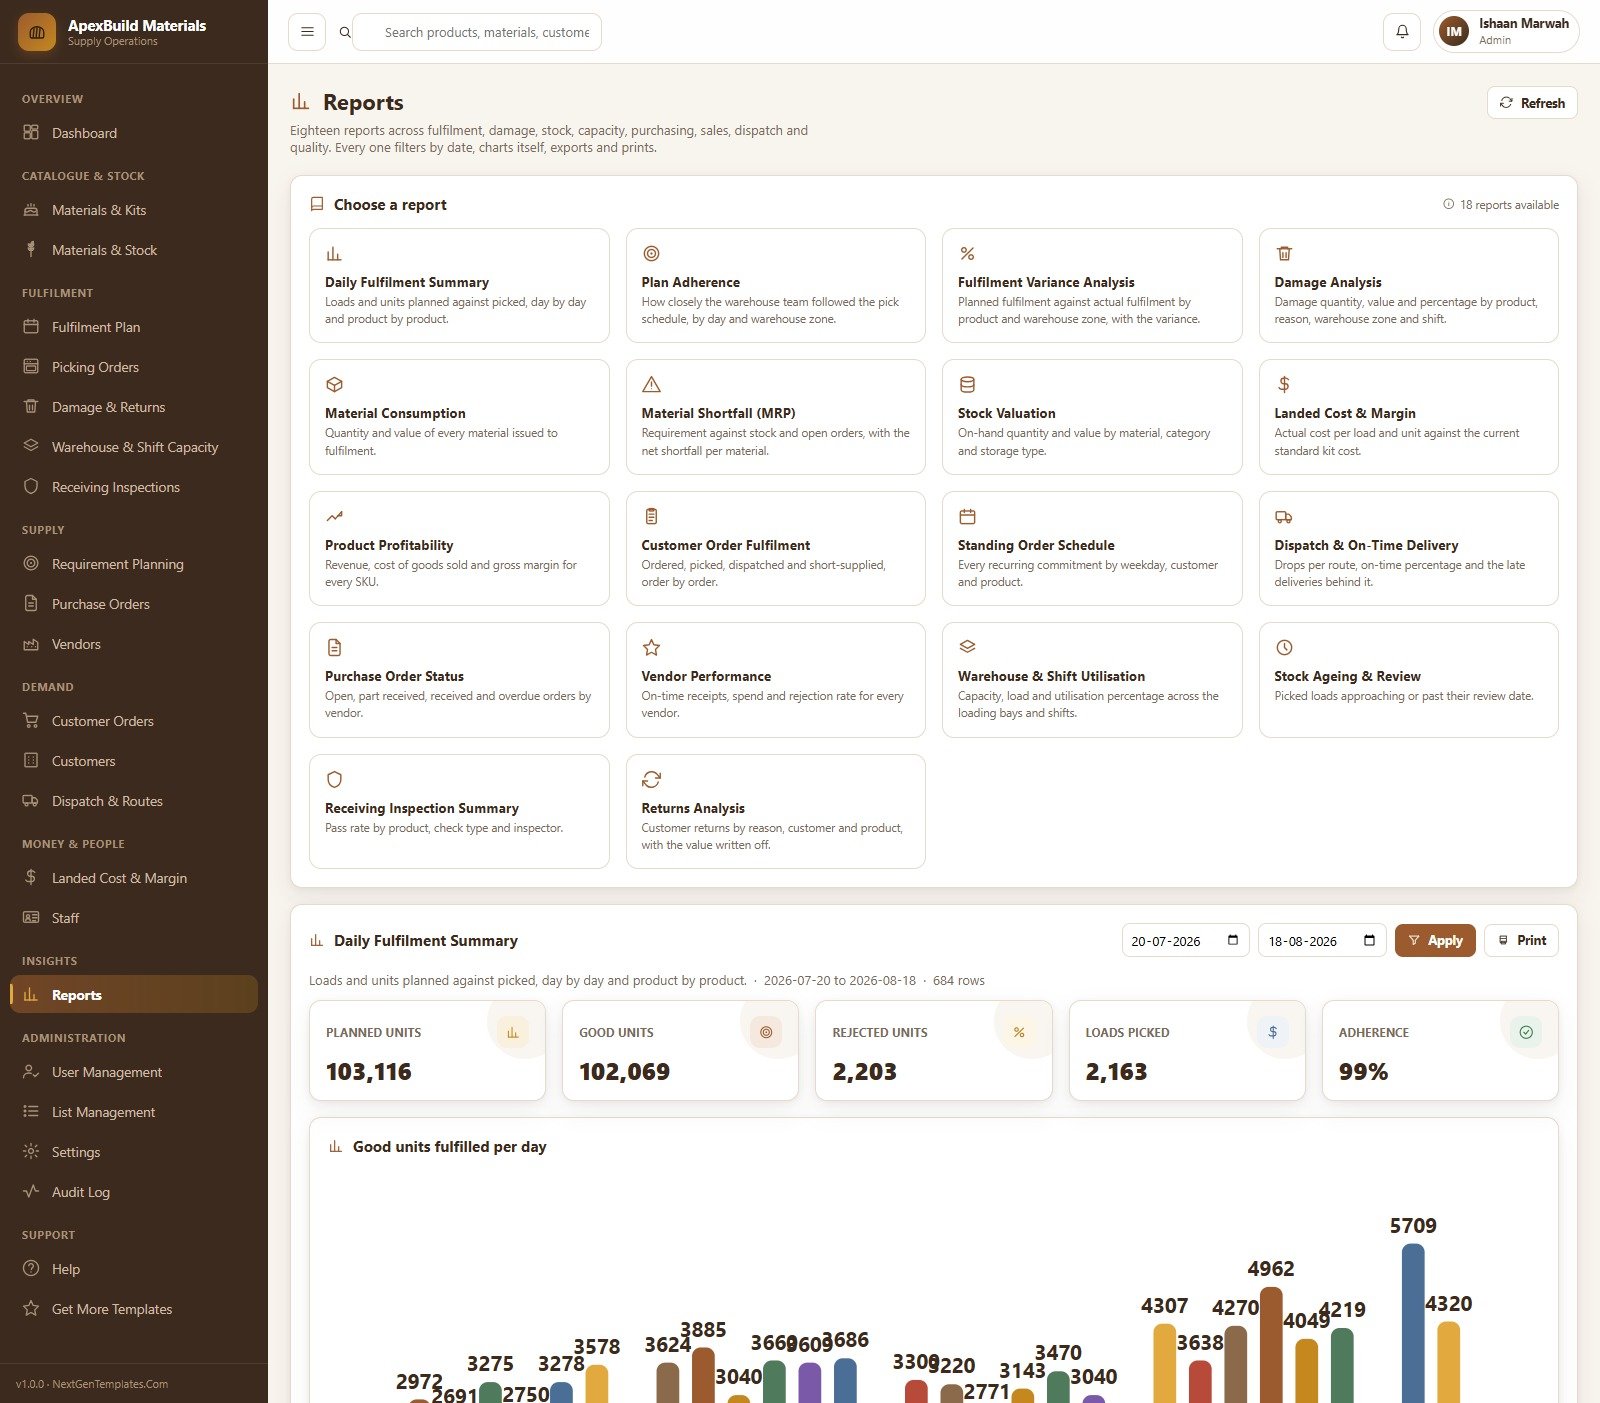
Reports
Eighteen reports across fulfilment, damage, stock, capacity, purchasing, sales, dispatch and quality: Daily Fulfilment Summary, Plan Adherence, Fulfilment Variance Analysis, Damage Analysis, Material Consumption, Material Shortfall (MRP), Stock Valuation, Landed Cost & Margin, Product Profitability, Customer Order Fulfilment, Standing Order Schedule, Dispatch & On-Time Delivery, Purchase Order Status, Vendor Performance, Warehouse & Shift Utilisation, Stock Ageing & Review, Receiving Inspection Summary and Returns Analysis. Every one filters by date, draws its own chart, prints and exports.
The Seeded Demo Database
The system ships populated so that nothing looks empty on day one: 33 sheets and roughly 14,420 rows. That covers 45 sellable construction SKUs across cement, steel, blocks, aggregates, plumbing, boards, tiles, roofing and safety supplies; 52 purchased materials; 16 vendors; 42 customers and project sites; eight warehouse and yard zones; three shifts; eight delivery routes; and 28 staff records. Current orders, fulfilment plans, picking orders, inspections, purchasing, stock movements, dispatches, damage and returns all have data behind them.
All of it is demonstration data, generated for the template. Replace it with your own from List Management and the master screens before you go live – the archive workflow is there for later, when the transaction history genuinely grows.
How It Compares
| Spreadsheet stack | This web app | SaaS ERP | |
|---|---|---|---|
| Separate logins per role | No | Yes, 6 roles | Yes |
| Permissions enforced server-side | No | Yes | Yes |
| Pick schedule generated from orders | Manual | Yes | Yes |
| MRP shortfall to purchase orders | Manual | One click | Yes |
| Actual landed cost per SKU | Rarely | Yes | Yes |
| Where the data lives | Your drive | Your Google Drive | Vendor servers |
| Source code you can edit | n/a | Yes, included | No |
| Monthly cost | None | None | Per user, per month |
| Setup time | Ongoing | About 15 minutes | Weeks |
Setting It Up
- Open the live demo first and sign in as two different roles. It is the quickest way to decide whether the workflow matches yours.
- Create a new standalone project at script.google.com.
- Paste the supplied Code.gs content into the editor’s script file.
- Add an HTML file named exactly Index and paste the supplied front-end into it. Save.
- Run setup once – either from the first-run panel that appears in the web app while the database is empty, or from the function list in the editor – and approve the Google permission prompt. Setup is staged and idempotent, so running it again is safe.
- Deploy as a web app, executing as you, with access set to suit your team.
- Sign in as admin and change every default password immediately.
One thing that catches people out: Apps Script does not push code changes to an existing deployment. After editing Code.gs or Index you have to deploy a new version for the change to appear.
Interested in the spreadsheet skills behind a system like this? The NextGenTemplates Academy learning paths cover them step by step, with practice files.
Get the Building Material Supplier Management System Web App
Frequently Asked Questions
Can I try it before buying?
Yes – the live demo above is this exact system with the seeded database, and every role’s credentials are listed. Click through it before you spend anything.
Is this accounting or statutory compliance software?
No. It is an operations system for stock, fulfilment, purchasing, sales and dispatch. It does not file returns, produce statutory accounts, calculate tax liability, or certify anything to a regulator or auditor. Every figure it shows is derived from the data you enter.
Where does the data live?
In a Google Sheets database inside your own Google Drive, created when you run setup. Nothing leaves your Google account and no external server is involved.
Do I need to write code?
No. Deployment is copy, paste, run setup, deploy. The full source is included so that you can change things, not because you have to.
How many users can I add?
As many as you create in User Management. The six shipped accounts are examples, and each user’s menu can be tailored individually.
Can I change currency, categories, routes and shifts?
Yes. Currency and other defaults live in Settings; categories, storage types, routes, shifts, damage reasons and check types are all editable in List Management.
What happens when the database gets big?
The admin archive workflow previews eligible closed rows, takes a full spreadsheet copy, registers the archive, and only then trims old transaction rows. Master data and open transactions stay put, and archives can be reconnected read-only.
Related Templates
- Cement and Steel Dashboard in Google Sheets – analytics for the same materials, if reporting is all you need.
- Rental Equipment Management System Web App – the same architecture applied to plant and equipment hire.
- Home Renovation Project Management Web App – project-side companion for the contractors you supply.
- Compliance Monitoring Dashboard in Excel – a separate Excel dashboard for tracking internal control checks.
Get the Template
Open the demo, sign in as the Warehouse Coordinator, and notice how little that role can reach compared with Admin. That separation – plus a pick schedule nobody had to type and a shortfall list that turns into purchase orders – is the whole argument for the system.
Get the Building Material Supplier Management System Web App on NextGenTemplates
The download includes the full Apps Script source, the front-end HTML, an illustrated user manual in PDF and Word, the deployment guide and the default login list. Need it adapted to your yard? Write to info@NextGenTemplates.Com.