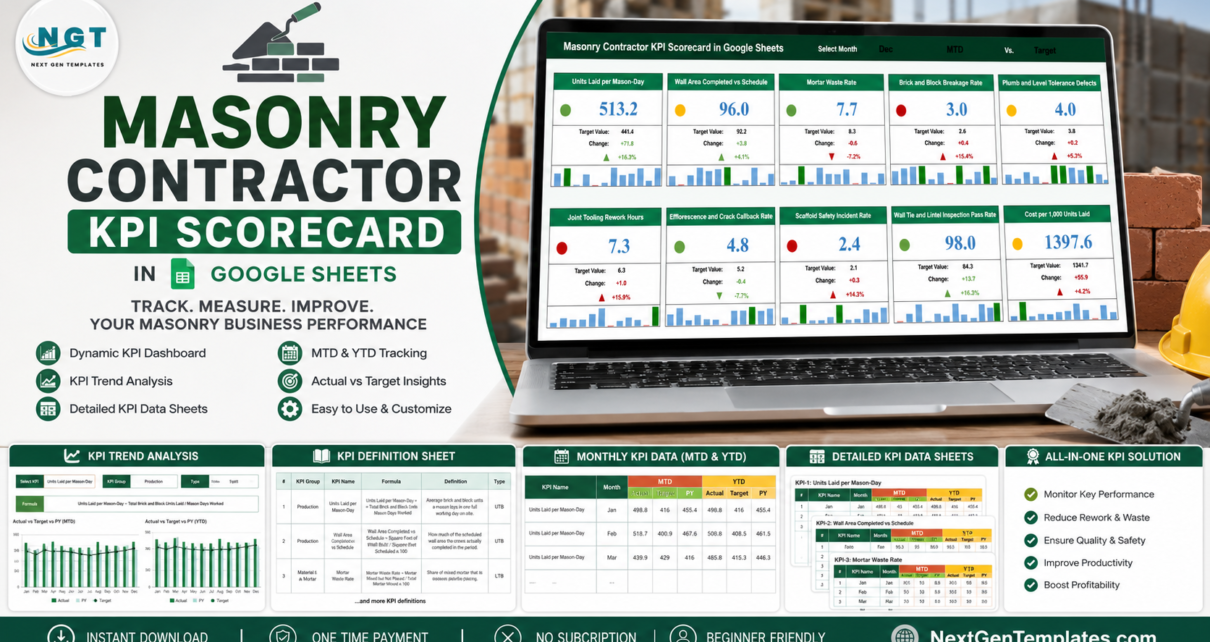
The Masonry Contractor KPI Scorecard in Google Sheets tracks 10 masonry KPIs across 5 KPI groups on 4 connected sheets, carries 12 months of sample data behind every metric, and puts a red, amber or green traffic light on each of the 10 KPI cards. In the December sample month the scorecard reads 4 green, 3 amber and 3 red — the whole month’s performance in one glance.Masonry Contractor KPI Scorecard in Google Sheets
Most masonry firms already know roughly how the job is going. What they usually cannot do is put a number on it: how many units a mason lays in a full day, how much mixed mortar boards over before it is placed, how many courses come back out of plumb, and what a thousand laid units actually cost against the estimate. This scorecard exists to turn that instinct into ten measured numbers you can review once a month.
Get the Masonry Contractor KPI Scorecard in Google Sheets
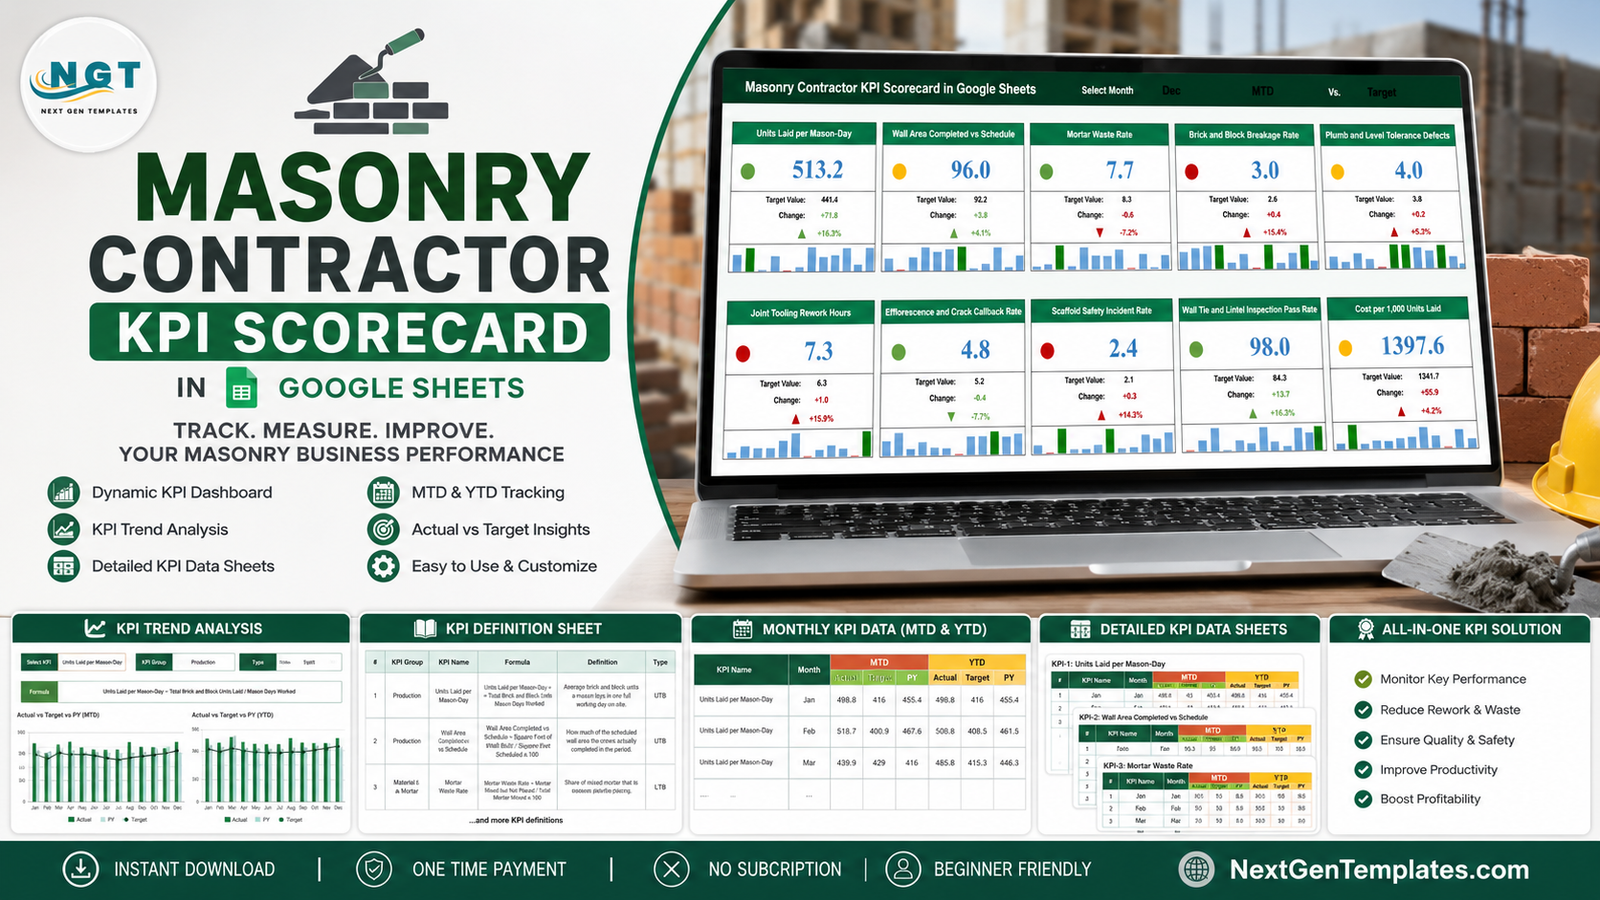
Key Features of the Masonry Contractor KPI Scorecard in Google Sheets
- 10 masonry-specific KPIs. Units Laid per Mason-Day, Wall Area Completed vs Schedule, Mortar Waste Rate, Brick and Block Breakage Rate, Plumb and Level Tolerance Defects, Joint Tooling Rework Hours, Efflorescence and Crack Callback Rate, Scaffold Safety Incident Rate, Wall Tie and Lintel Inspection Pass Rate, and Cost per 1,000 Units Laid.Masonry Contractor KPI Scorecard in Google Sheets
- Five KPI groups. Every metric belongs to Production, Material & Mortar, Quality & Rework, Safety & Compliance or Financial, so a red card immediately tells you which part of the operation to look at.Masonry Contractor KPI Scorecard in Google Sheets
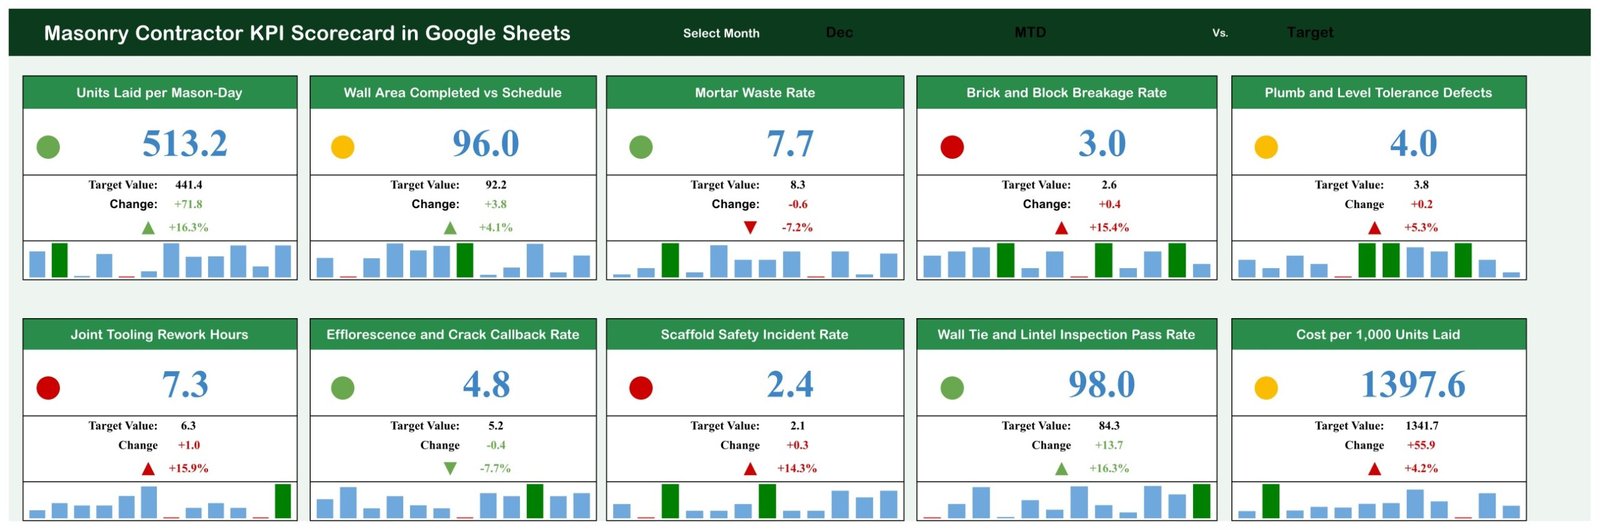
- Traffic lights on every card. A green, amber or red dot sits beside each value, next to the target value, the absolute change, and the percentage change with a direction arrow.
- Month picker and comparison switch. Three dropdowns in the header — Select Month, an MTD / YTD basis switch, and a “Vs.” switch for Target or Prior Year — reframe all 10 cards at once.Masonry Contractor KPI Scorecard in Google Sheets
- A 12-bar sparkline in every card. Each KPI card carries a miniature twelve-month bar strip under the numbers.Masonry Contractor KPI Scorecard in Google Sheets
- Every formula is written down. The KPI Definition sheet gives the arithmetic, the unit, the group and the direction (higher-is-better or lower-is-better) for all ten metrics.
- One sheet to fill in. All 120 monthly rows of sample data live on a single Monthly KPI Data sheet. Overwrite them and the entire template follows.
Sheets Explanation
KPI Scorecard
The landing page lays all 10 KPI cards out in two rows of five under the Select Month, MTD and Vs. Target dropdowns. Each card shows the KPI name, the traffic-light dot, the current value, the Target Value, the Change, the percentage change with an up or down arrow, and the 12-month sparkline. In the December sample, Units Laid per Mason-Day sits at 513.2 against a 441.4 target (green, +16.3%), Wall Area Completed vs Schedule at 96.0% against 92.2 (amber), Brick and Block Breakage Rate at 3.0% against a 2.6% target (red), and Cost per 1,000 Units Laid at $1,397.6 against $1,341.7 (amber).Masonry Contractor KPI Scorecard in Google Sheets
KPI Trend
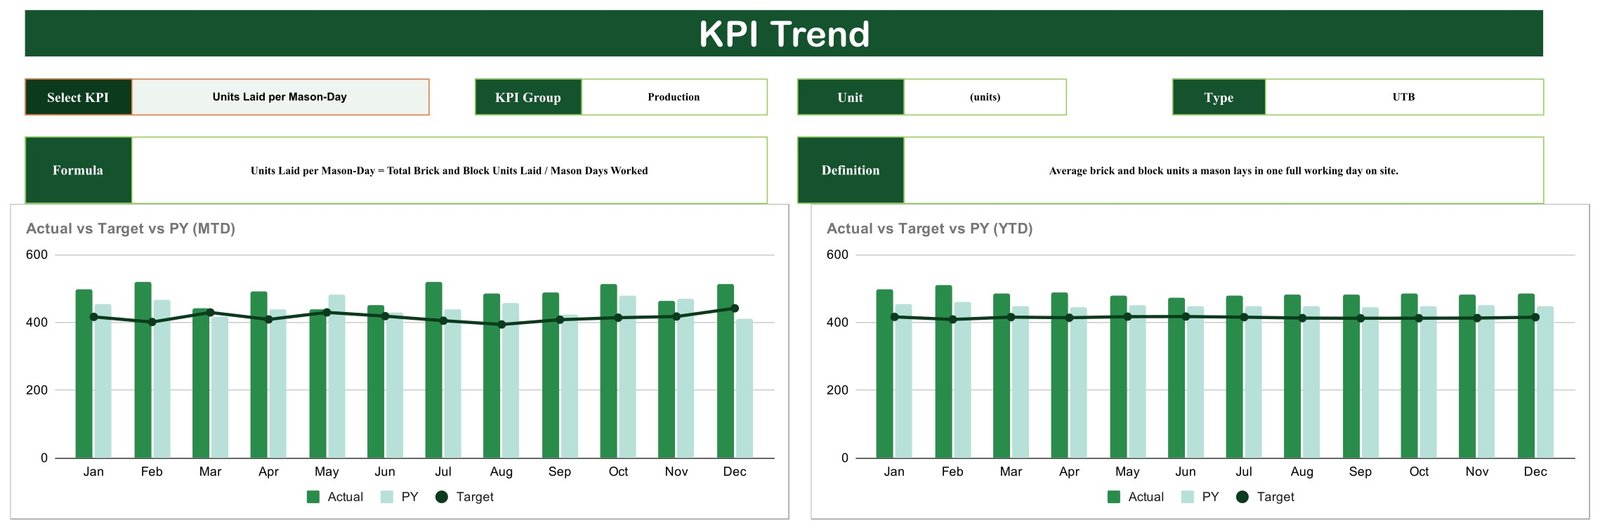
Choose any one of the ten metrics from the Select KPI dropdown and this page fills in its KPI Group, Unit, Type, Formula and Definition, then draws two charts side by side: Actual vs Target vs PY (MTD) and Actual vs Target vs PY (YTD). Both run January through December with Actual and Prior Year as bars and Target as a line, which makes a month that beat target but fell behind last year impossible to miss.Masonry Contractor KPI Scorecard in Google Sheets
KPI Definition
A single reference table listing all ten KPIs with number, KPI Group, KPI Name, Unit, Formula, Definition and Type. Mortar Waste Rate, for instance, is Mortar Mixed but Not Placed / Total Mortar Mixed x 100 and is marked LTB (lower is better); Wall Tie and Lintel Inspection Pass Rate is Inspections Passed First Time / Inspections Carried Out x 100 and is marked UTB. This is the page you print for a new site supervisor.

Monthly KPI Data
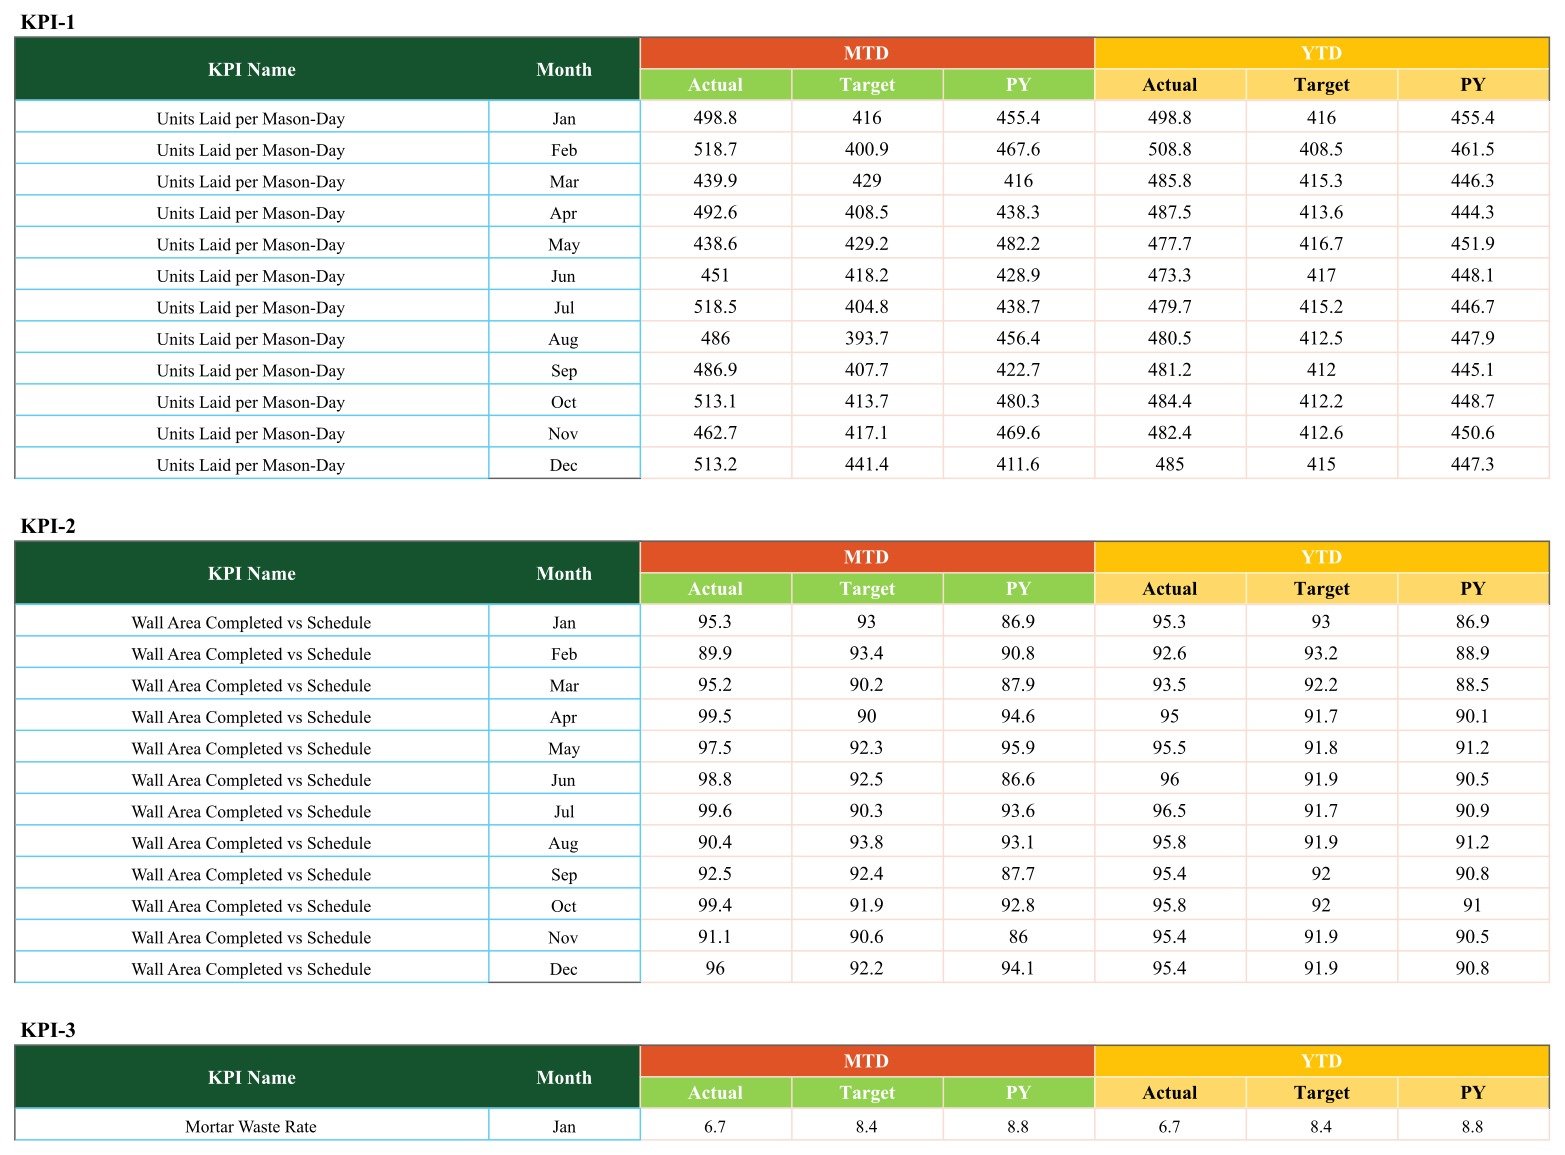
The only sheet you type into. It holds one block per KPI, labelled KPI-1 through KPI-10, and each block carries twelve monthly rows with MTD Actual, Target and PY next to YTD Actual, Target and PY. That is 120 monthly rows of sample data in total. Replace the sample figures with your own and the scorecard cards, traffic lights and trend charts all recalculate.
Masonry Contractor KPI Scorecard in Google Sheets vs. Microsoft Excel Dashboard vs. Paid Construction SaaS — Feature Comparison
| Feature | Masonry Contractor KPI Scorecard in Google Sheets | Microsoft Excel Dashboard | Procore / Buildertrend / Autodesk Construction Cloud |
|---|---|---|---|
| Cost | $8.99 one-time ✅ | $15-30 one-time | $99-500+ / month, often quoted per project |
| Platform | Google Sheets, browser-based ✅ | Excel desktop | Vendor cloud platform |
| Setup time | Under 10 minutes ✅ | 10-20 minutes | 2-6 weeks onboarding |
| Real-time team collaboration | Yes, native Google Sheets sharing ✅ | Only via OneDrive co-authoring | Yes |
| Mobile access | Google Sheets mobile app ✅ | Excel mobile app | Native app |
| Customisable KPIs and targets | Yes, edit any formula or target cell ✅ | Yes | Limited to the vendor’s metric set |
| Share with a link | Yes ✅ | File must be sent or synced | Yes, seat required |
| Masonry-specific metrics out of the box | 10, including mortar waste and plumb tolerance ✅ | Build them yourself | Generic construction metrics |
| Year-1 cost at 5 users | $8.99 total ✅ | $15-30 total | $1,200-6,000+ |
For masonry firms that want a monthly performance review without a per-seat construction platform, the Masonry Contractor KPI Scorecard in Google Sheets sits in the sweet spot.
Who Should Use This Template
Perfect for:
- Masonry and bricklaying contractors running 2-30 crews who hold a monthly performance review
- Site supervisors and foremen who want productivity, waste, rework and cost on one page
- Owner-operators moving off paper and scattered spreadsheets who need targets and prior-year comparison in one place
- Estimators checking whether actual cost per 1,000 units laid is tracking the bid
Not a fit if:
- You want live job costing. You type the monthly figures in yourself; the sheet does not connect to accounting, estimating or field-service software.
- You need daily or per-job granularity. The data sheet is monthly, one row per KPI per month.
- You expect an alert when a KPI turns red. The card changes colour; nothing emails or notifies you.
- You need a formal regulatory recordkeeping system. This is a management scorecard, not a compliance register.
Real-World Use Cases
Danny runs a 12-mason brickwork firm on residential estates. Each month he enters laid units, mason days and mortar mixed on the Monthly KPI Data sheet, then opens the scorecard on December, MTD, vs Target. When Brick and Block Breakage Rate went red at 3.0% against a 2.6% target, he traced it to a new pallet supplier and switched back within the week — a decision he would previously have argued about for a month.
Priya supervises a commercial block-work package. She uses the KPI Trend page to show her project manager that Wall Area Completed vs Schedule held above 90% in eleven of twelve months, and that the one dip lined up with a two-week weather stoppage. The Actual vs Target vs PY chart made the case in about thirty seconds.
Marcus estimates for a regional masonry contractor. He watches Cost per 1,000 Units Laid month by month against the target built into the bid. When December came in at $1,397.6 against $1,341.7 he raised the plant allowance on the next three tenders rather than discovering the gap at year end.
Advantages of the Masonry Contractor KPI Scorecard in Google Sheets
- It costs $8.99 once. A five-person team on a $99/month construction platform spends more in the first fortnight than this template costs outright, and the scorecard has no per-seat charge at all.
- The metrics are already the right ones. You are not adapting a generic KPI template — mortar waste, plumb tolerance defects, joint tooling rework and wall tie inspections are masonry problems, named as masonry problems.
- It takes minutes, not weeks. There is no onboarding, no data migration and no integration project. Copy the sheet, type your numbers, review.
- Everything is visible. Every formula sits in an ordinary cell you can read and change, which matters when a number looks wrong and you need to know why.
- It shares like any Google Sheet. Send a link to your supervisors; they open it on a phone on site. See Google’s guide to sharing files in Sheets for the sharing options.
Opportunities for Improvement
Being straight about the limits: the scorecard is a monthly review instrument, so it will not tell you anything about today’s wall. Data entry is manual — there is no import from accounting or field software, and the sheet does not pull anything in on its own. The traffic lights colour the cards but send no alerts, so somebody still has to open the file. And the scorecard shows one month at a time; if you want several months side by side you use the KPI Trend page rather than the scorecard itself. Most masonry firms of this size find those trade-offs acceptable, but they are real, and worth knowing before you buy.
Best Practices
- Set targets before the month starts, not after. A target back-filled to match the result teaches you nothing.
- Enter the numbers on the same day every month. A scorecard reviewed on the 5th every month beats a better scorecard reviewed whenever somebody remembers.
- Read the KPI Definition sheet first. Make sure the way your team counts “units laid” matches the formula, or the trend will be measuring your definition drifting rather than your crews improving.
- Use the Vs. Prior Year switch at least once a quarter. Beating target while sliding against last year is the failure mode this switch exists to catch.
- Review one red card properly rather than all ten superficially. Open its KPI Trend page, look at the twelve-month shape, and decide whether it is a blip or a slide.
Explore Relevant Templates
- Construction Project Intelligence Kit – 6 Premium Templates — six construction templates across Excel, Power BI and Google Sheets in one bundle.
- Construction Progress & Cost Control Dashboard in Google Sheets — the chart-led analytical companion to this scorecard.
- Construction Project Timeline in Google Sheets — plan the schedule whose delivery this scorecard measures.
- Equipment Maintenance Log Tracker in Google Sheets — log mixers, saws and hoists alongside the monthly review.
- Solar Energy KPI Scorecard in Google Sheets — the same scorecard engine built for another trade.
- Construction Project Management System Web App — if you have outgrown spreadsheets entirely.
Interested in the reporting skills behind a scorecard like this? The Excel Pivot Tables & Dashboards course on NextGenTemplates Academy teaches them step by step with practice files.
Get the Masonry Contractor KPI Scorecard in Google Sheets
Frequently Asked Questions
What KPIs does the Masonry Contractor KPI Scorecard in Google Sheets track?
The Masonry Contractor KPI Scorecard in Google Sheets tracks 10 KPIs: Units Laid per Mason-Day, Wall Area Completed vs Schedule, Mortar Waste Rate, Brick and Block Breakage Rate, Plumb and Level Tolerance Defects, Joint Tooling Rework Hours, Efflorescence and Crack Callback Rate, Scaffold Safety Incident Rate, Wall Tie and Lintel Inspection Pass Rate, and Cost per 1,000 Units Laid.
How long does setup take?
Setup takes under 10 minutes. Open the PDF included in your download, click the copy link to create your own Google Sheets copy, then replace the sample figures on the Monthly KPI Data sheet. Every card, traffic light and chart in the Masonry Contractor KPI Scorecard in Google Sheets recalculates from that single sheet.
How does this compare to Procore or Buildertrend?
Procore and Buildertrend are full construction platforms billed monthly per seat or per project. The Masonry Contractor KPI Scorecard in Google Sheets is a one-time $8.99 purchase doing one job well — a monthly masonry KPI review with targets, prior-year comparison and traffic lights. It does not manage schedules, documents or invoicing.
Is this the same as a KPI dashboard?
No. The Masonry Contractor KPI Scorecard in Google Sheets is the scorecard line: KPI cards, traffic lights and a month picker on one page. The KPI Dashboard and analytical dashboard lines are chart-led layouts with slicers. They answer different questions, and plenty of contractors run both.
Can I change the KPIs, formulas or targets?
Yes. Every KPI name, unit, formula, definition and monthly target in the Masonry Contractor KPI Scorecard in Google Sheets sits in an ordinary editable cell. Rename a metric on the KPI Definition sheet, adjust the target column on the data sheet, and the scorecard picks up the change immediately.
Do I need Excel or any add-on?
No. The Masonry Contractor KPI Scorecard in Google Sheets runs entirely in Google Sheets in a browser with a free Google account. There are no macros, no add-ons and no external connections. See Google’s Sheets help centre if you are new to copying a shared file.
Will it alert me when a KPI goes red?
No. The Masonry Contractor KPI Scorecard in Google Sheets colours each card’s traffic light red, amber or green based on the value against target, but it sends no email or notification. You review it; it does not chase you.
About the Author
Built by PK — Microsoft Certified Professional with 15+ years of Excel, Google Sheets, and Power BI experience. Founder of NextGenTemplates, reaching 300K+ subscribers across YouTube channels. Every template is hand-built and tested before release.
Conclusion
Ten measured numbers, one page, once a month. That is the whole idea. If your masonry business currently runs on a feel for how the job is going, the Masonry Contractor KPI Scorecard in Google Sheets gives you Units Laid per Mason-Day, mortar waste, breakage, plumb tolerance defects, rework hours, callbacks, scaffold incidents, inspection pass rates and cost per thousand units — each against a target, each against last year, each with a traffic light.
Instant download · One-time payment · No subscription
Last updated: August 2026