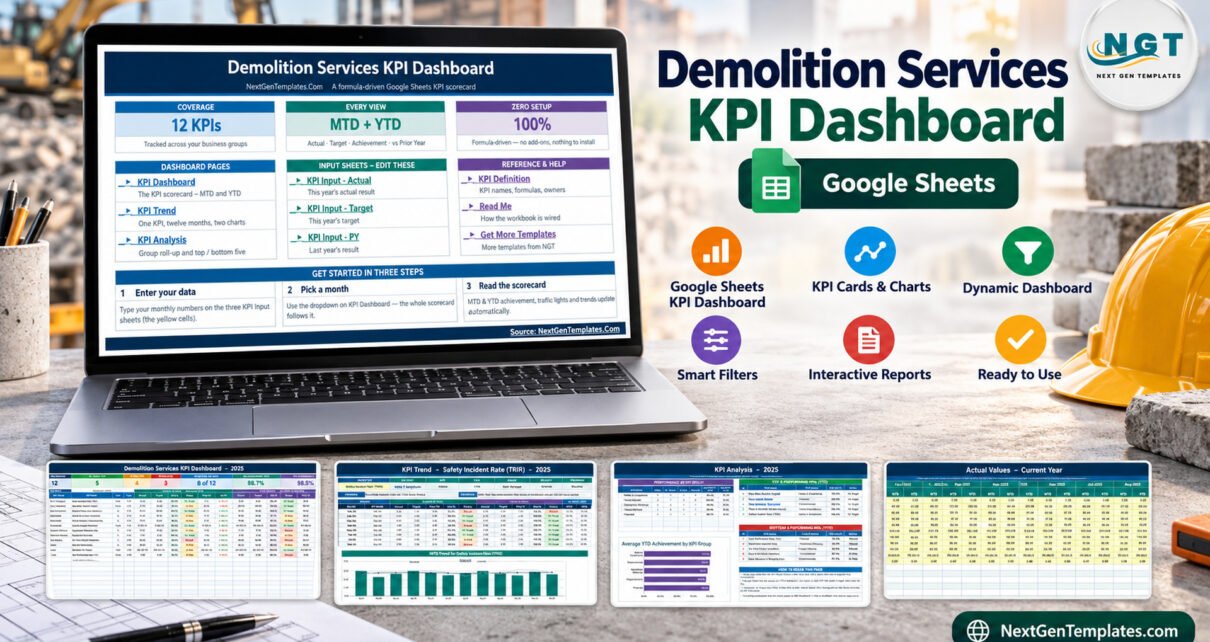
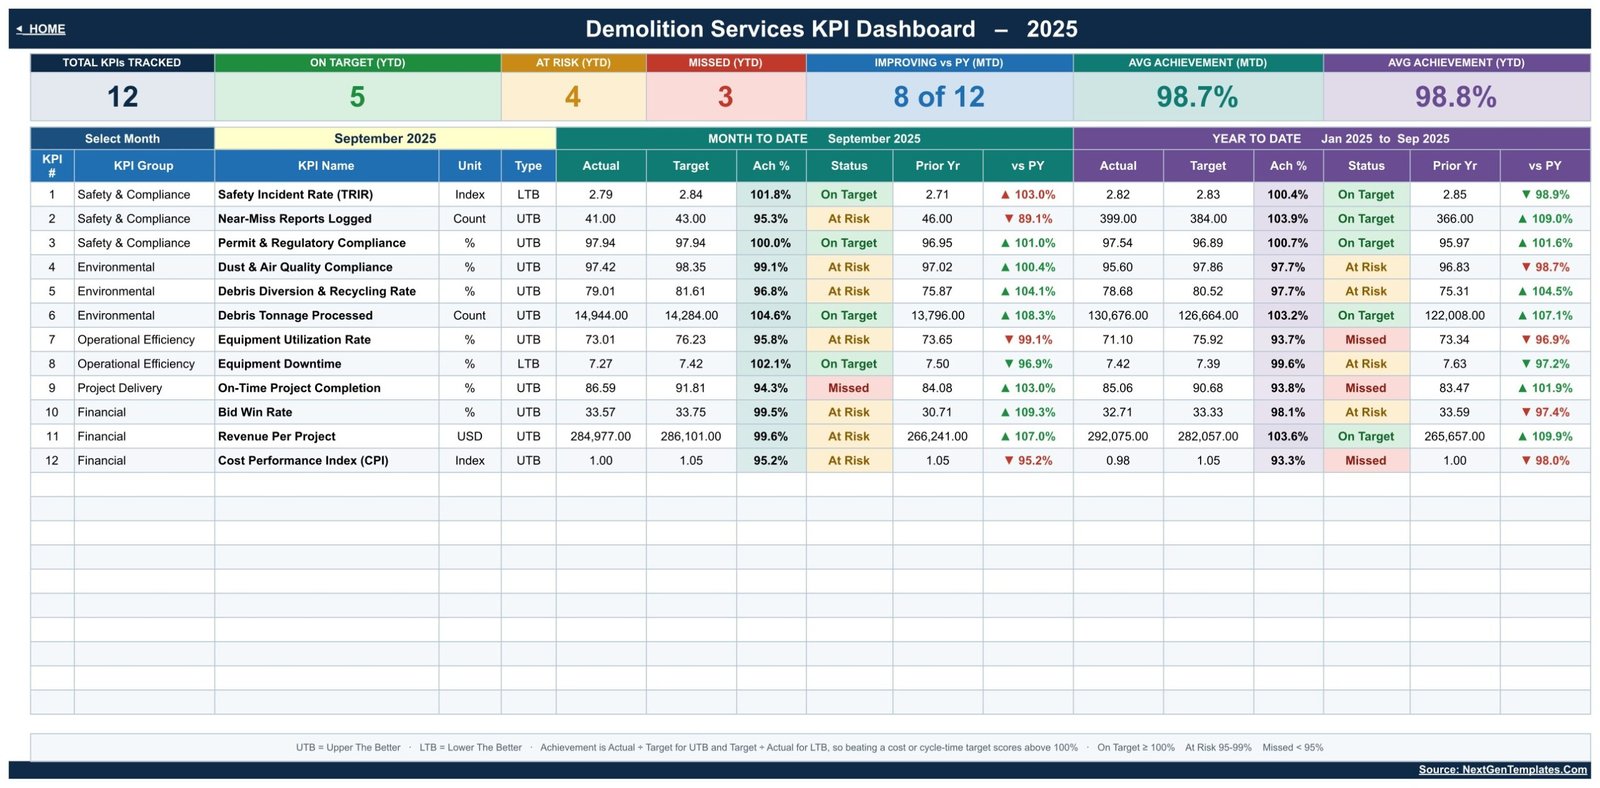
The Demolition Services KPI Dashboard in Google Sheets tracks 12 KPIs across five KPI groups on ten working tabs. Every KPI row shows six measures twice, once month-to-date and once year-to-date: Actual, Target, Achievement %, Status, Prior Year and a vs-PY arrow. In the September 2025 sample, 5 KPIs are On Target YTD, 4 are At Risk, 3 are Missed and 8 of 12 are improving on last year.
Most demolition contractors already have the numbers. Revenue sits in the accounting package, bids sit with the estimator, equipment hours sit with the fleet manager and debris tickets sit in a folder. What is usually missing is one page a month that puts incident rate, near-miss reporting, debris diversion, equipment utilization, on-time completion and cost performance side by side against target and last year. This template is that page, built in plain Google Sheets formulas with a single month picker.
It belongs to our Google Sheets KPI Dashboard family (month picker, traffic lights, KPI Trend and KPI Analysis pages). That makes it a different product from the Demolition Services KPI Scorecard, which we covered in a separate walkthrough of the scorecard edition. All figures in the file are fictional sample data.
Key Features of the Demolition Services KPI Dashboard in Google Sheets
- One month picker for the whole workbook. The Select Month dropdown on KPI Dashboard drives the MTD block, the YTD block (January to September 2025 in the sample), the KPI Trend page and the KPI Analysis page. There is no refresh button and no query to run.
- Traffic lights on every KPI. Each KPI gets an MTD and a YTD status: On Target at 100% achievement or more, At Risk from 95% to 99%, Missed below 95%. The colours come from standard conditional formatting rules in Google Sheets.
- Correct maths for lower-the-better KPIs. Ten KPIs are upper-the-better and two are lower-the-better: Safety Incident Rate (TRIR) and Equipment Downtime. LTB achievement is Target ÷ Actual, so a downtime figure below target scores above 100%.
- Seven header cards. Total KPIs Tracked (12), On Target YTD (5), At Risk YTD (4), Missed YTD (3), Improving vs PY MTD (8 of 12), Avg Achievement MTD (98.7%) and Avg Achievement YTD (98.8%).
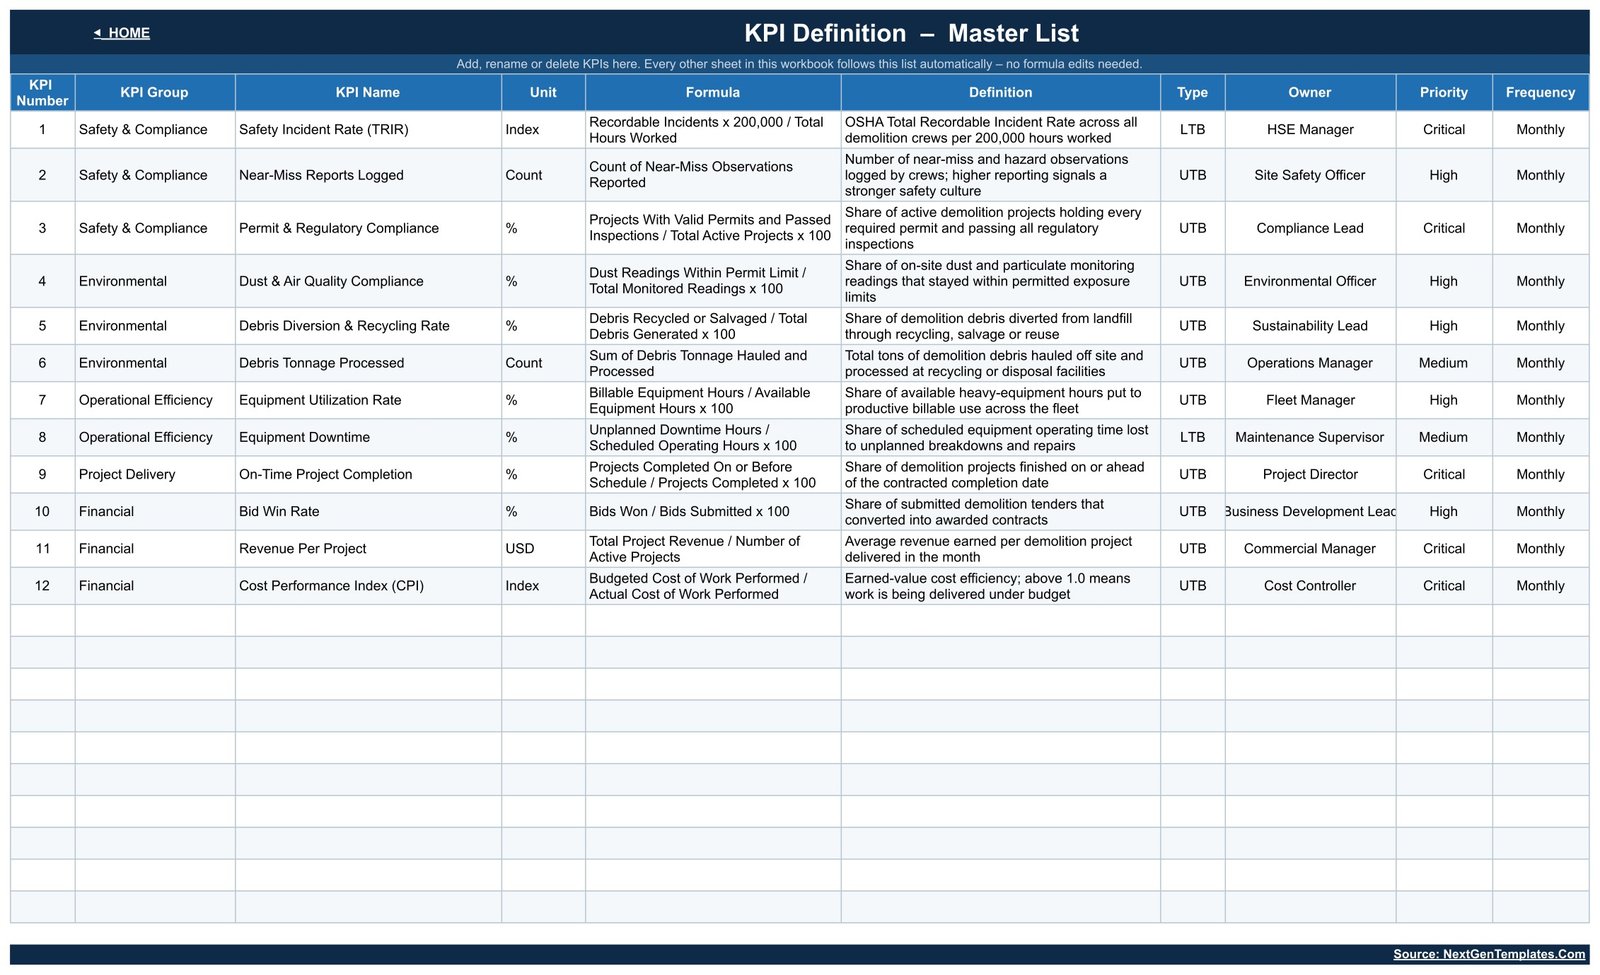
- A KPI list you control. The KPI Definition sheet holds each KPI’s group, unit, formula, definition, UTB/LTB type, owner, priority and frequency. The sheets are wired for 22 KPIs, so adding one means filling the next empty row.
Dashboard Pages Explanation
Page 1: Home
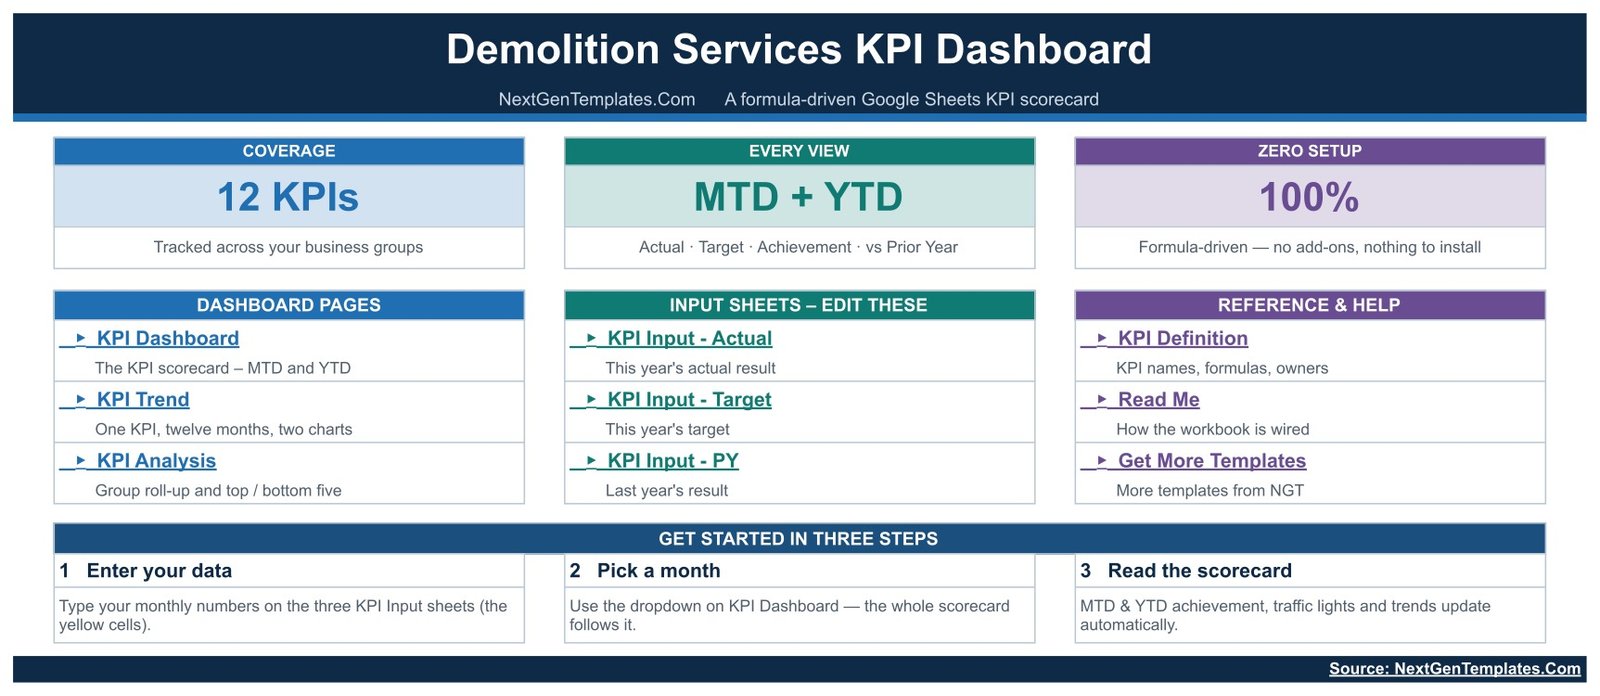
The start page shows the coverage cards (12 KPIs, MTD + YTD, formula-driven), links to the three dashboard pages, the three input sheets and the reference sheets, and a three-step guide: enter your data, pick a month, read the scorecard.
Page 2: KPI Dashboard
The scorecard lists all 12 KPIs with KPI group, unit and type, then MTD and YTD Actual, Target, Ach %, Status, Prior Yr and vs PY. In the sample, Debris Tonnage Processed is On Target at 104.6% MTD, Revenue Per Project is At Risk at 99.6% MTD but On Target at 103.6% YTD, and On-Time Project Completion is Missed at 94.3%.
Page 3: KPI Trend
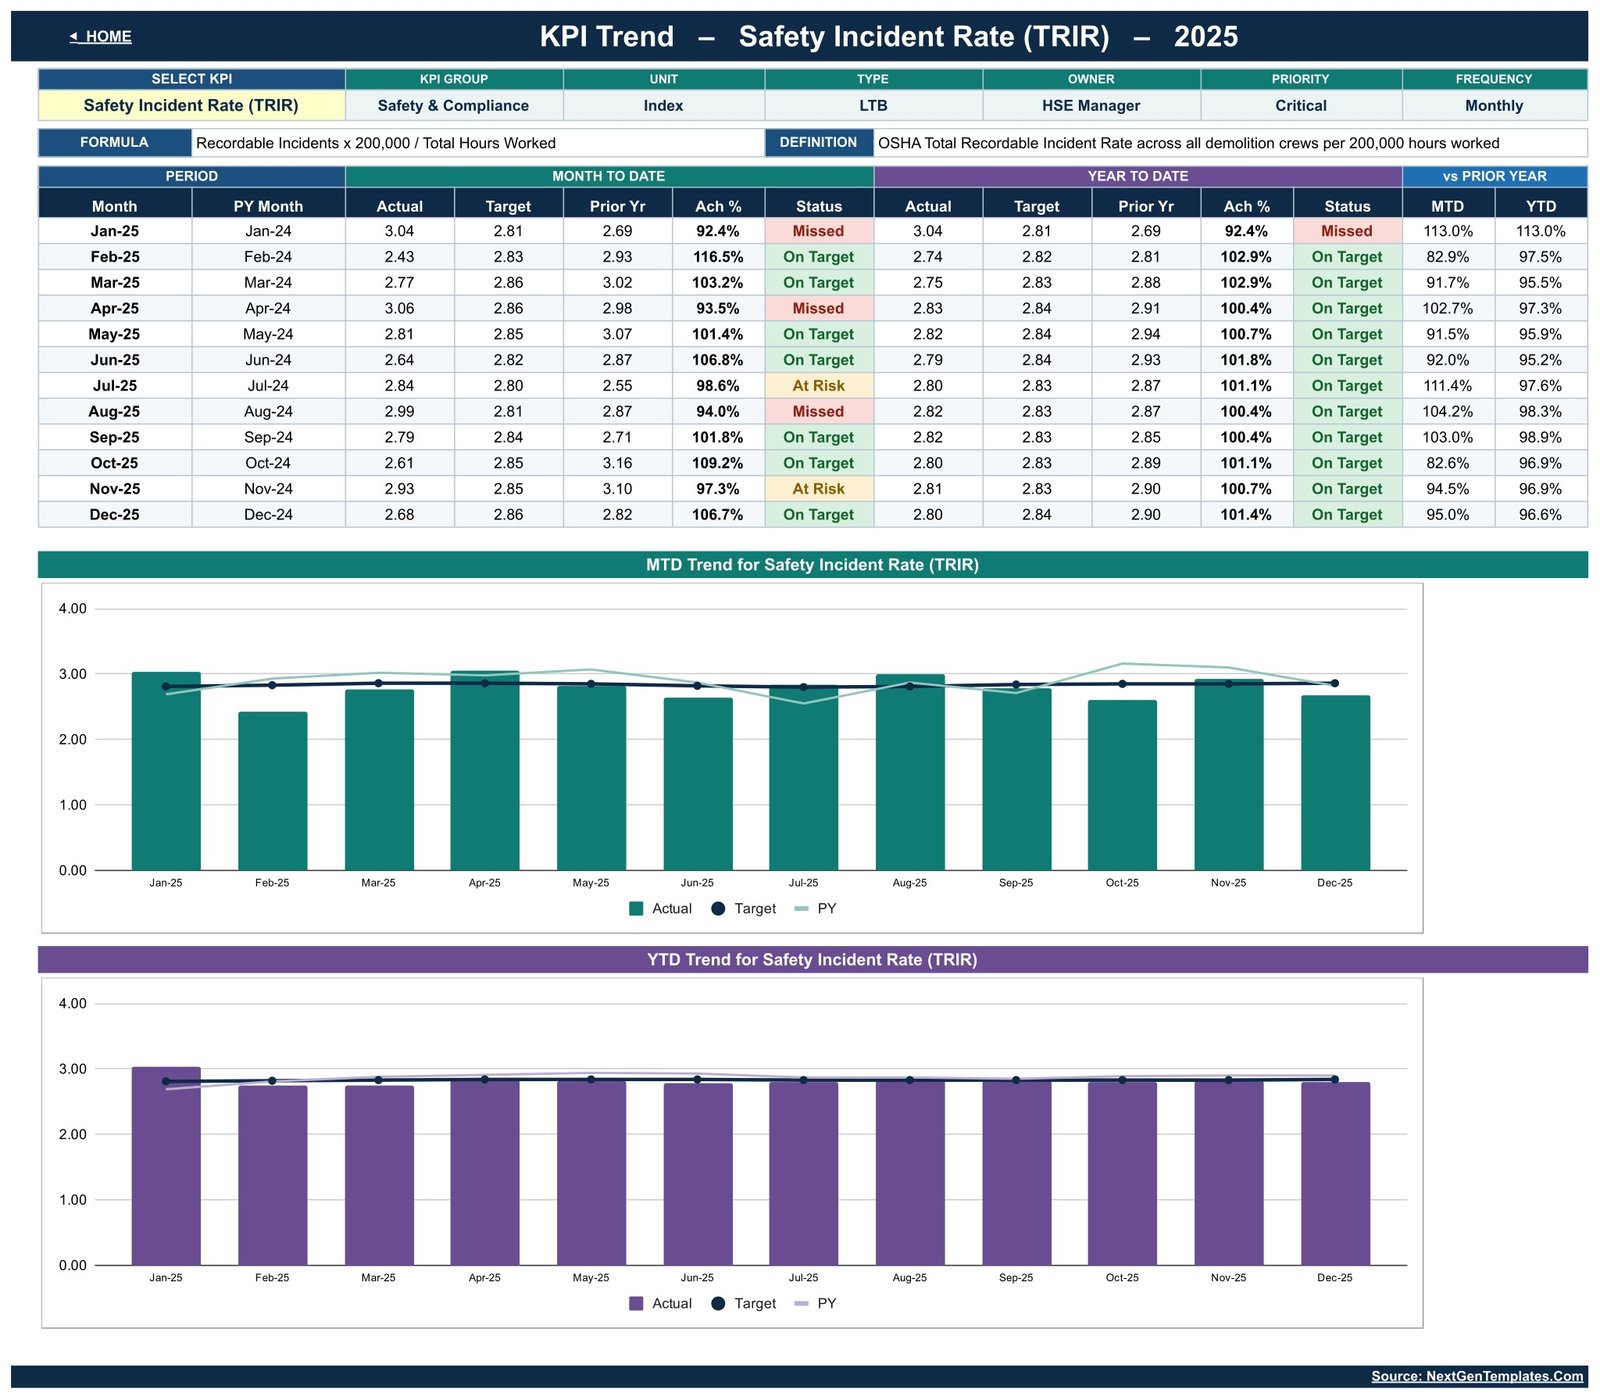
Pick one KPI to see its attribute strip (group, unit, type, owner, priority and frequency), its formula and definition, and a January-to-December table with MTD and YTD figures and statuses. Two charts follow, MTD Trend and YTD Trend, each plotting Actual against Target and Prior Year. The sample shows Safety Incident Rate (TRIR), owned by the HSE Manager.
Page 4: KPI Analysis
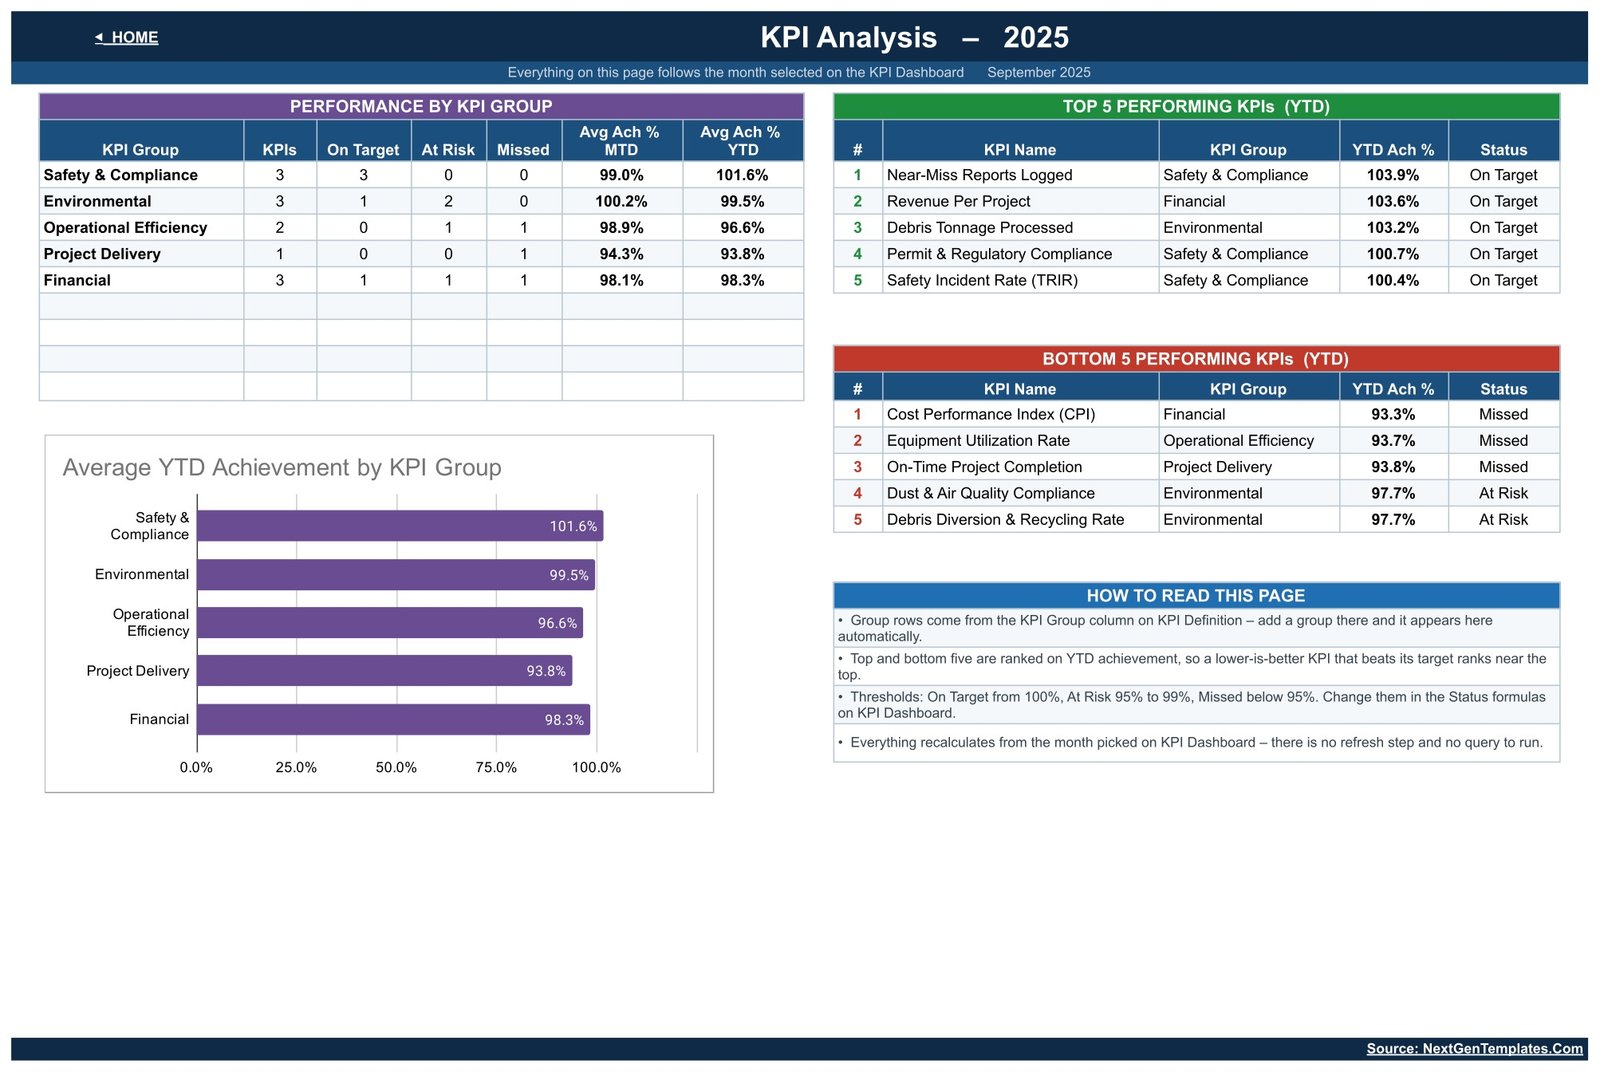
Performance by KPI Group counts On Target, At Risk and Missed KPIs per group, with average MTD and YTD achievement. The Top 5 and Bottom 5 Performing KPIs (YTD) tables and an Average YTD Achievement by KPI Group chart complete the page. Safety & Compliance leads the sample at 101.6% YTD and Project Delivery sits lowest at 93.8%.
Page 5: KPI Input Sheets
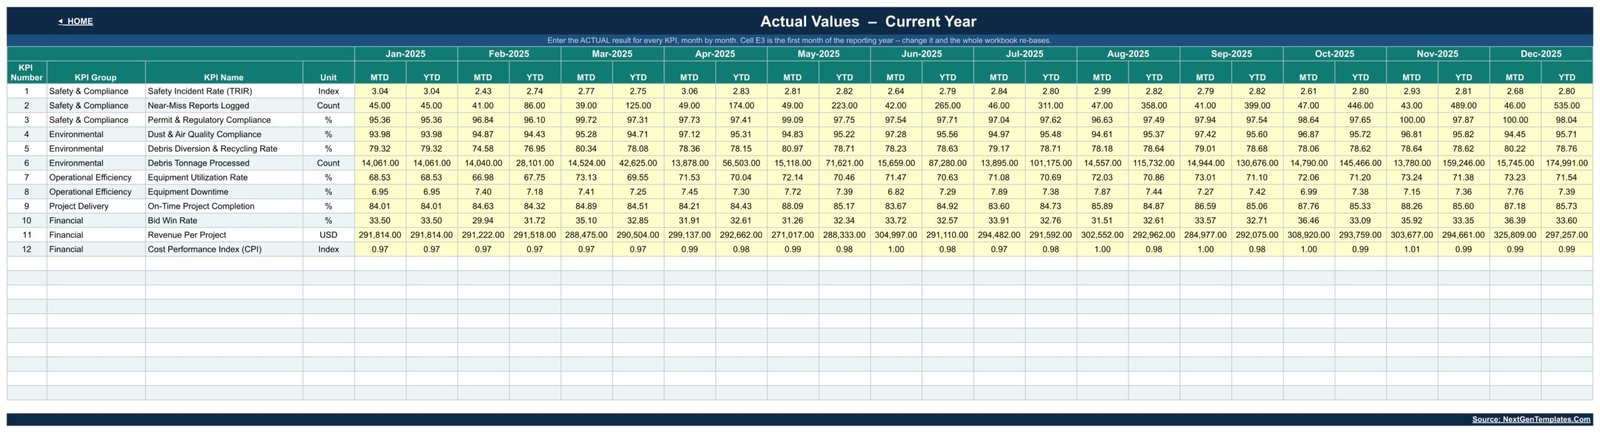
KPI Input – Actual, KPI Input – Target and KPI Input – PY take monthly numbers in yellow cells, with MTD and YTD columns for every month. Changing cell E3 on KPI Input – Actual re-bases the whole workbook, including the month dropdown and every sheet title.
Page 6: KPI Definition
The master list behind every page: 12 KPIs with formula, definition, type, owner, priority and frequency. Examples include Debris Diversion & Recycling Rate (Debris Recycled or Salvaged / Total Debris Generated x 100) and Cost Performance Index (Budgeted Cost of Work Performed / Actual Cost of Work Performed).
Demolition Services KPI Dashboard vs. Excel KPI Workbook vs. Construction Software — Feature Comparison
| Feature | Demolition Services KPI Dashboard in Google Sheets | Microsoft Excel KPI Workbook | Construction Management Software |
|---|---|---|---|
| Cost | ✅ $8.99 one-time (sale price) | Template price plus an Excel licence | Recurring subscription, often per user |
| Platform | ✅ Any browser with a Google account | Excel desktop or Microsoft 365 | Vendor web app |
| Setup | ✅ Make a copy, type monthly numbers | Open the file, type monthly numbers | Account setup and onboarding |
| Real-time team collaboration | ✅ Native co-editing | Needs OneDrive or SharePoint | ✅ Yes |
| Mobile access | ✅ Google Sheets app | Excel mobile app | ✅ Vendor app |
| Customizable KPIs | ✅ Edit the KPI Definition sheet | Depends on the workbook | Limited to vendor reports |
| Share with a link | ✅ Yes | Via cloud storage | User seats required |
| Year-1 cost at 5 users | ✅ One purchase | One purchase plus licences | Five paid seats for twelve months |
| MTD and YTD traffic lights out of the box | ✅ Yes | Only if built in | Varies by vendor |
| Bidding, scheduling, site logs and invoicing | ❌ Not included | ❌ Not included | ✅ Usually included |
For demolition contractors who want a monthly management scorecard without paying for seats in a full construction platform, this Google Sheets KPI dashboard sits in the sweet spot.
Who Should Use This Template
Perfect for:
- Owners of small and mid-sized demolition companies running a monthly business review
- Operations and fleet managers watching equipment utilization, downtime, debris tonnage and on-time completion
- Commercial managers tracking bid win rate, revenue per project and cost performance
- Site and environmental leads who want near-miss reporting and debris diversion on the same page as the financials
Not a fit if:
- You need estimating, project scheduling, invoicing or job costing. This is a scorecard, not construction management software
- You need a safety-management system, incident log, permit register or site-compliance record. The template only reports the rates you enter
- You need live data feeds from other systems. Numbers are typed or pasted in monthly
Real-World Use Cases
The owner of a four-crew demolition firm updates the Actual sheet on the first working day of each month. He opens KPI Dashboard, checks that Revenue Per Project and Debris Tonnage Processed are On Target, and notices On-Time Project Completion is Missed. That single red cell sets the agenda for his meeting with the project leads.
A fleet manager worried about idle machines selects Equipment Utilization Rate on KPI Trend. Twelve months of MTD results against target and prior year show whether the problem is a one-off or a pattern, and she reads it next to Equipment Downtime before changing the maintenance plan.
A commercial manager preparing a pricing review uses the Bottom 5 table on KPI Analysis. Cost Performance Index (93.3%) and Equipment Utilization Rate (93.7%) are both Missed YTD in the sample, which gives him a concrete case for revisiting tender assumptions.
Advantages of the Demolition Services KPI Dashboard
- One view instead of five reports. Safety, environmental, fleet, delivery and financial results sit on a single scorecard.
- Honest direction logic. LTB KPIs such as incident rate and downtime are scored the right way round, so green always means good.
- Prior-year context. The vs-PY arrows separate a bad month from a bad trend.
- No lock-in. It is a Google Sheets file you own, bought with one payment and shareable with your team.
- Built for editing. The KPI Definition sheet and the yellow input cells are the only places you need to type.
Opportunities for Improvement
- Data entry is manual. There is no connector to accounting, fleet telematics or project tools, so someone must type or paste the monthly figures.
- The scorecard is monthly. It does not track individual projects, crews, machines or daily site progress.
- Thresholds are shared across KPIs. The 100% and 95% cut-offs live in the Status formulas, and per-KPI thresholds would need a formula edit.
- Controls are two dropdowns, a month picker and a KPI selector, rather than multi-level filters.
- The sample formulas and definitions are illustrative. Rewrite them on KPI Definition to match how your own company measures safety, environmental and commercial results.
Best Practices
- Agree each KPI’s formula and owner on the KPI Definition sheet before entering data, so everyone reads the same number the same way.
- Enter targets for the full year up front, so the YTD achievement is meaningful from January.
- Load last year’s results into KPI Input – PY. Without them the vs-PY arrows have nothing to compare.
- Keep formula sheets locked with sharing permissions and Google Sheets dropdown and data validation tools, and leave only the yellow cells open for editing.
- Review the Bottom 5 table on KPI Analysis every month and assign one action per KPI.
Explore Relevant Templates
If you run a demolition business day to day, read our walkthrough of the Demolition Contractor Management System Web App. For other trades in the same KPI Dashboard format, see the Home Renovation Contractor KPI Dashboard in Google Sheets, or browse more Google Sheets KPI dashboard guides.
- Demolition Services KPI Scorecard in Google Sheets — the same trade in our separate KPI Scorecard family
- Demolition Contractor Management System Web App
- Concrete Contractor KPI Dashboard in Google Sheets
- Excavation Contractor KPI Scorecard in Google Sheets
Excel editions of this demolition dashboard and scorecard are in preparation.
Frequently Asked Questions
What KPIs does the demolition services dashboard track?
It ships with 12 KPIs. Safety & Compliance: Safety Incident Rate (TRIR), Near-Miss Reports Logged and Permit & Regulatory Compliance. Environmental: Dust & Air Quality Compliance, Debris Diversion & Recycling Rate and Debris Tonnage Processed. Operational Efficiency: Equipment Utilization Rate and Equipment Downtime. Project Delivery: On-Time Project Completion. Financial: Bid Win Rate, Revenue Per Project and Cost Performance Index (CPI).
Is this the same product as the Demolition Services KPI Scorecard?
No. This template is in the KPI Dashboard family, with a month picker, MTD and YTD traffic lights, a KPI Trend page and a KPI Analysis page. The Demolition Services KPI Scorecard in Google Sheets is a separate template with its own layout, sold as a different product.
How long does setup take?
There is nothing to install. Make a copy from the link in the PDF, adjust the KPI list if needed, and type monthly actuals, targets and prior-year figures into the yellow cells. Every page calculates automatically, so most of the effort is gathering your own numbers.
How does it compare to construction management software?
Construction platforms run bidding, scheduling, site logs and invoicing on a recurring subscription. This template does none of that. It is a one-time-purchase monthly KPI scorecard that reports results you already have, which suits owners who only need the management view.
Can I add my own KPIs or change the thresholds?
Yes. The sheets are wired for 22 KPIs, so fill the next empty row on KPI Definition and the other sheets follow. The On Target (100%), At Risk (95% to 99%) and Missed (below 95%) thresholds live in the Status formulas on KPI Dashboard and can be edited.
Is it a safety, permit or environmental compliance record?
No. Safety Incident Rate (TRIR), Permit & Regulatory Compliance and Dust & Air Quality Compliance only report the numbers you enter. The template does not verify permits, monitor air quality, log incidents or certify anything, and the figures supplied are fictional sample data.
About the Author
Built by PK — Microsoft Certified Professional with 15+ years of Excel, Google Sheets and Power BI experience. Founder of NextGenTemplates, sharing tutorials across YouTube channels. Every template is hand-built and tested before release.
Conclusion
The Demolition Services KPI Dashboard in Google Sheets gives a demolition business one monthly view of 12 KPIs, with MTD and YTD traffic lights, prior-year arrows, a twelve-month trend and a group analysis, all driven by a single month picker. It is a scorecard, not construction management or safety software, and it earns its place in the monthly review.
👉 Click here to Purchase the Demolition Services KPI Dashboard in Google Sheets
✅ Instant download · One-time payment · No subscription
🎥 Watch more tutorials: Youtube.com/@NeoTechNavigators
Last updated: September 2026