The Investment Portfolio Tracking System Web App is a role-based Google Apps Script application with 29 sidebar screens, 6 user roles, 19 filterable reports and 27 database tables. It installs with 6,676 seeded rows, including 1,111 transactions, 347 holdings and 851 valuation snapshots, so every screen shows realistic data the first time you sign in.
Most advisory practices and family offices start with a spreadsheet, and the spreadsheet stops working the moment two people edit it or a client asks for a statement. This investment portfolio tracker replaces that file with a proper multi-user system: you record transactions, prices and cashflows, and the system rebuilds FIFO holdings, cost basis, allocation and historical returns on its own.
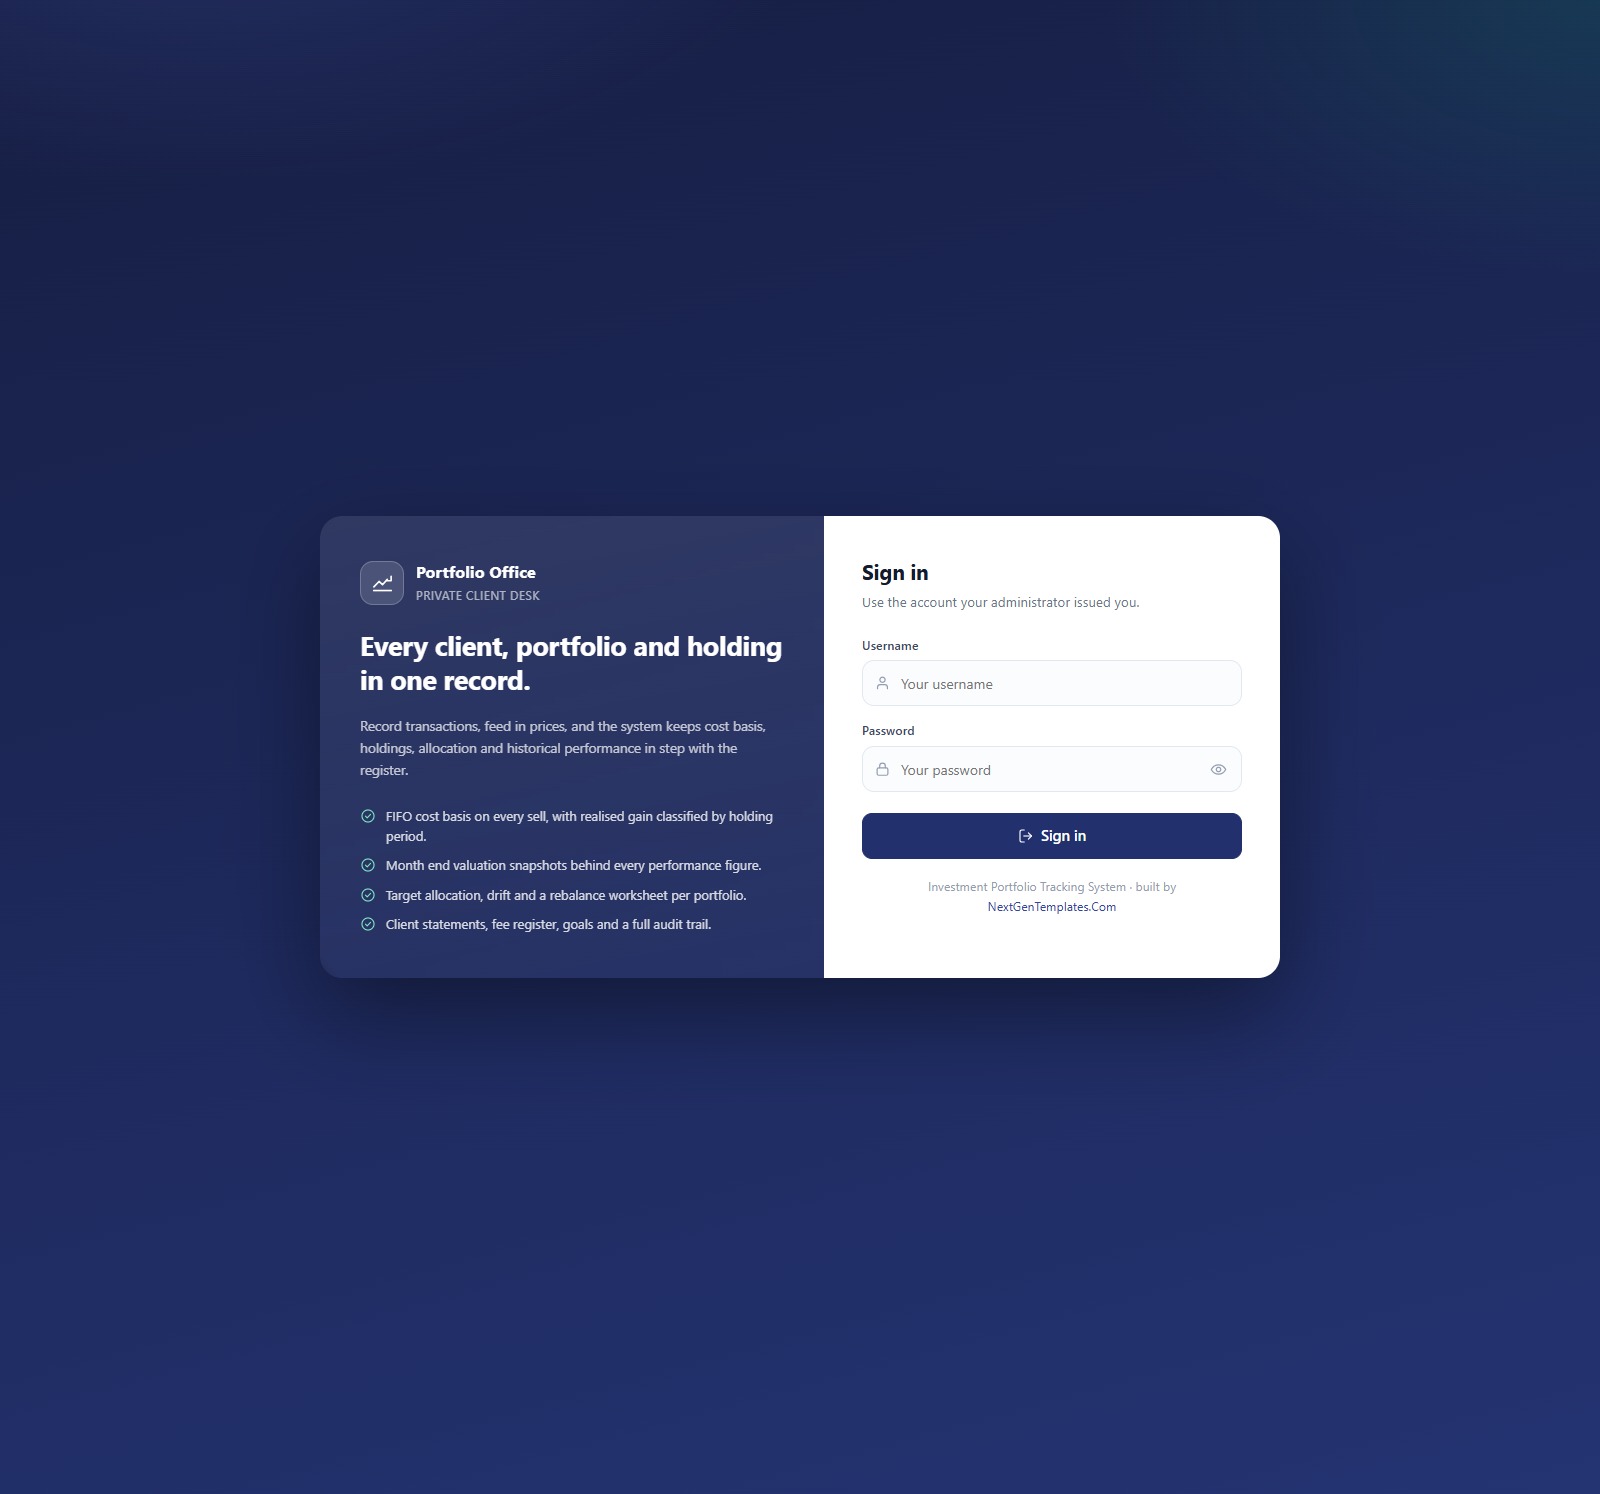
🚀 Try the Live Demo
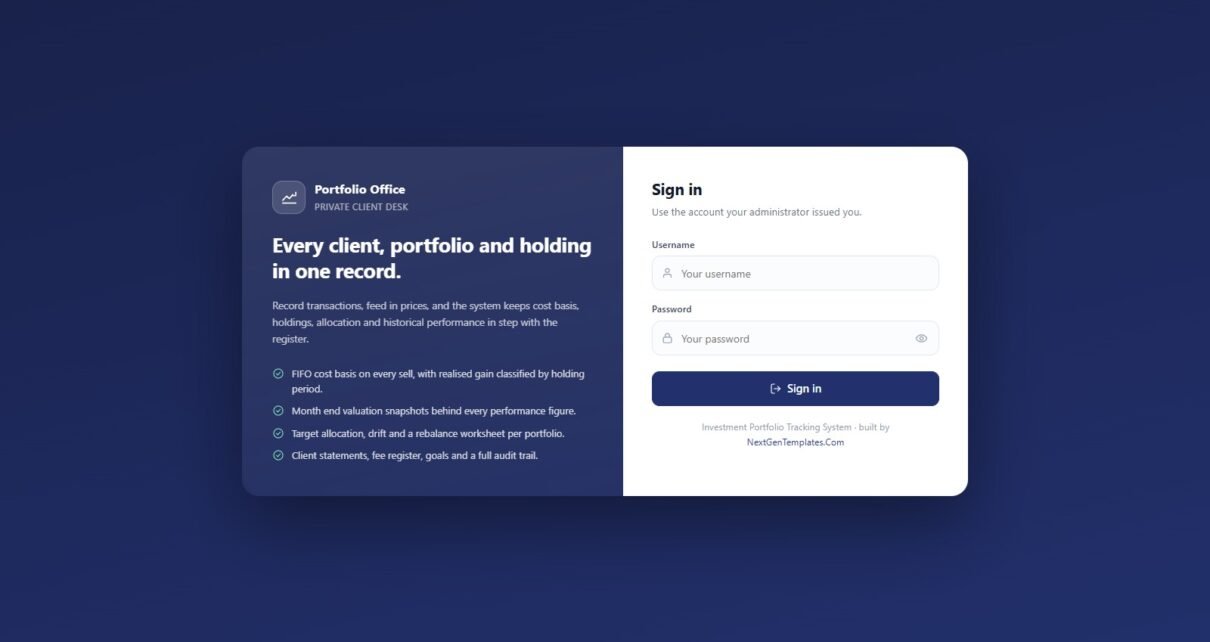
Sign in to the shared demonstration system before you buy. Start with the Auditor account to see a read-only role, then sign in as the Administrator to see every screen.
Demo sign-in accounts
| Role | Username | Password |
|---|---|---|
| Administrator | admin | Mrd#Adm2026! |
| Portfolio Manager | pmanager | Pfm#Mgr2026! |
| Research Analyst | analyst | Res#Anl2026! |
| Operations Executive | operations | Ops#Exe2026! |
| Client Servicing | servicing | Cls#Srv2026! |
| Auditor (read only) | auditor | Aud#Vwr2026! |
These credentials belong only to a seeded shared demo instance that may be reset at any time. Your purchased copy runs under your own Google account with its own database, and you change every password on day one.
Key Features of the Investment Portfolio Tracking System Web App
- Eight dashboard KPI cards. Assets Under Management, Invested Cost Basis, Unrealised Gain, XIRR Since Inception, Realised Gain (12 months), Income Received (12 months), Return Last 12 Months and Fees Outstanding, switchable from the whole book to one client.
- FIFO cost basis. Every time a transaction is saved or deleted, holdings, cost basis and valuation snapshots are rebuilt. Each sell carries its realised gain and a Short Term or Long Term classification by holding period.
- Two return measures. Money-weighted XIRR from the contributions and withdrawals you record, and annualised time-weighted return from month-end snapshots, compared against a benchmark such as NIFTY500TRI.
- Target allocation with a tolerance band. Drift is shown in percentage points and a rebalance worksheet calculates the adjustment per asset class.
- A client portfolio management system. Clients, portfolios, accounts, goals, SIPs, contributions, fees, documents and period client statements live in one record.
- Six server-enforced roles, a permission matrix, a full audit log, a database archive and a backup routine.
Screens Explained
Here are ten of the 29 screens, in the order they appear in the sidebar.
Dashboard
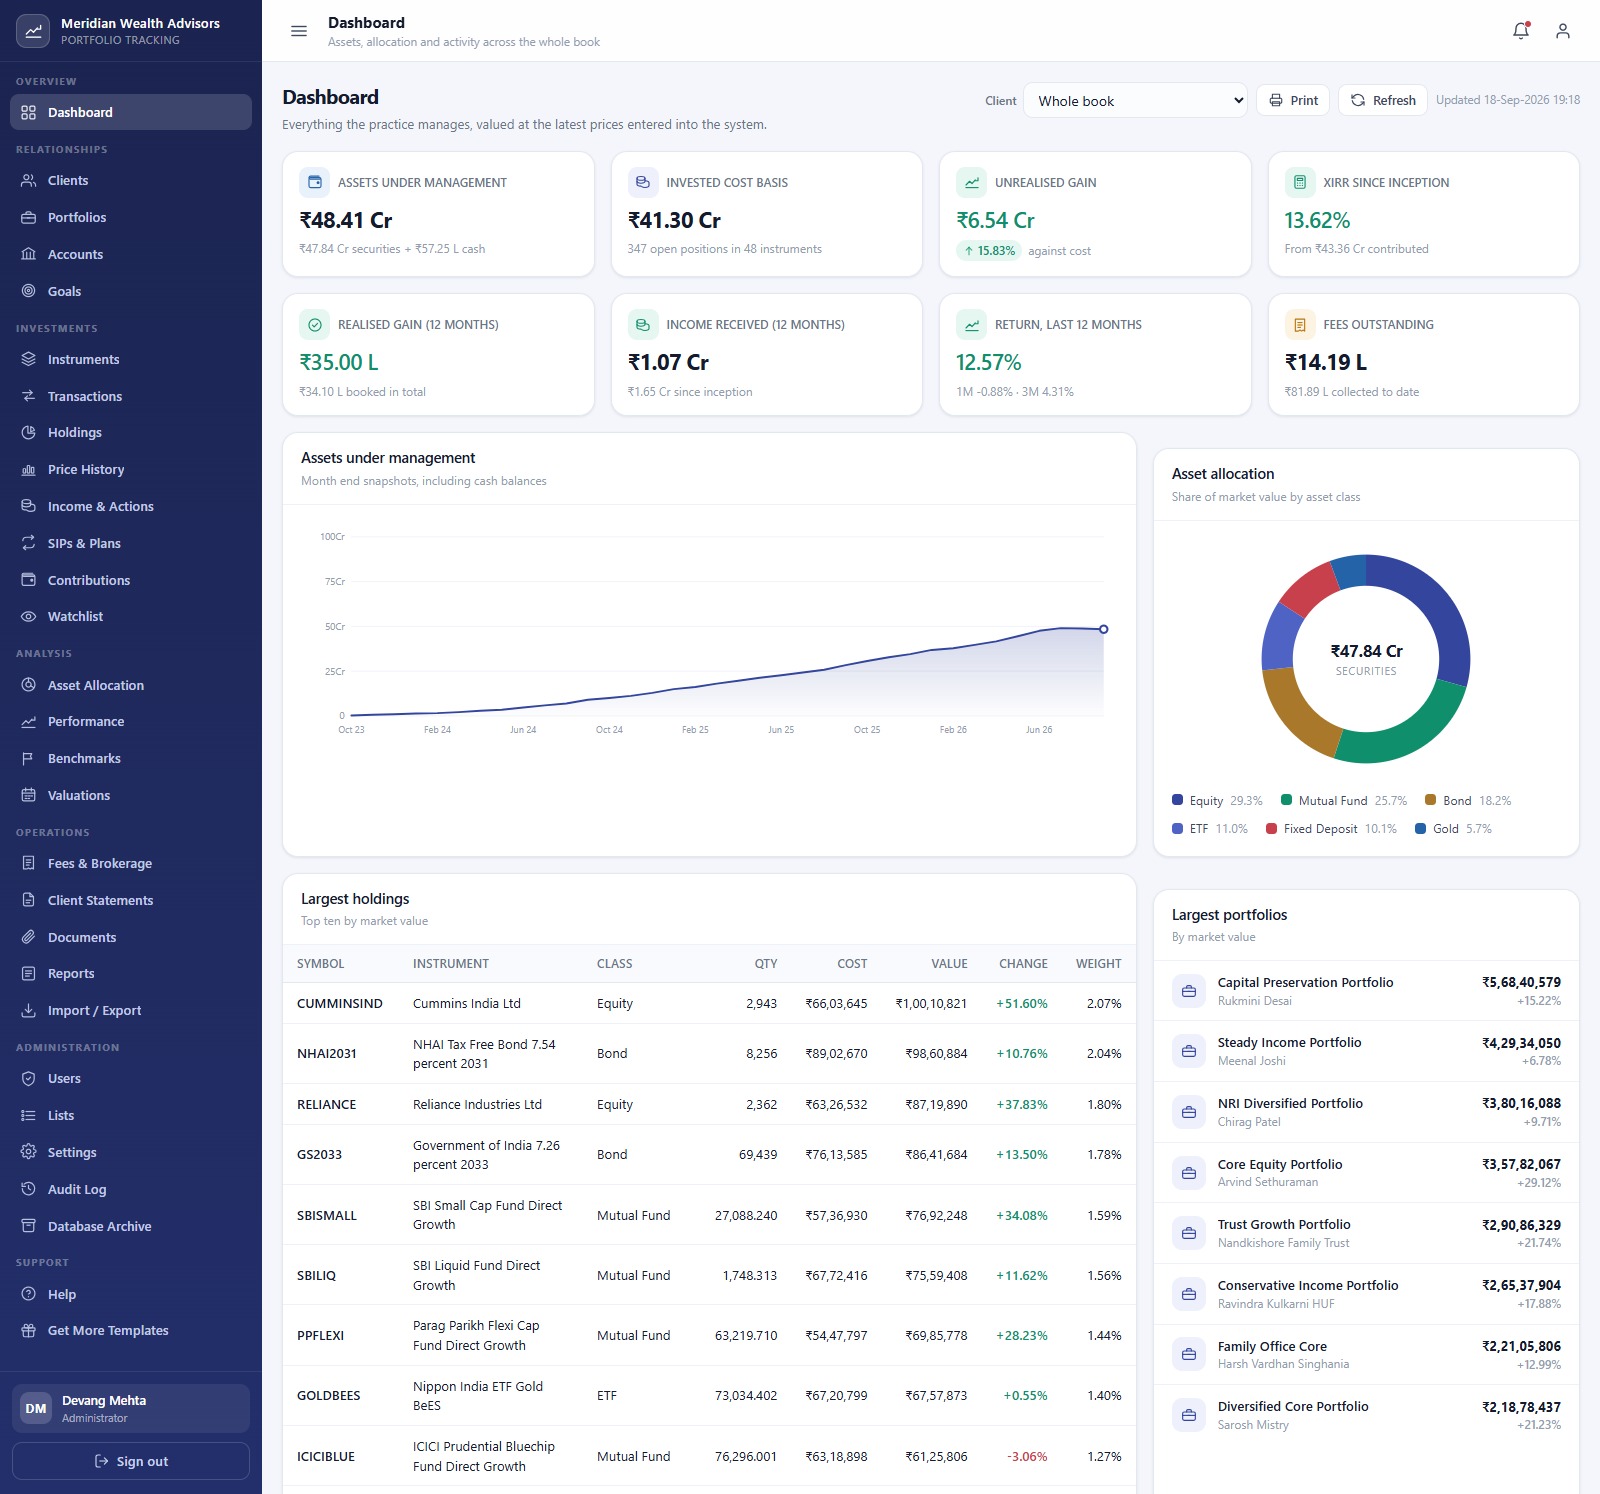
The whole book at a glance: eight KPI cards, Assets Under Management by Month (month-end snapshots including cash), Asset Allocation by Asset Class across equity, mutual fund, bond, ETF, fixed deposit and gold, the ten largest holdings by market value and the largest portfolios.
Portfolios
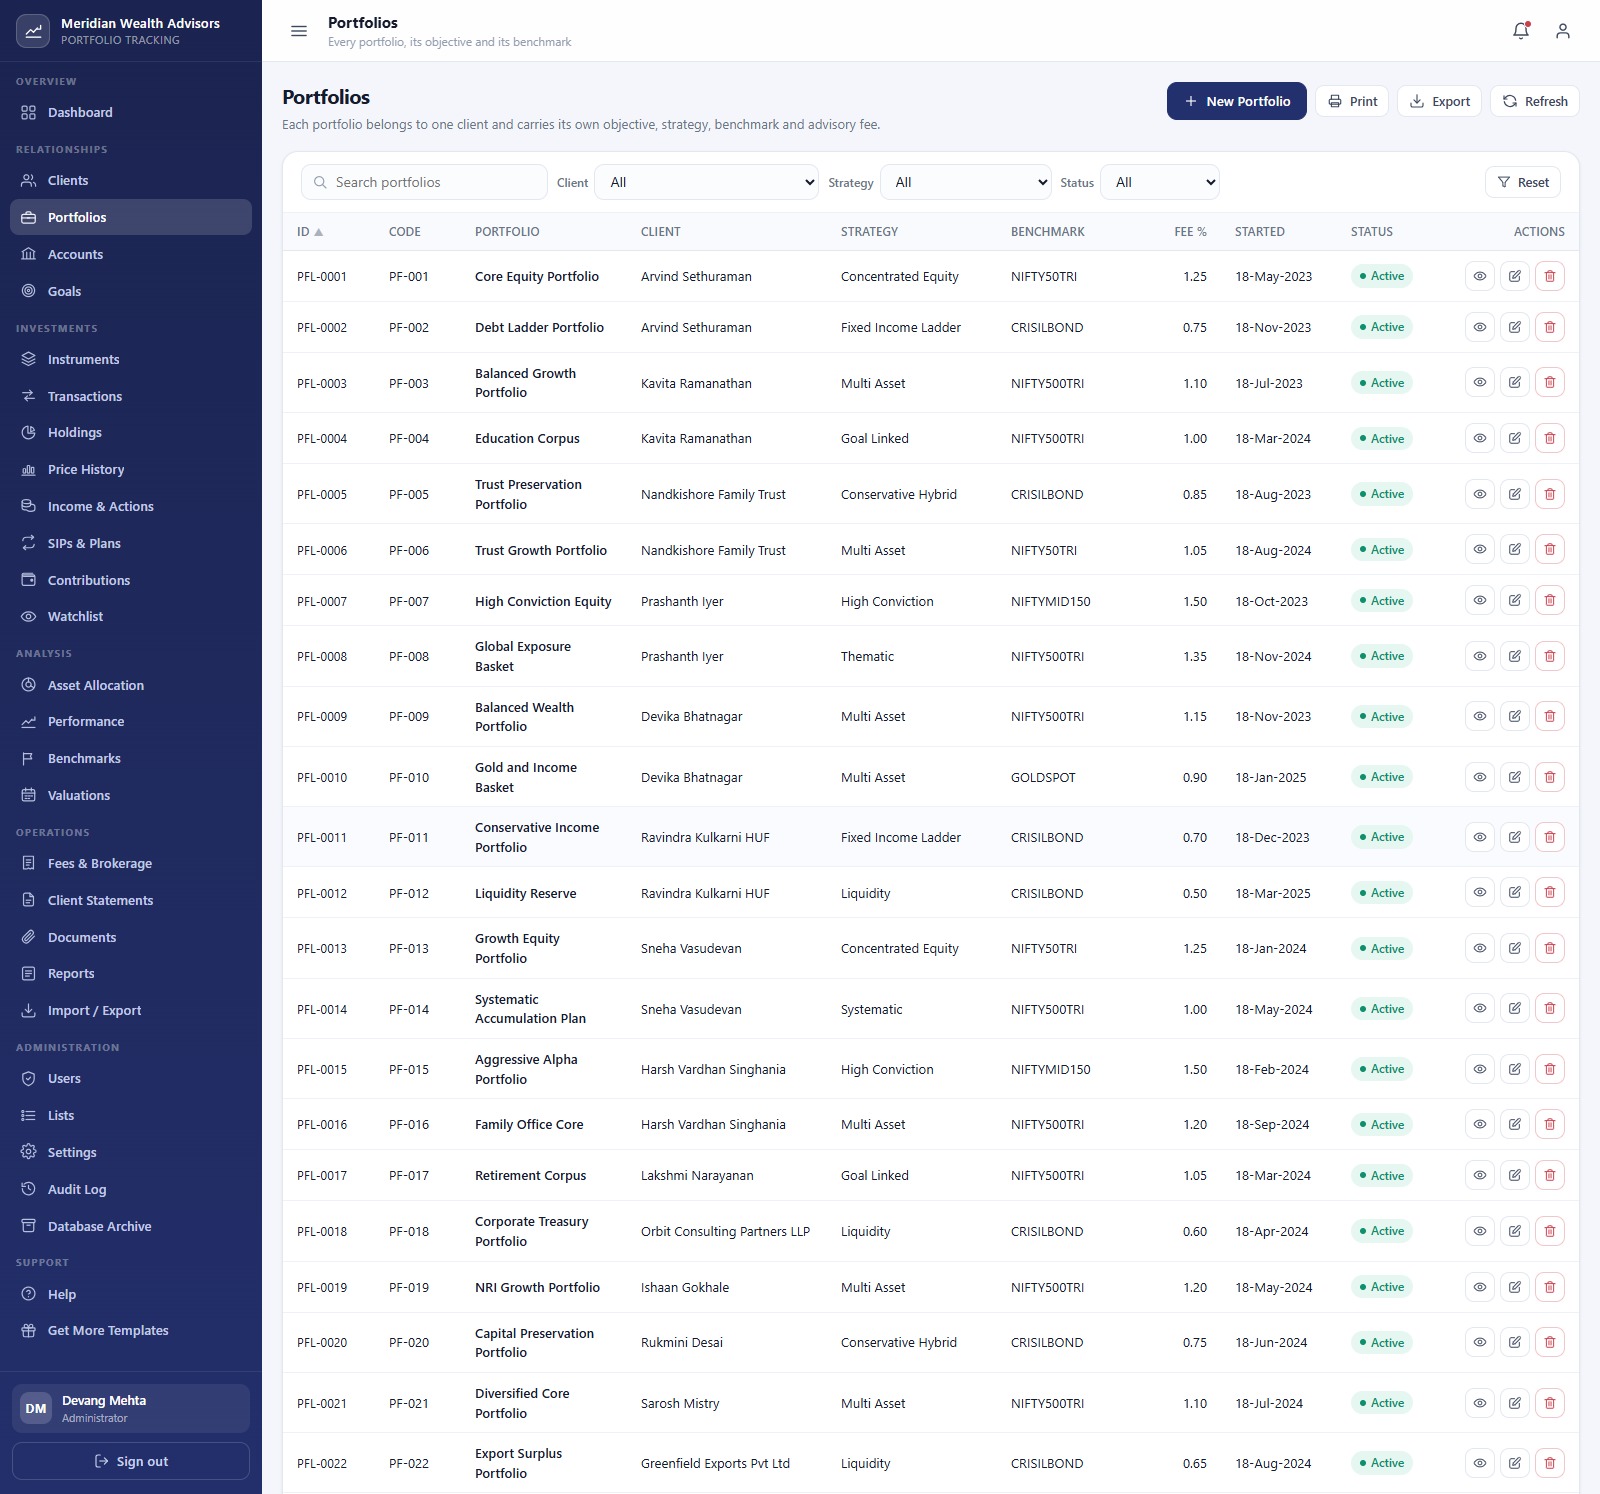
Each portfolio belongs to one client and carries its own strategy, benchmark, advisory fee percentage and start date. Search and filter by client, strategy and status, then print or export the list.
Transactions
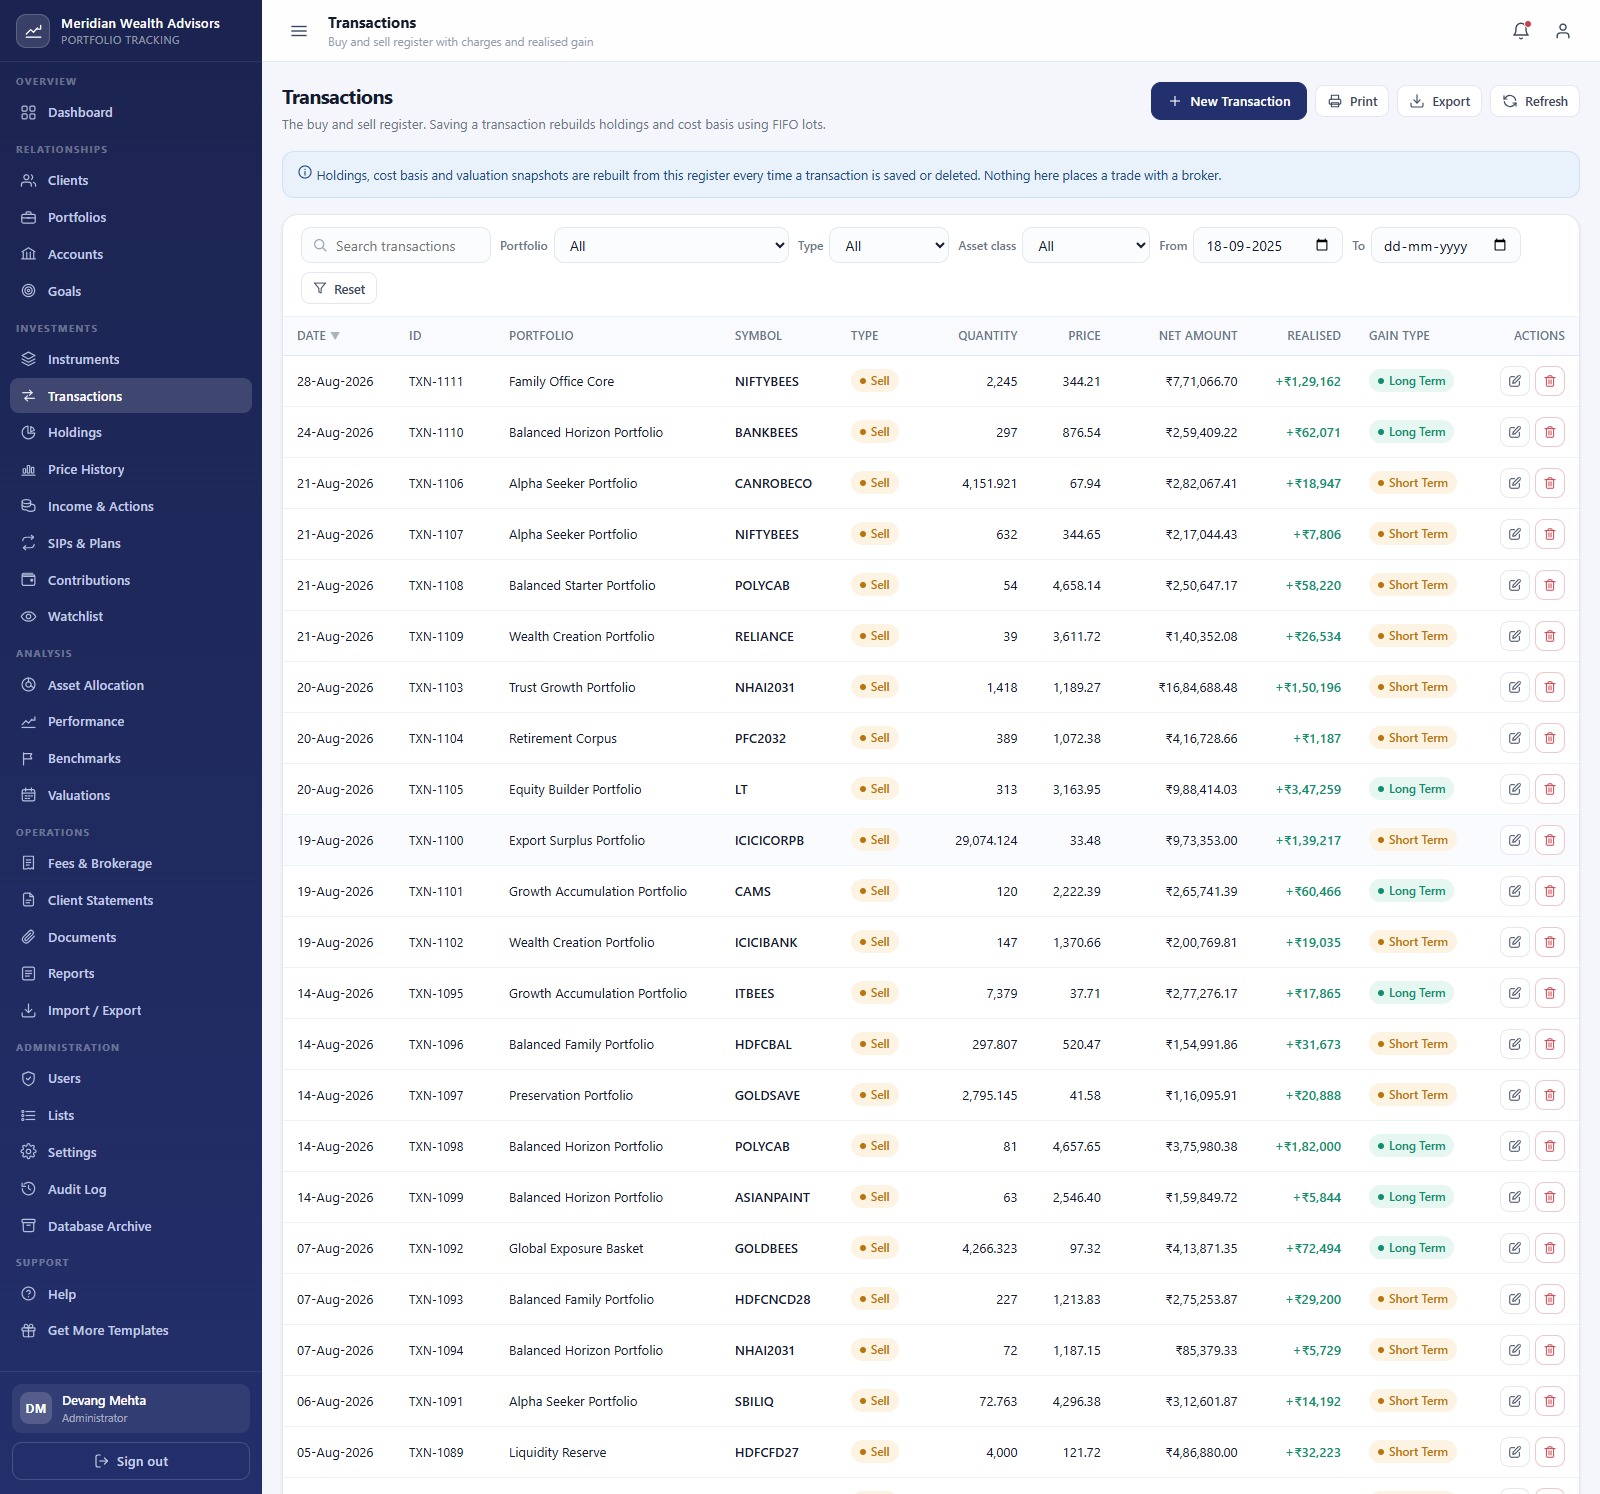
The buy and sell register shows date, portfolio, symbol, quantity, price, net amount, realised gain and gain type. A banner states plainly that nothing here places a trade with a broker.
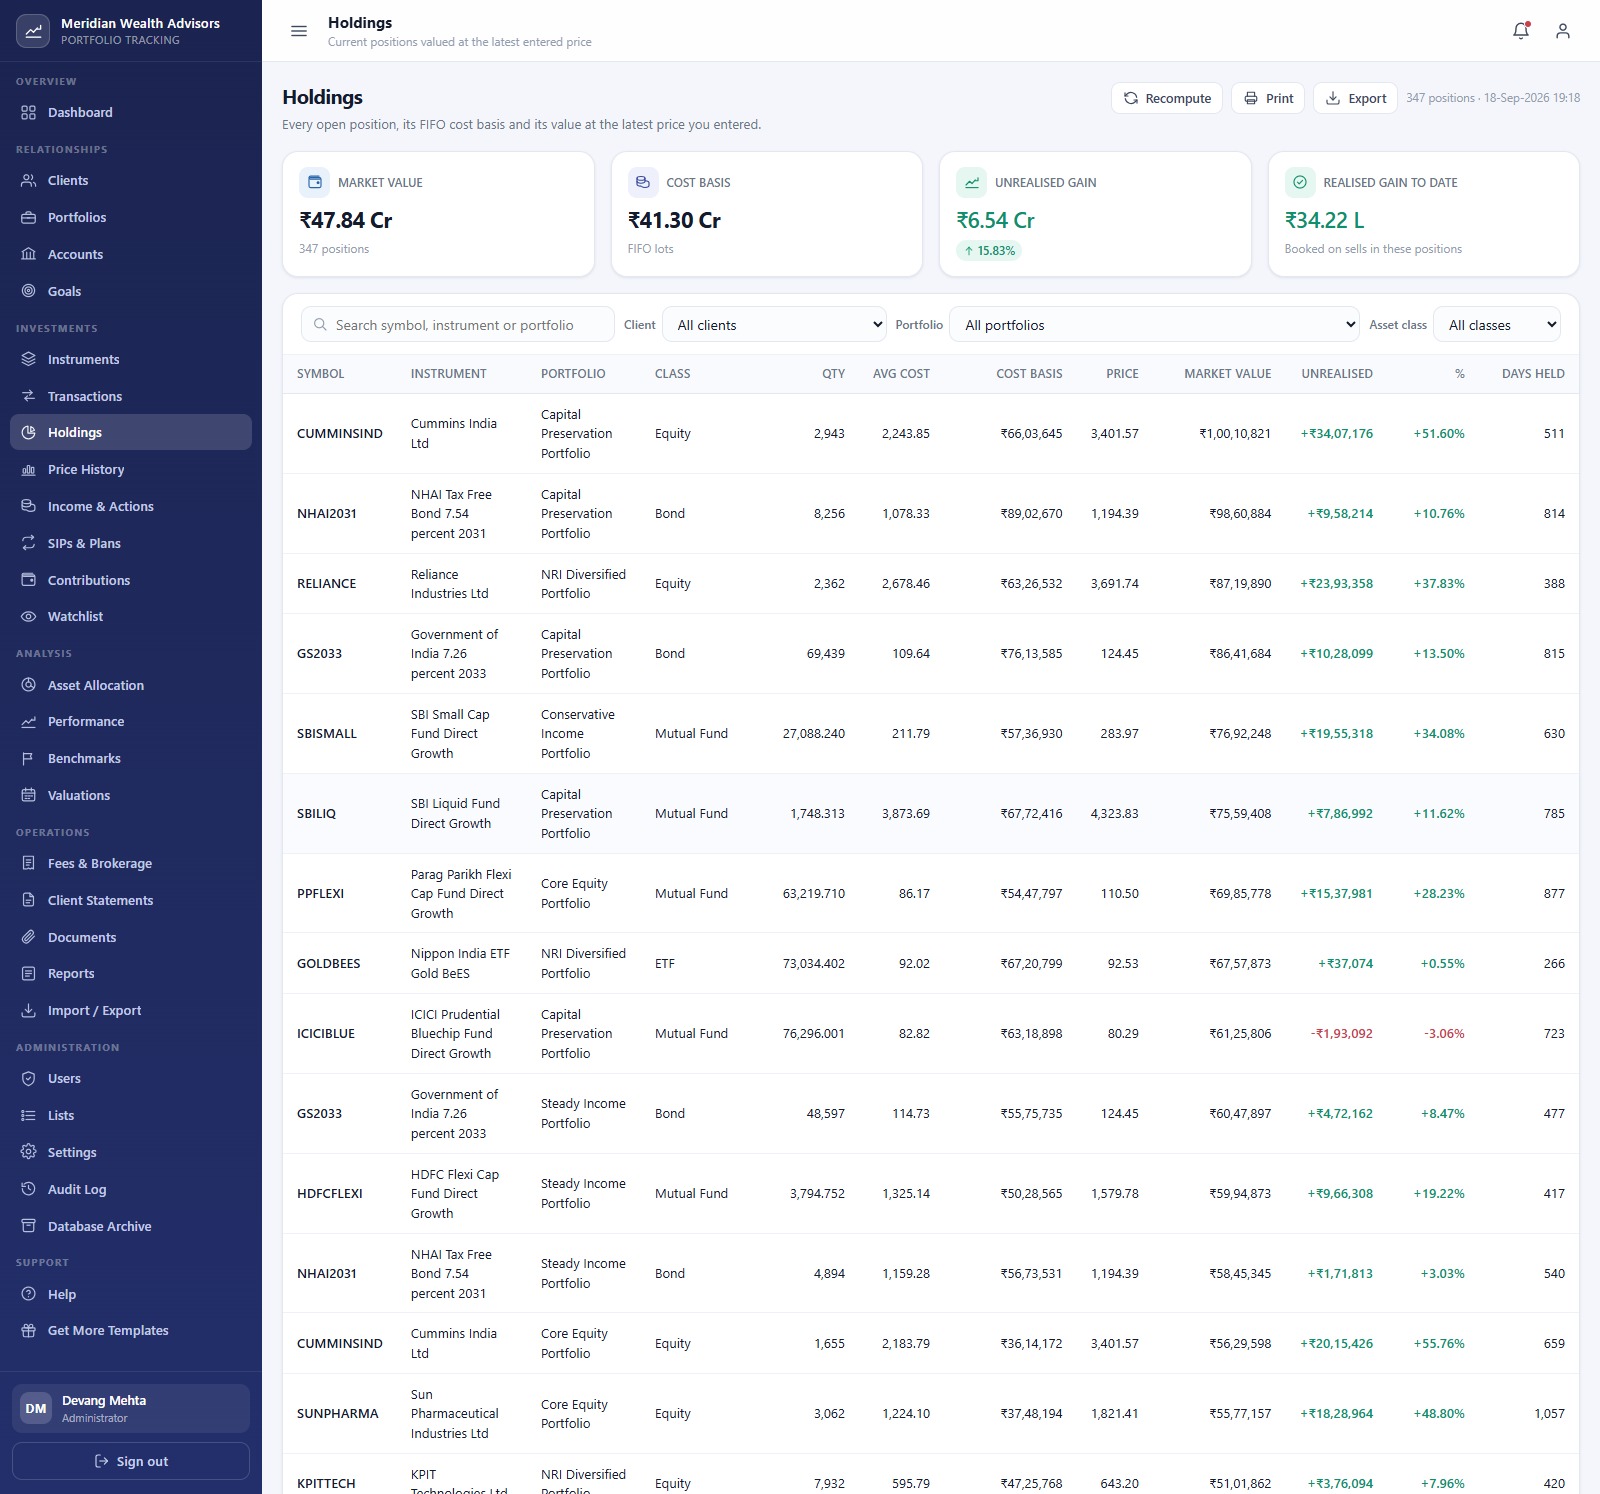
Holdings
Every open position with FIFO average cost, cost basis, latest entered price, market value, unrealised gain and days held, filtered by client, portfolio and asset class. A Recompute button rebuilds positions after an import.
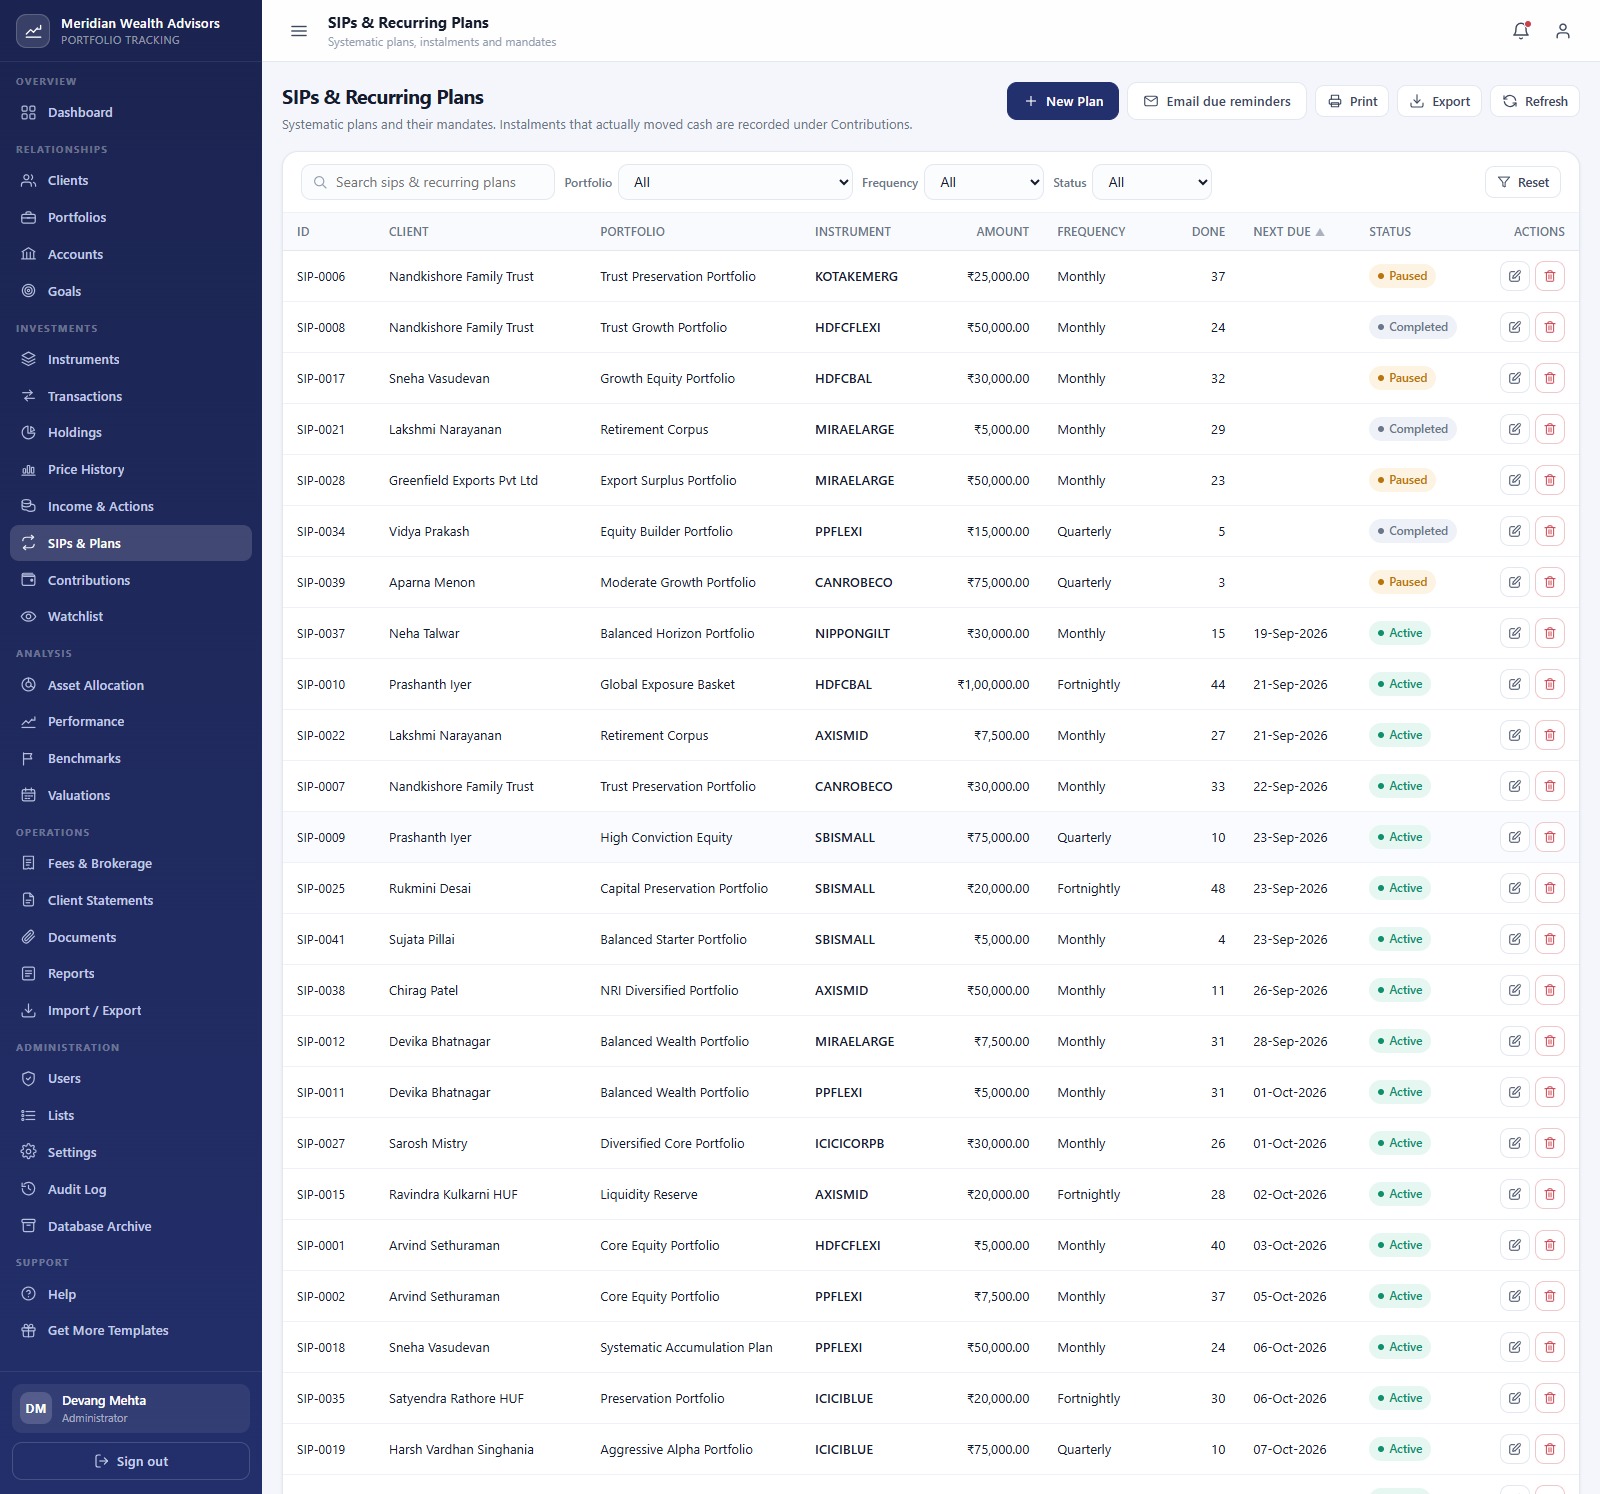
SIPs and Recurring Plans
Systematic plans with amount, frequency (monthly, fortnightly or quarterly), instalments done, next due date and status, plus an Email due reminders button. Instalments that actually moved cash are recorded under Contributions.
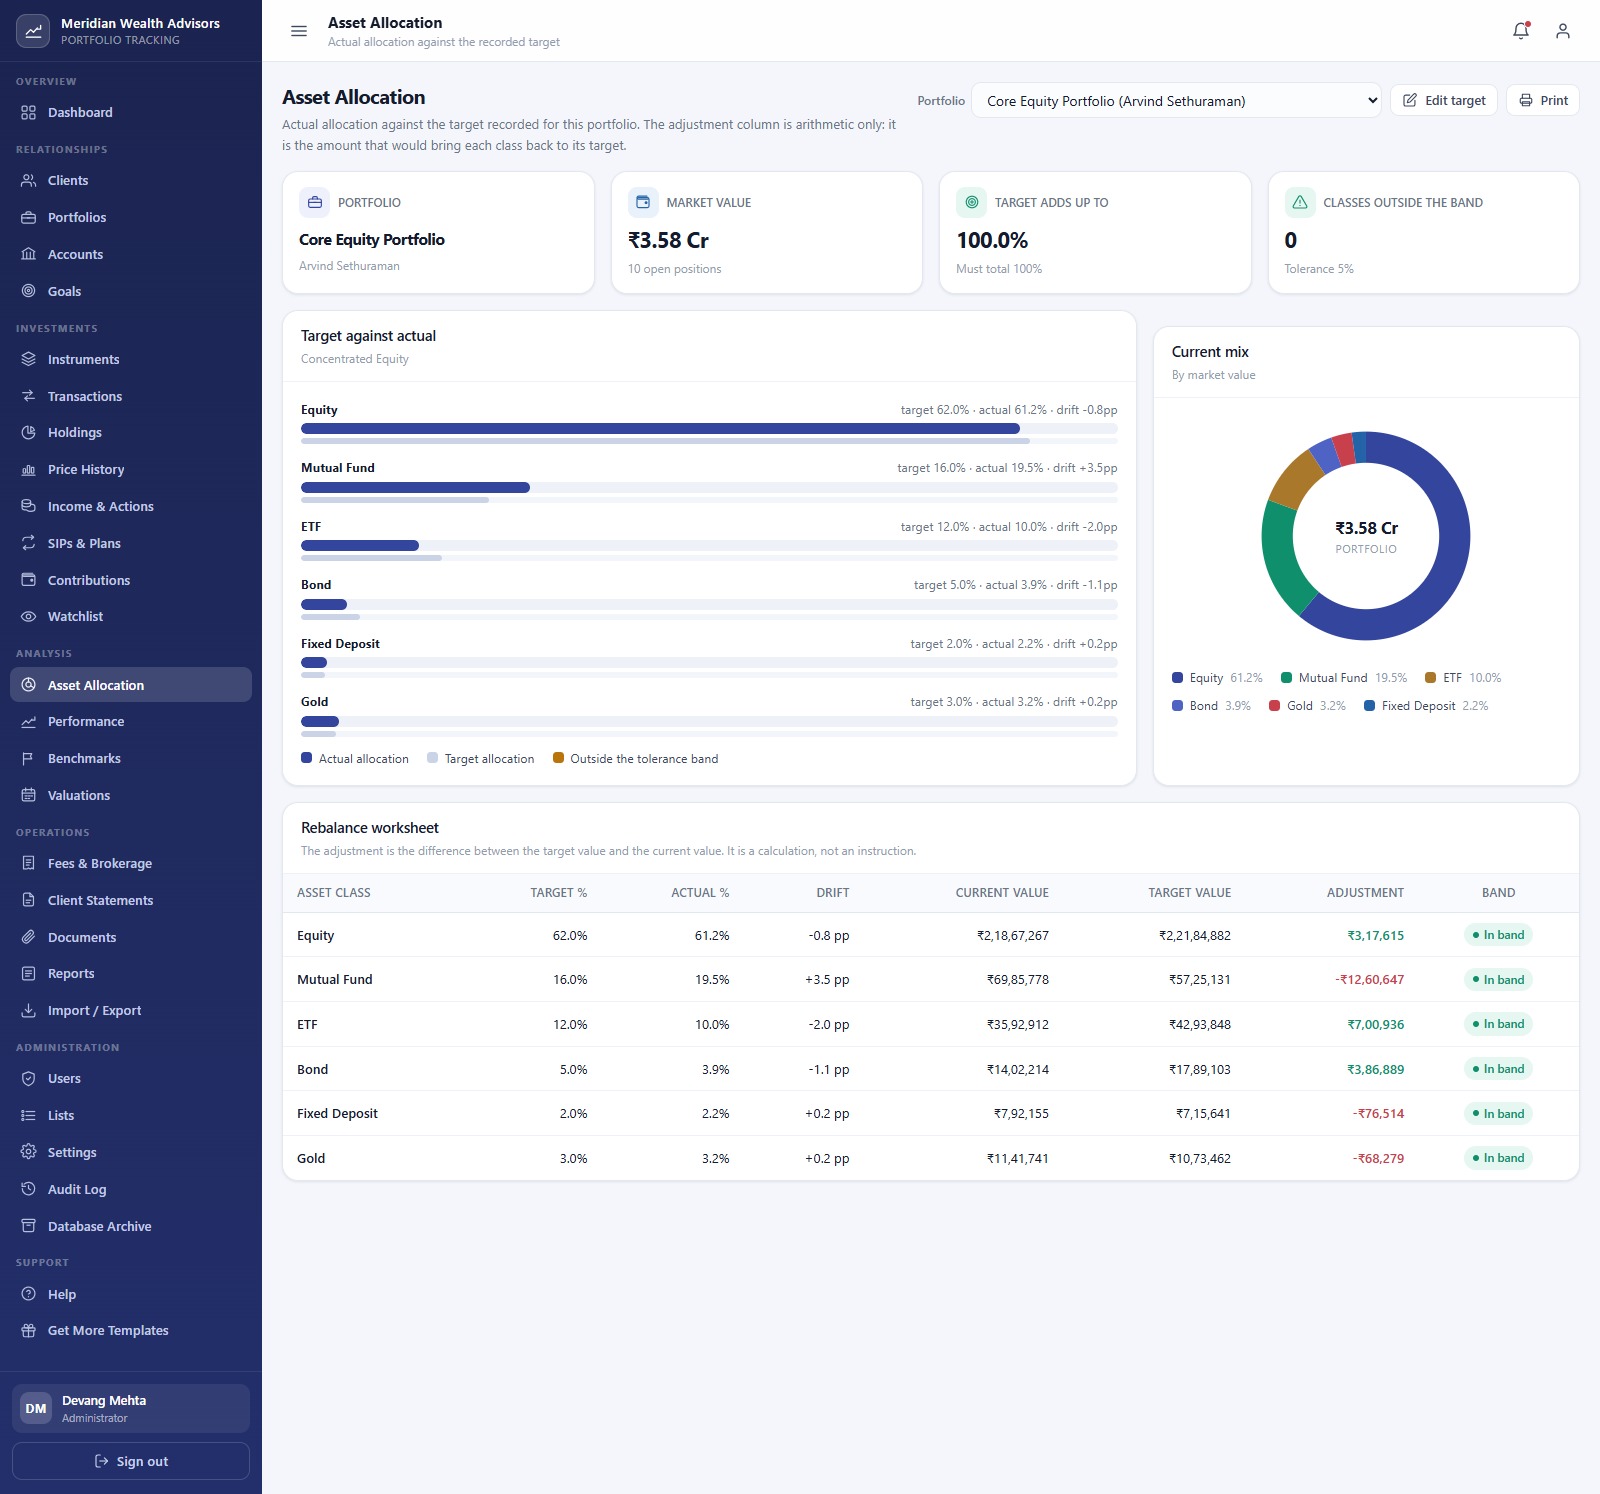
Asset Allocation
Pick a portfolio to see Target against Actual by Asset Class, a Current Mix by Market Value chart, the number of classes outside the tolerance band and the rebalance worksheet.
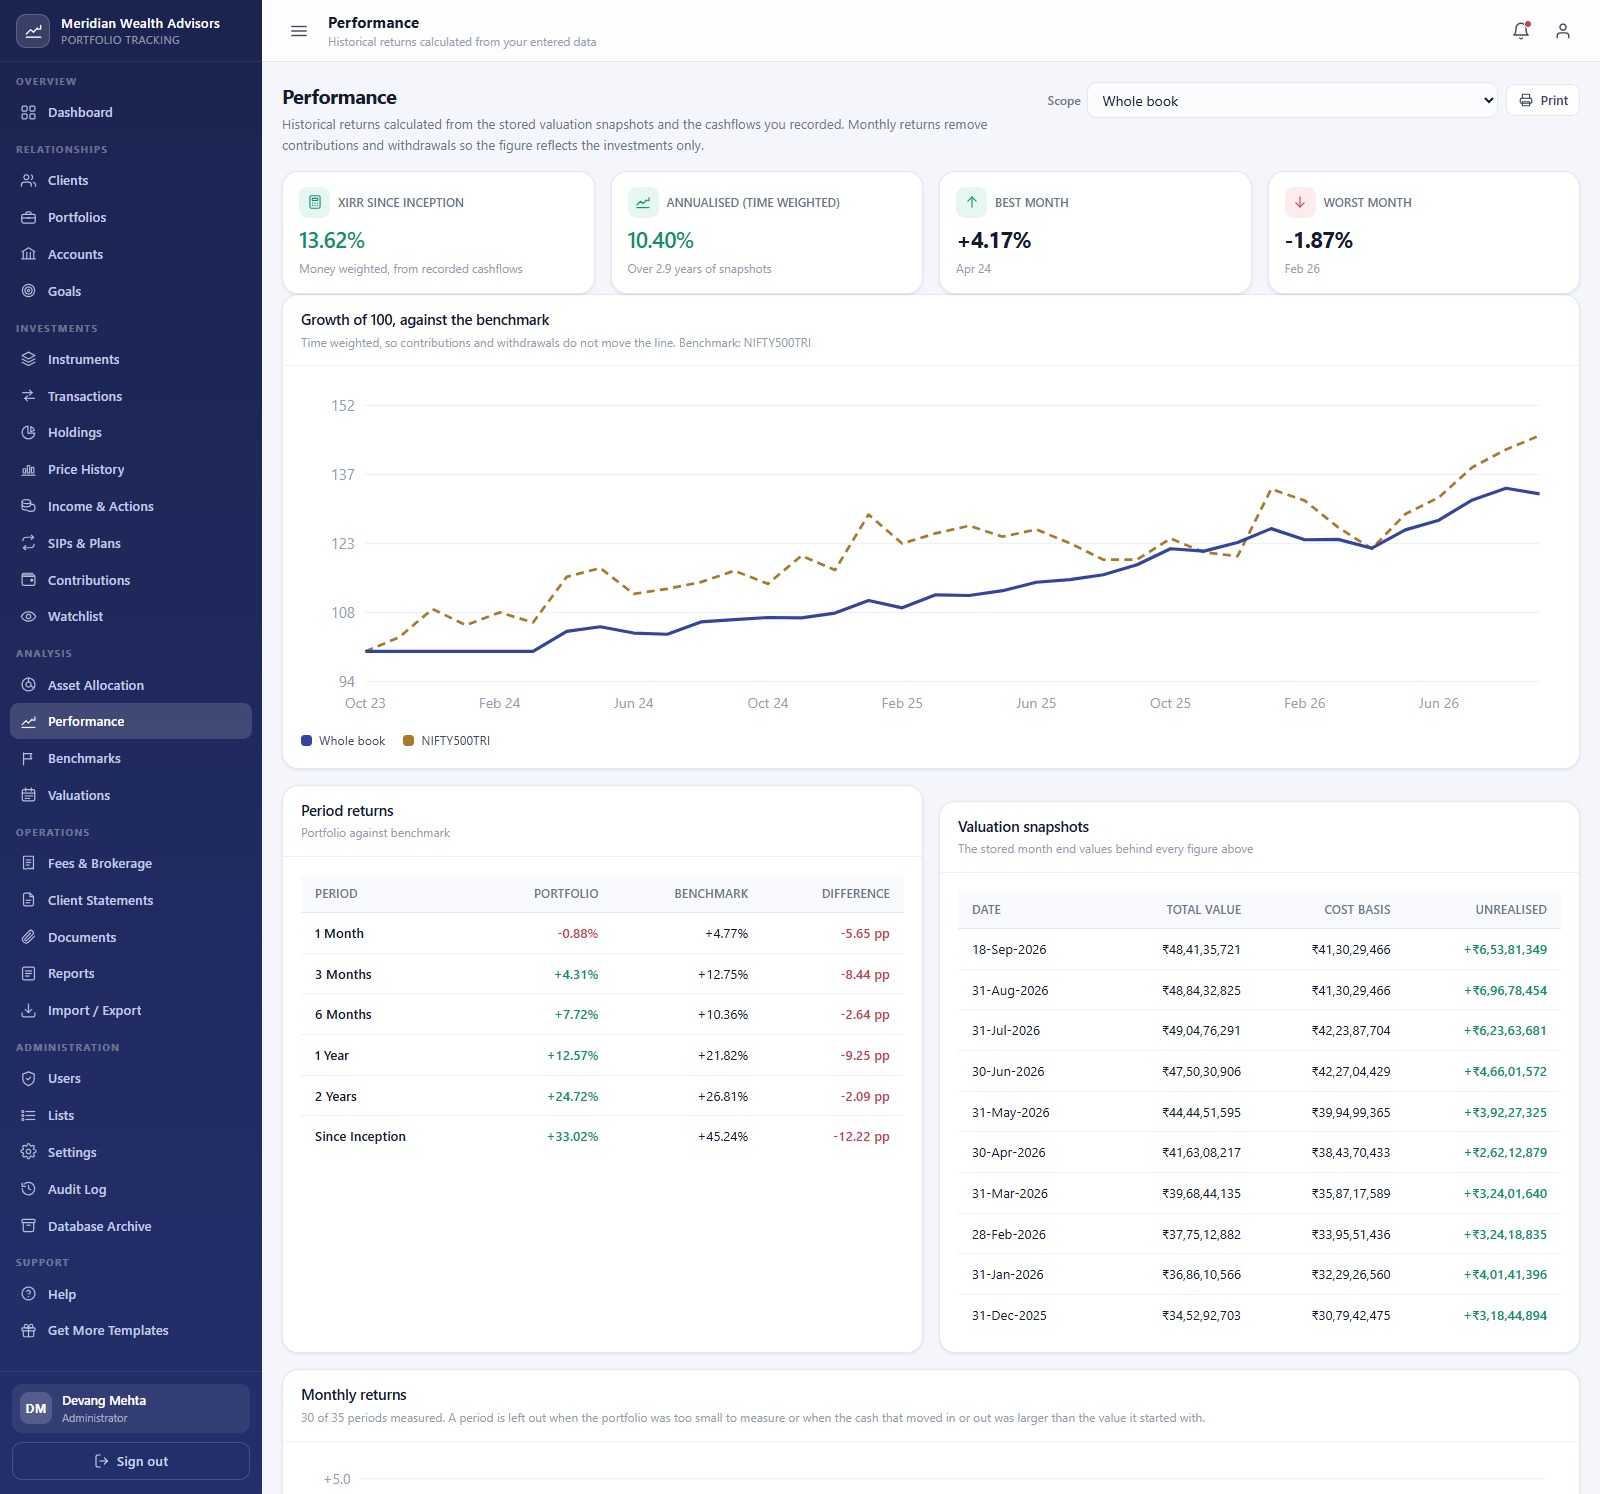
Performance
XIRR since inception, annualised time-weighted return, best and worst month, Growth of 100 against the Benchmark, Period Returns from one month to since inception, the valuation snapshots behind each figure and a monthly returns chart.
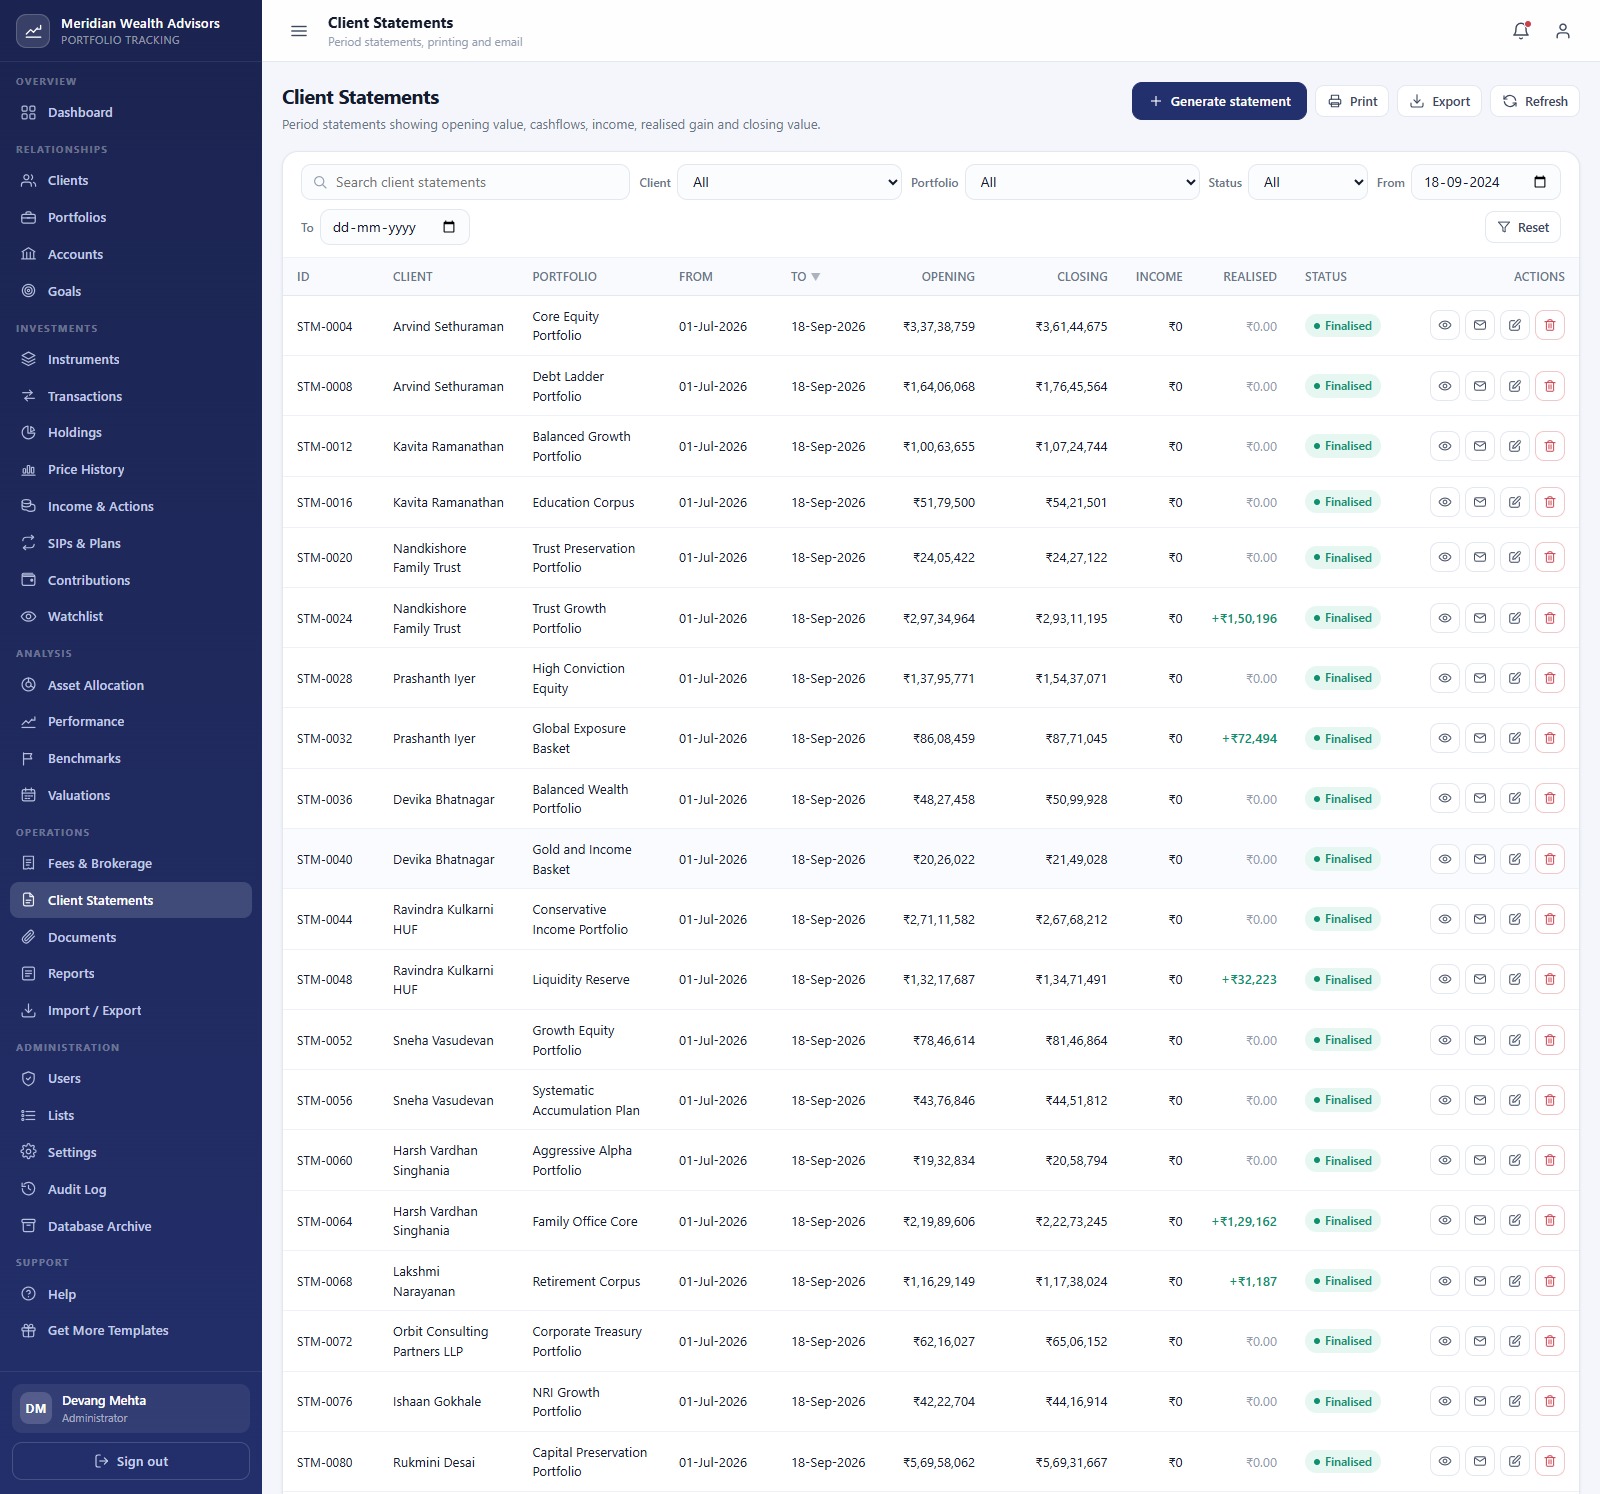
Client Statements
Period statements show opening value, income, realised gain and closing value per client and portfolio. Each can be viewed, emailed from your own Google account, edited or printed.
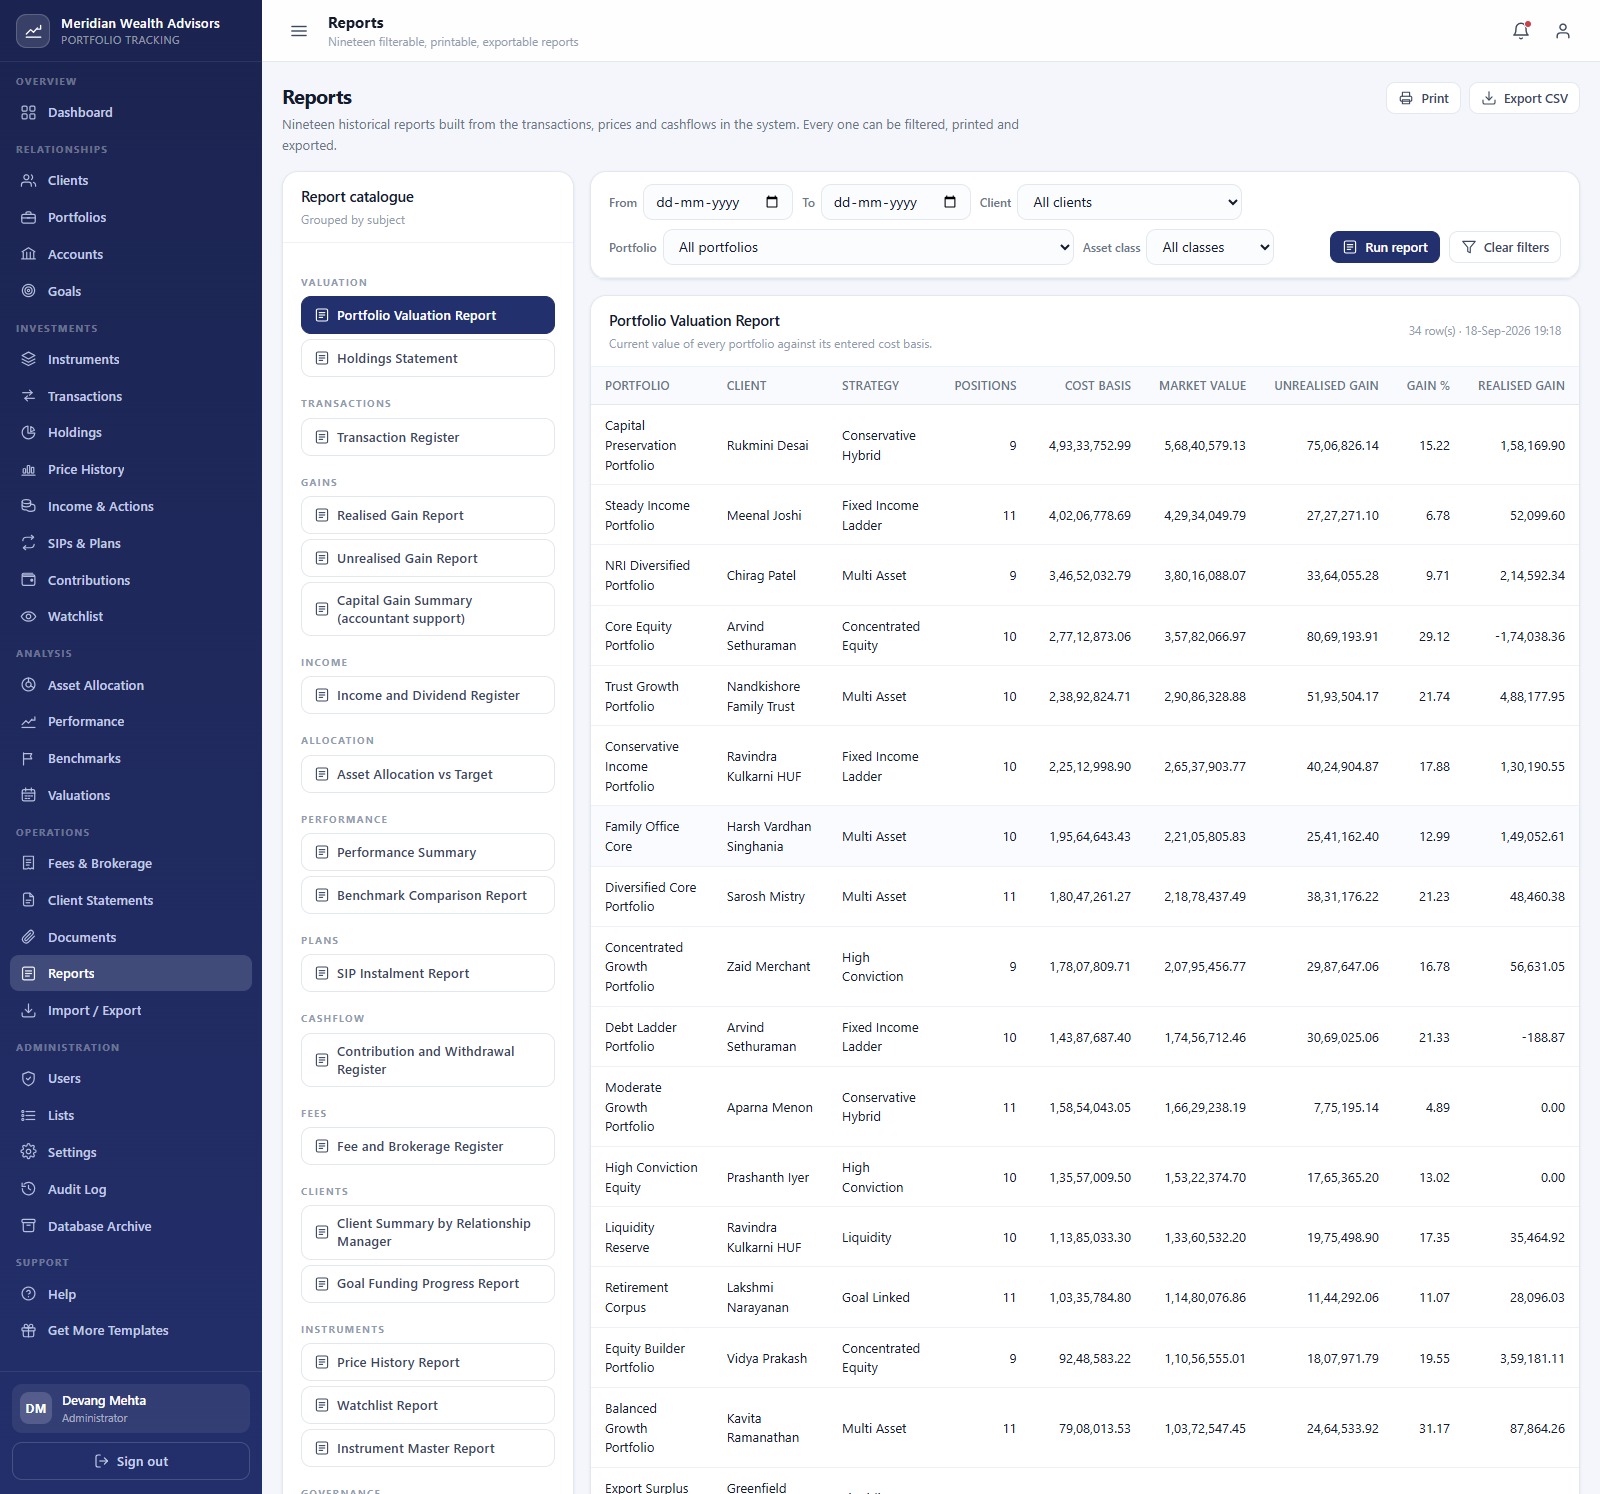
Reports
Nineteen reports in a grouped catalogue, including Portfolio Valuation, Holdings Statement, Realised and Unrealised Gain, Capital Gain Summary (accountant support), Asset Allocation vs Target, Performance Summary, Benchmark Comparison, SIP Instalment and Goal Funding Progress. Each can be filtered, printed and exported to CSV.
The remaining screens are Clients, Accounts, Goals, Instruments, Price History (with bulk month-end price entry), Income & Actions, Contributions, Watchlist, Benchmarks, Valuations, Fees & Brokerage, Documents, Import / Export, Users, Lists, Settings, Audit Log, Database Archive, Help and Get More Templates.
Investment Portfolio Tracking System Web App vs. Spreadsheet Tracker vs. Paid Portfolio Software
| Feature | This web app | Excel / Sheets tracker | Addepar / Orion / Black Diamond |
|---|---|---|---|
| Cost | ✅ One-time purchase | One-time or free | Annual contract |
| Platform | Browser, your Google account | Spreadsheet file | Vendor cloud |
| Multi-user roles | ✅ 6, server-enforced | File sharing only | ✅ Yes |
| FIFO cost basis | ✅ Automatic | Manual formulas | ✅ Yes |
| XIRR and time-weighted return | ✅ Built in | Build it yourself | ✅ Yes |
| Live market data | No, prices entered or imported | Possible with formulas | ✅ Yes |
| Client statements and reports | ✅ 19 reports, print and email | No | ✅ Yes |
| Data ownership | ✅ Your Google Drive | ✅ Your file | Vendor hosted |
| Editable source code | ✅ Full Apps Script | ✅ Formulas | No |
For small practices that want a wealth management web app without an enterprise contract, this web app sits in the sweet spot.
Who Should Use This System
Perfect for:
- Independent advisers and small wealth desks looking after 10-100 client portfolios
- Family offices that want goals, SIPs, fees and statements in one place
- Teams who want a Google Apps Script portfolio tracker they own and can customise
Not a fit if:
- You need order placement with a broker or exchange; the system never places trades
- You need live or streaming market prices; there is no market data feed
- You want investment advice, recommendations or a statutory tax filing
Real-World Use Cases
Anita runs a three-person advisory practice. At month end her operations executive uses bulk price entry to post every closing price in one pass. Anita then generates client statements, checks each portfolio’s drift on the Asset Allocation screen and emails statements straight from the system.
Rohan manages a family office. Four generations of goals, from education funds to retirement, sit on the Goals screen with funded percentages and status. The Auditor login lets the family’s accountant review everything without being able to change a record.
A boutique research desk uses the Research Analyst role to maintain instruments, price history, benchmarks and the watchlist, while portfolio managers work on transactions and allocation.
Advantages of This Web App
- One-time cost. No per-user or per-account subscription fees.
- Everything reconciles. Holdings are the FIFO sum of buys minus sells, market value is quantity times the latest price and allocation totals exactly 100%.
- Your data stays yours. The database is a Google Sheet in your own Drive, with a dated backup function and a database archive.
- Configurable. Settings covers the currency code and symbol, print size (3 inch, 4 inch or A4) and email switches.
Opportunities for Improvement
- Prices must be entered or imported; there is no automatic market data connection.
- The seeded demo is built around Indian instruments and rupees, so international users should clear the sample data and adjust the currency in Settings.
- After a bulk import, valuation snapshots should be rebuilt from the Valuations screen so performance figures line up again.
- As with any Apps Script web app, very large books are bounded by Google’s execution quotas; see the Apps Script quotas documentation.
Best Practices
- Try the live demo first so you know which role each colleague needs.
- Change all six default passwords and delete accounts you will not use.
- Record contributions and withdrawals on the day the cash moved; XIRR and time-weighted return depend on it.
- Use bulk price entry at every month end so snapshots stay complete.
- Run the backup function before large imports. Deployment follows Google’s standard Apps Script web app guide.
Explore Relevant Templates
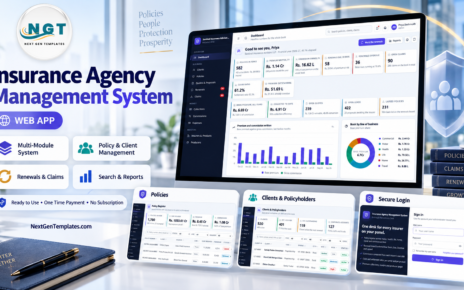
Prefer a lighter single-user tool? The Investment Tracker in Google Sheets and the Mutual Fund and SIP Tracker are plain spreadsheets, and the Personal Investment KPI Dashboard summarises returns on one page. For practice-level analytics, read about the Wealth Management Dashboard in Google Sheets. Another role-based system in the same family is the Insurance Agency Management System Web App.
On the store: Chit Fund Management System Web App, Stock Portfolio Tracker in Google Sheets and all Web App templates.
Frequently Asked Questions
Can I try the Investment Portfolio Tracking System Web App before buying?
Yes. The live demo above has six seeded accounts, one per role, from Administrator to a read-only Auditor. The demo is shared and resets, so explore freely but do not enter real client information there.
Does it fetch live prices or place trades?
No. It is a tracking and record-keeping system. It is fed prices and transactions by its users, never connects to a broker or exchange, and gives no investment advice or forecasts.
How is XIRR different from the time-weighted return?
XIRR is money-weighted and uses the contributions and withdrawals you record, so it reflects when cash went in. The time-weighted return strips those cashflows out using month-end snapshots, so it measures the investments alone and is the fairer comparison against a benchmark.
How long does setup take?
Creating the Apps Script project, pasting Code.cs.txt and Index.txt and deploying takes around 10 minutes. First-time setup then builds the database and seed; a large seed can take a few minutes and resumes automatically after Apps Script’s six-minute limit.
How does this compare to paid portfolio software?
Enterprise platforms add custodian feeds, live data and compliance tooling for an annual fee. This web app is a one-time purchase running in your Google account, aimed at smaller teams that enter their own data.
Is the capital gain summary a tax return?
No. The Capital Gain Summary report is prepared to support your accountant. It is not a statutory filing and nothing is submitted to any authority.
About the Author
Built by PK, Microsoft Certified Professional with 15+ years of Excel, Google Sheets, Apps Script and Power BI experience. Founder of NextGenTemplates, reaching 300K+ subscribers across YouTube channels. Every template is hand-built and tested before release.
Conclusion
The Investment Portfolio Tracking System Web App gives a small practice the parts of an enterprise platform it actually uses: FIFO holdings, XIRR and time-weighted returns, target allocation, client statements and 19 reports, behind six proper roles. Try the live demo, then deploy your own copy.
👉 Click here to Purchase the Investment Portfolio Tracking System Web App
✅ Instant download · One-time payment · No subscription
🎥 More tutorials: Youtube.com/@NeoTechNavigators
Last updated: September 2026