Building and nurturing relationships with your alumni community is a cornerstone of any educational institution’s long-term success. From fostering lifelong connections to driving fundraising, job placements, and event participation, every engagement counts. However, managing all these activities manually often leads to missed opportunities and scattered data.Alumni Engagement KPI Dashboard in Google Sheets
That’s where the Alumni Engagement KPI Dashboard in Google Sheets comes in — a smart, ready-to-use solution that simplifies tracking, analyzing, and improving alumni engagement performance.
In this detailed blog post, we’ll explore what this dashboard is, how it works, what its key features are, and why it’s an indispensable tool for modern educational institutions.
Click to buy Alumni Engagement KPI Dashboard in Google Sheets
What Is an Alumni Engagement KPI Dashboard in Google Sheets?
An Alumni Engagement KPI Dashboard in Google Sheets is a dynamic analytics template designed to help universities, colleges, and educational foundations monitor alumni-related key performance indicators (KPIs).
It consolidates all engagement data — donations, event participation, volunteer involvement, networking initiatives, and communication metrics — into one intuitive, shareable dashboard.
Instead of juggling multiple spreadsheets or outdated reports, this dashboard automatically updates metrics, visualizes trends, and provides actionable insights.Alumni Engagement KPI Dashboard in Google Sheets
With just a few clicks, administrators can identify which programs resonate most with alumni, where participation is dropping, and what initiatives drive long-term relationships.Alumni Engagement KPI Dashboard in Google Sheets.
Why Alumni Engagement Matters
Alumni engagement is more than just organizing reunions or sending newsletters. It directly impacts:
- Fundraising success — engaged alumni contribute more often and in higher amounts.
- Institutional reputation — active alumni networks enhance visibility and attract new students.
- Career development — alumni referrals and mentorships support student placements.
- Community building — continuous interaction fosters loyalty and brand advocacy.
Tracking these outcomes manually is tedious and error-prone. A KPI dashboard transforms this process into a data-driven, automated system.Alumni Engagement KPI Dashboard in Google Sheets
Key Features of the Alumni Engagement KPI Dashboard in Google Sheets
This powerful dashboard consists of seven structured worksheets, each designed for a specific purpose. Let’s break them down one by one.
Dashboard Sheet Tab – The Main Control Center
This is the heart of the entire dashboard. Here’s what makes it special:
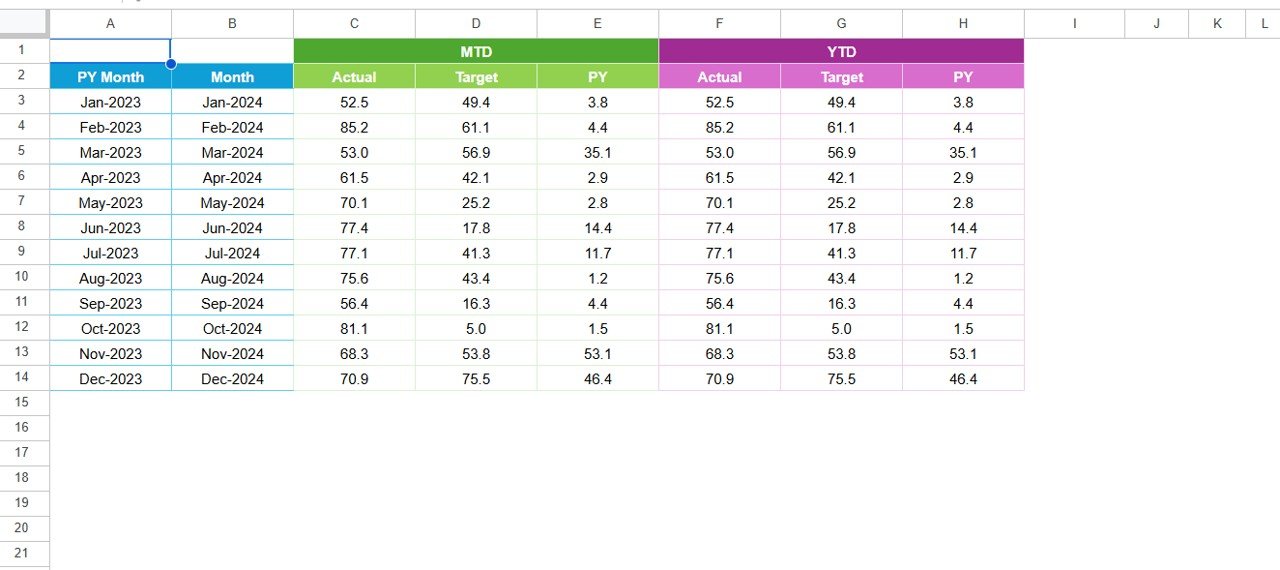
- Month Selector (Range D3): Choose any month from the dropdown to instantly update all metrics.
- Dynamic KPIs: Automatically display MTD (Month-to-Date) and YTD (Year-to-Date) performance.
- Comparative Analysis: View Actual vs Target and Previous Year vs Current Year comparisons.
- Visual Indicators: Up and down arrows highlight performance trends with conditional formatting.
- Real-Time Insights: Instantly see where your alumni programs stand at any given time.
This sheet provides a bird’s-eye view of alumni engagement, donations, communication reach, and event success.

Click to buy Alumni Engagement KPI Dashboard in Google Sheets
Trend Sheet Tab – Visual Performance Insights
The Trend Sheet Tab brings your KPIs to life with interactive charts.
- Dropdown Selection (Cell C3): Choose any KPI to analyze its detailed trend.
- Detailed KPI Info: Displays the KPI Group, Unit, Type (UTB or LTB), Formula, and Definition.
- Trend Charts: Visualize MTD, YTD, Target, and Previous Year numbers.
- Performance Storytelling: Quickly identify months of growth, stagnation, or decline.
Whether it’s donation frequency or event participation rate, this sheet helps you spot trends and act fast.

Click to buy Alumni Engagement KPI Dashboard in Google Sheets
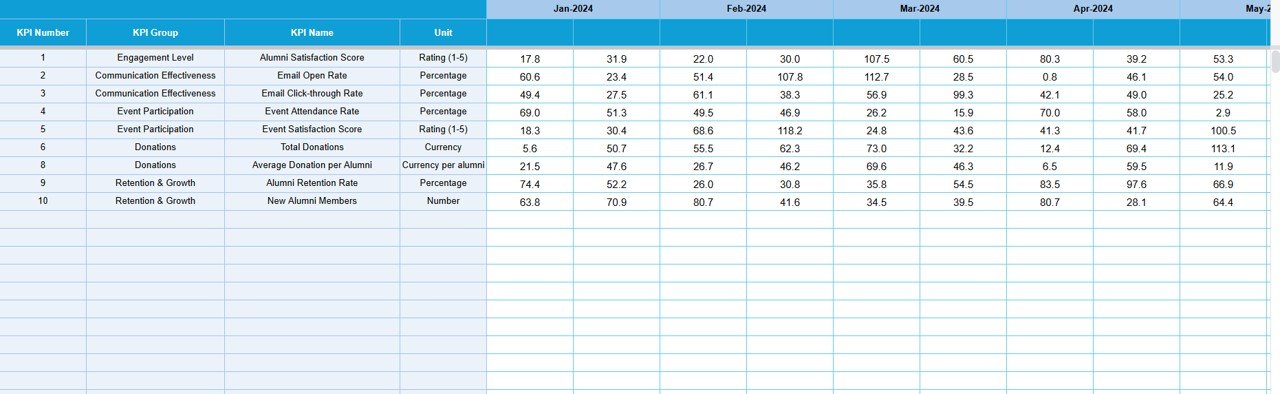
Actual Numbers Input Sheet – Feed Your Data
Every dashboard needs data to run, and this is where you input it.
- Enter MTD and YTD actuals for each KPI.
- Adjust the starting month in range E1 to match your fiscal or academic year.
- Simple structure allows easy monthly updates without technical knowledge.
This design ensures your dashboard always reflects the latest alumni engagement performance.

Click to buy Alumni Engagement KPI Dashboard in Google Sheets
Target Sheet Tab – Define Your Goals
Goals drive performance, and this sheet helps you set them clearly.
- Enter MTD and YTD target values for each KPI.
- Compare real performance against planned benchmarks.
- Identify underperforming KPIs early and take corrective action.
Setting targets motivates teams to stay aligned with strategic engagement goals.
Click to buy Alumni Engagement KPI Dashboard in Google Sheets
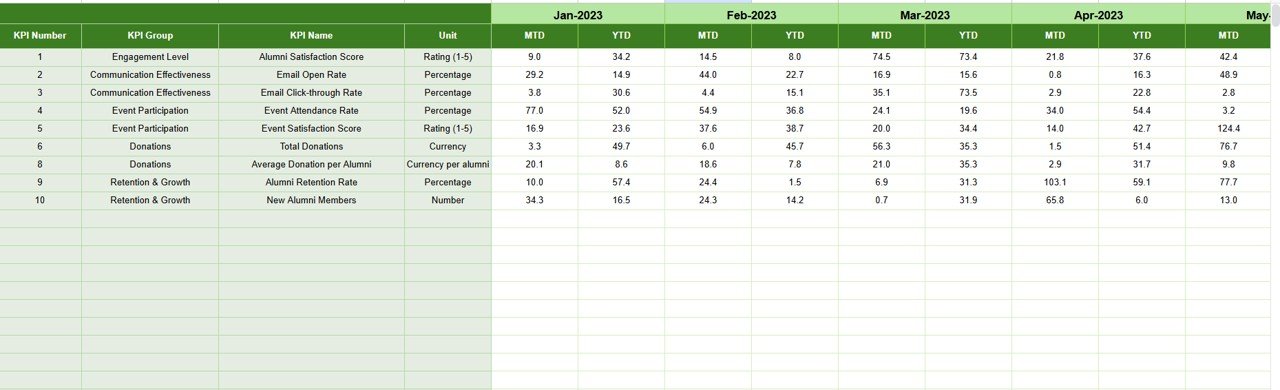
Previous Year Numbers Sheet Tab – Historical Benchmarking
This sheet provides valuable context and perspective.
- Input previous year’s data to understand year-over-year growth.
- Spot seasonal patterns and recurring engagement cycles.
- Use it for annual performance reporting and trend forecasting.
When you compare current progress against last year’s data, you gain a deeper understanding of what’s working — and what’s not.
Click to buy Alumni Engagement KPI Dashboard in Google Sheets
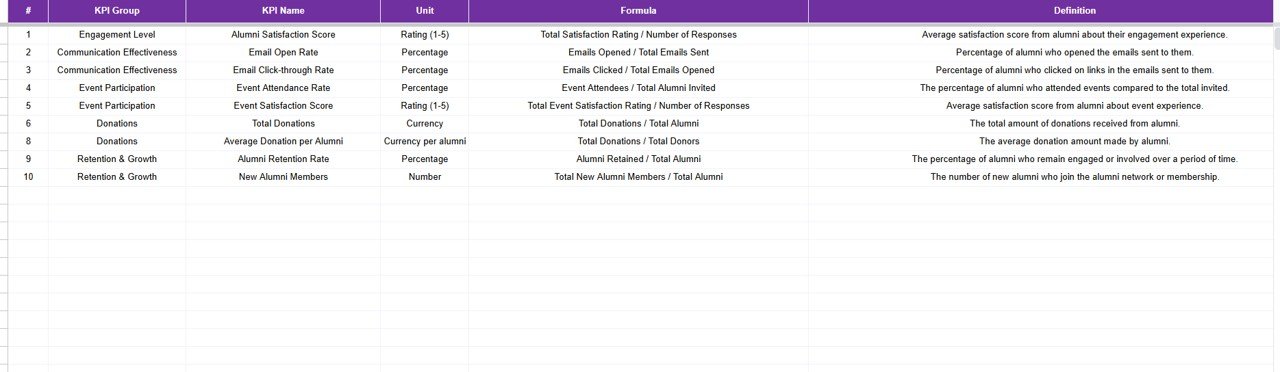
KPI Definition Sheet Tab – Build KPI Clarity
A great dashboard starts with well-defined metrics. This tab ensures transparency.
You can enter:
- KPI Name and Group
- Measurement Unit (e.g., %, Count, Value)
- Formula for Calculation
- Detailed Definition
This makes your dashboard self-explanatory, ensuring every user knows what each metric represents.
Click to buy Alumni Engagement KPI Dashboard in Google Sheets
Support Sheet Tab – Underlying Data Logic
Although not always visible to end users, this sheet contains supporting calculations and data mapping. It ensures seamless automation, helping charts and pivot tables run without manual errors.
Click to buy Alumni Engagement KPI Dashboard in Google Sheets
How the Dashboard Works
This dashboard operates through automated data linking and dynamic visualization.
- As soon as you enter actual and target values, the charts update automatically.
- Conditional formatting highlights performance gaps or achievements.
- The month selector ensures you can focus on any period instantly.
- The trend charts help leadership teams make quick, data-backed decisions.
Because it’s built in Google Sheets, multiple users can collaborate, review, and update data simultaneously — without the need for expensive software.
Benefits of Using Google Sheets for Alumni Engagement KPIs
Google Sheets offers several advantages that make it ideal for KPI tracking:
- Accessibility: Access and update data from anywhere.
- Collaboration: Multiple users can edit and analyze simultaneously.
- Cloud-based Storage: No installation required — everything is online.
- Automation: Use formulas and scripts to automate calculations.
- Cost-Effective: Free and easy to integrate with other Google Workspace tools.
These advantages make it perfect for schools, colleges, and alumni associations of any size.
Advantages of the Alumni Engagement KPI Dashboard
Let’s look at how this dashboard can transform your alumni relationship strategy:
- Unified Data View
Instead of scattered spreadsheets, all alumni engagement metrics appear in one centralized dashboard.
- Real-Time Decision Making
Data updates instantly, enabling faster and more accurate decisions.
- Improved Alumni Retention
You can identify engagement drop-offs early and re-engage those members.
- Enhanced Fundraising Outcomes
By tracking donor activity trends, you can design targeted campaigns that yield better results.
- Transparent Reporting
Present professional reports to management or the board without manual effort.
- Performance Motivation
Teams can monitor progress toward monthly and yearly goals, fostering accountability.
How to Customize the Dashboard for Your Institution
Every institution is unique — and this dashboard can easily adapt to your needs.
You can:
- Add or remove KPIs based on your engagement goals.
- Integrate additional data sources (like Google Forms or CRM exports).
- Modify conditional formatting to match your brand colors.
- Embed visual charts in presentations or alumni newsletters.
Its flexibility makes it suitable for both small colleges and large universities.
Why Choose a Google Sheets-Based Solution
While many institutions use CRM systems, they can be expensive and complex. Google Sheets offers a practical alternative:
- Quick setup — no coding needed.
- Secure cloud storage.
- Seamless integration with Google Forms, Gmail, and Drive.
- Automatic backups and version history.
This makes it perfect for organizations seeking simplicity, flexibility, and affordability.
Best Practices for the Alumni Engagement KPI Dashboard in Google Sheets
To get the most out of your dashboard, follow these best practices:
- Define Clear KPIs
Start with measurable, relevant KPIs that align with your institution’s strategic goals.
- Keep Data Consistent
Use standardized formats for months, units, and categories to avoid formula errors.
- Update Data Regularly
Schedule monthly updates for actuals, targets, and previous year data.
- Visualize Smartly
Use charts and color codes to tell stories rather than overload users with numbers.
- Automate Where Possible
Leverage Google Sheets formulas like ARRAYFORMULA, QUERY, and conditional formatting to minimize manual work.
- Encourage Collaboration
Share the dashboard with relevant departments to ensure data transparency.
- Review and Refine KPIs
As goals evolve, update your KPI definitions to keep the dashboard relevant.
Conclusion
The Alumni Engagement KPI Dashboard in Google Sheets is a game-changer for educational institutions seeking to build stronger alumni connections.
It not only simplifies performance tracking but also transforms complex data into visual insights — helping teams focus on what truly matters: strengthening relationships, boosting engagement, and achieving growth.
Whether you’re running a university alumni office, a school association, or a nonprofit education foundation, this dashboard gives you the clarity, control, and confidence to make data-driven decisions.
Frequently Asked Questions (FAQs)
- What is an Alumni Engagement KPI Dashboard?
It’s a Google Sheets-based tool that tracks and visualizes key performance indicators related to alumni engagement, such as event participation, donations, and communication activity.
- How can I use this dashboard for fundraising?
By tracking donor retention, donation frequency, and contribution trends, you can identify top donors and design personalized outreach strategies.
- Can I share the dashboard with others?
Yes, since it’s built in Google Sheets, you can share it easily with anyone who has a Google account, using “View” or “Edit” permissions.
- Do I need advanced technical skills?
No. The dashboard uses simple formulas, dropdowns, and charts — anyone with basic spreadsheet knowledge can manage it.
- Can I customize the KPIs?
Absolutely. You can add or remove KPIs, change formulas, or update chart designs to match your institution’s specific engagement metrics.
- How often should I update the data?
Ideally once a month, so your MTD and YTD metrics remain accurate and up-to-date.
- Why should I choose Google Sheets instead of Power BI or Excel?
Google Sheets is free, cloud-based, and supports real-time collaboration, making it ideal for teams that need accessibility without heavy setup or licensing costs.
- Can I visualize multi-year trends?
Yes, the Trend Sheet allows you to compare current and previous year data and generate clear, visual trends across time.
Visit our YouTube channel to learn step-by-step video tutorials
Watch the step-by-step video tutorial:
Click to buy Alumni Engagement KPI Dashboard in Google Sheets