Effective project management depends on tracking budgets, timelines, and progress across multiple tasks and departments. The Project Task Management Dashboard in Google Sheets offers an all-in-one solution to manage these factors visually and efficiently.Project Task Management Dashboard in Google Sheets
This ready-to-use dashboard is ideal for project managers, contractors, and executives who need instant insights into project performance, cost control, and delivery progress — all from a single, interactive Google Sheet.Project Task Management Dashboard in Google Sheets
What Is a Project Task Management Dashboard in Google Sheets?
A Project Task Management Dashboard is a performance tracking tool that helps teams monitor the status, cost, and progress of tasks across multiple projects.Project Task Management Dashboard in Google Sheets
Built entirely in Google Sheets, this dashboard automatically updates charts, calculates variances, and provides department-wise, contractor-wise, and location-based performance insights.Project Task Management Dashboard in Google Sheets
By consolidating all project data into one place, it ensures transparency, accountability, and timely decision-making — without the need for complex project management software.Project Task Management Dashboard in Google Sheets
Structure of the Dashboard
Click to Buy Project Task Management Dashboard in Google Sheets
The Project Task Management Dashboard in Google Sheets includes several structured sheets designed to give both summary-level and detailed task views:
Overview Sheet Tab
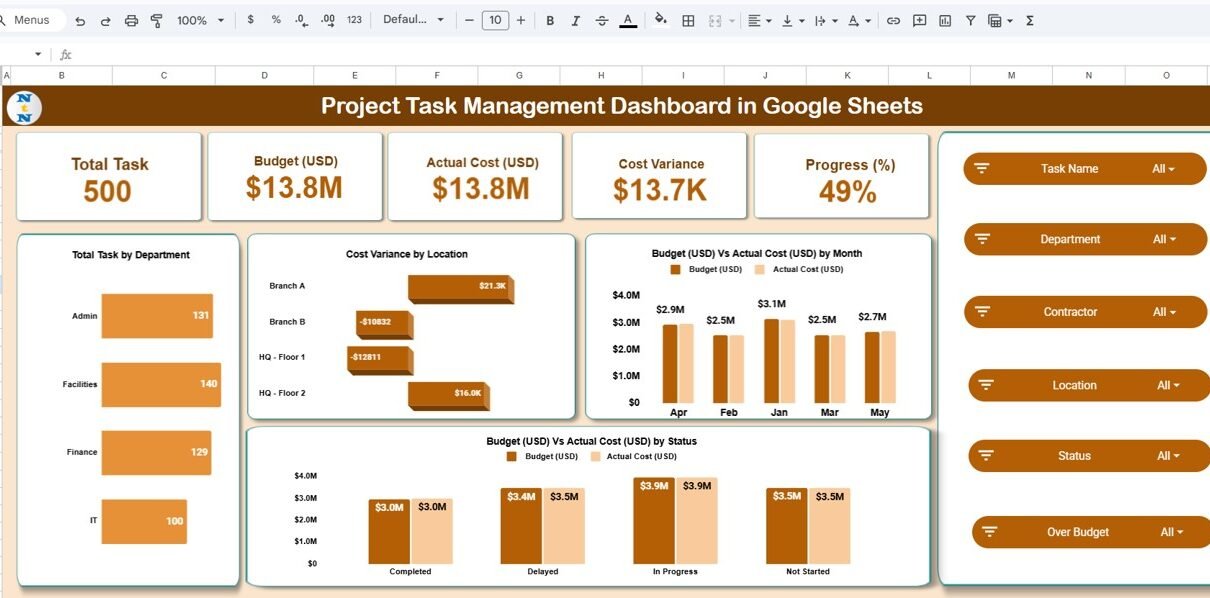
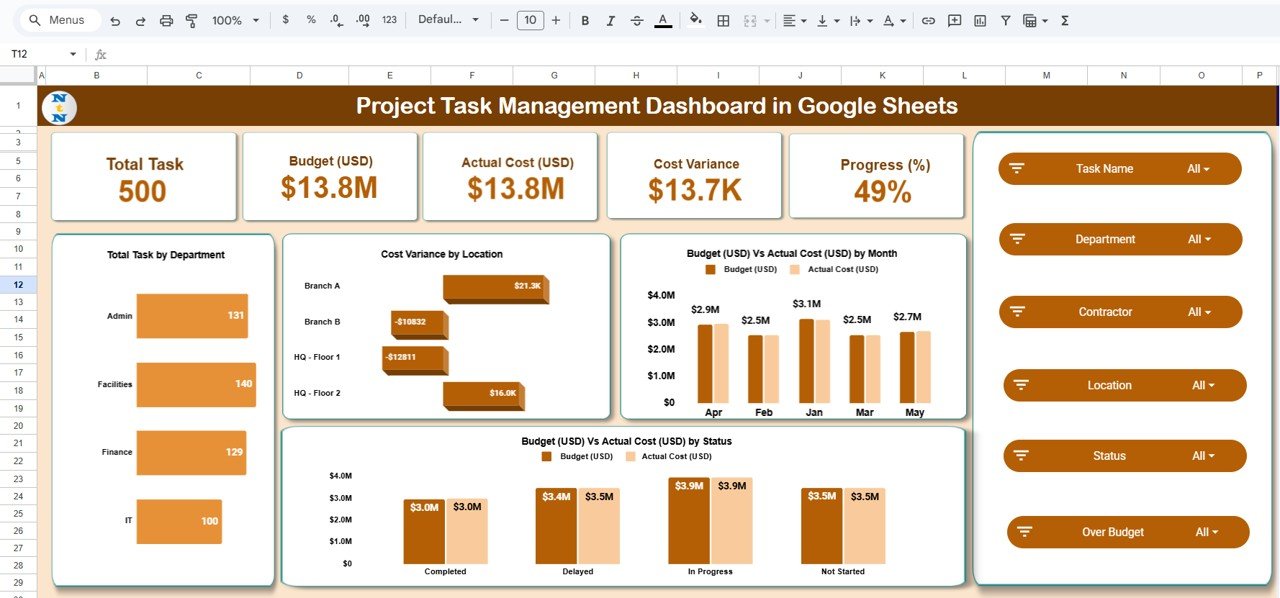
The Overview Sheet provides a snapshot of all project task metrics, allowing you to quickly assess project health.
Cards Displayed:
-
Total Task: Total number of tasks in the project portfolio.
-
Budget (USD): Total planned budget for all tasks.
-
Actual Cost (USD): Actual expenditure incurred.
-
Cost Variance: Difference between the budget and actual cost.
-
Progress (%): Average completion percentage of all active tasks.
Charts Included:
-
Total Task by Department: Visual breakdown of tasks assigned to each department.
-
Cost Variance by Location: Identifies locations exceeding or staying within budget.
-
Budget vs Actual Cost by Month: Tracks monthly financial performance.
-
Budget vs Actual Cost by Status: Highlights cost trends across task statuses (Not Started, In Progress, Completed).
This sheet gives management an instant overview of financial and operational project performance.
Click to Buy Project Task Management Dashboard in Google Sheets
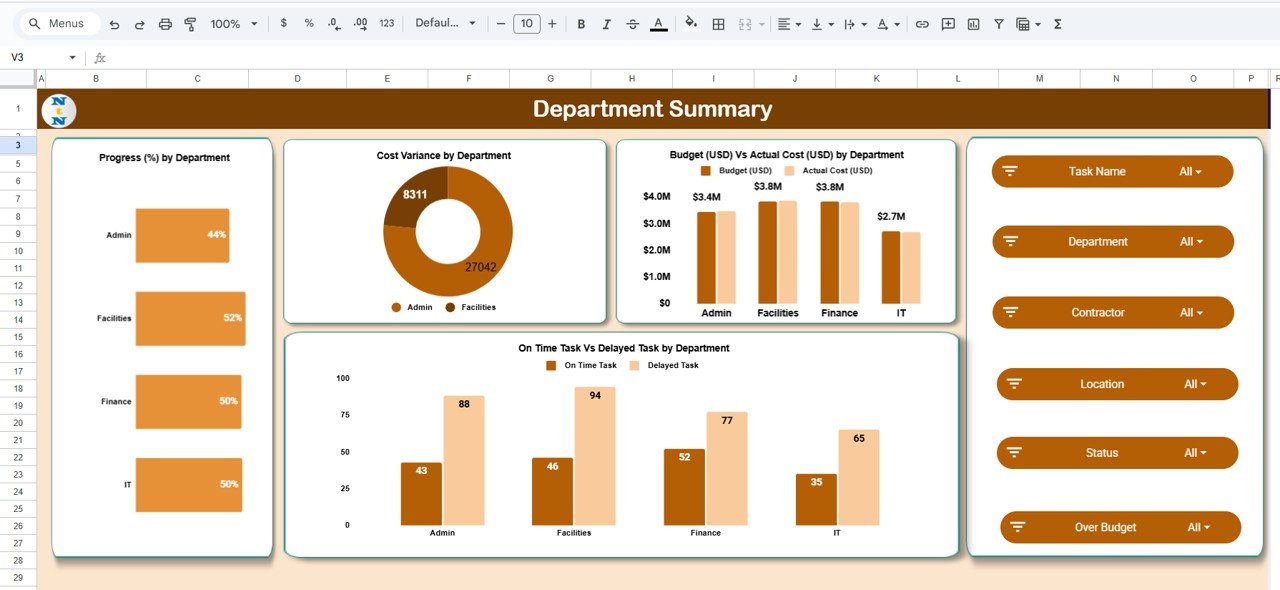
Department Summary Sheet Tab
The Department Summary Tab provides a department-wise analysis of task progress and financial metrics.
Charts Included:
-
Progress (%) by Department: Tracks completion rates per department.
-
Cost Variance by Department: Measures budget utilization efficiency.
-
On-Time Task vs Delayed Task by Department: Displays timeliness of project delivery.
This helps identify which departments are performing efficiently and which may require corrective action.
Click to Buy Project Task Management Dashboard in Google Sheets
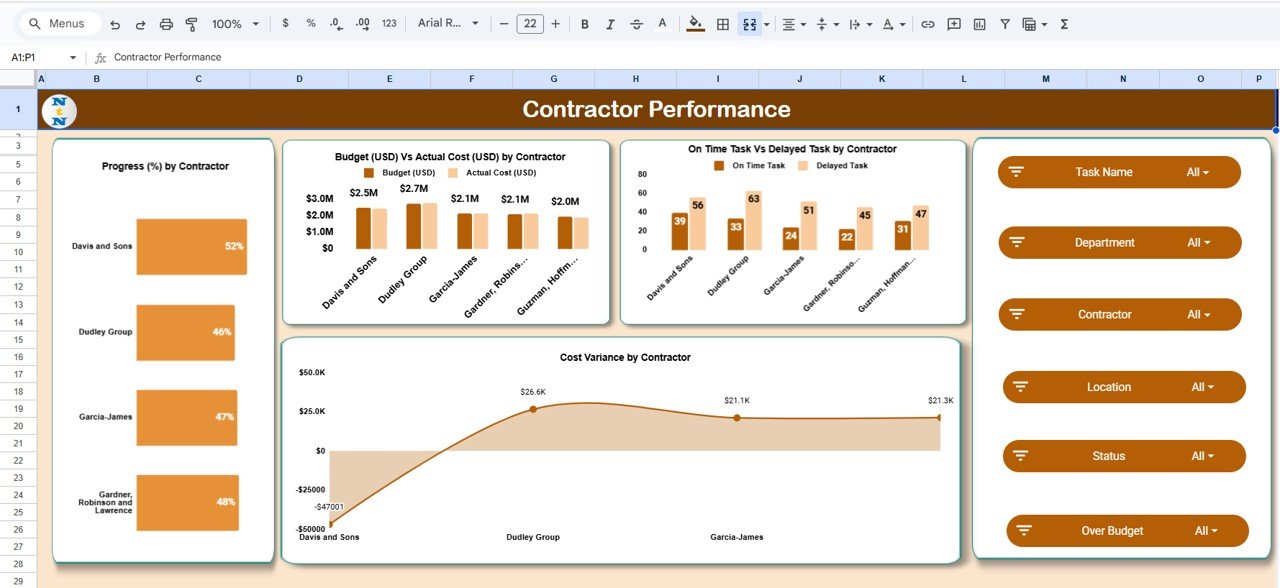
Contractor Performance Sheet Tab
The Contractor Performance Tab evaluates vendors or contractors involved in project execution.
Charts Included:
-
Progress (%) by Contractor – Compares task completion percentages across contractors.
-
Budget vs Actual Cost by Contractor – Evaluates contractor-level financial discipline.
-
On-Time Task vs Delayed Task by Contractor – Identifies punctual and delayed contractors.
-
Cost Variance by Contractor – Shows which contractors maintain budgets or cause overruns.
This insight is particularly useful for procurement and project coordination teams.
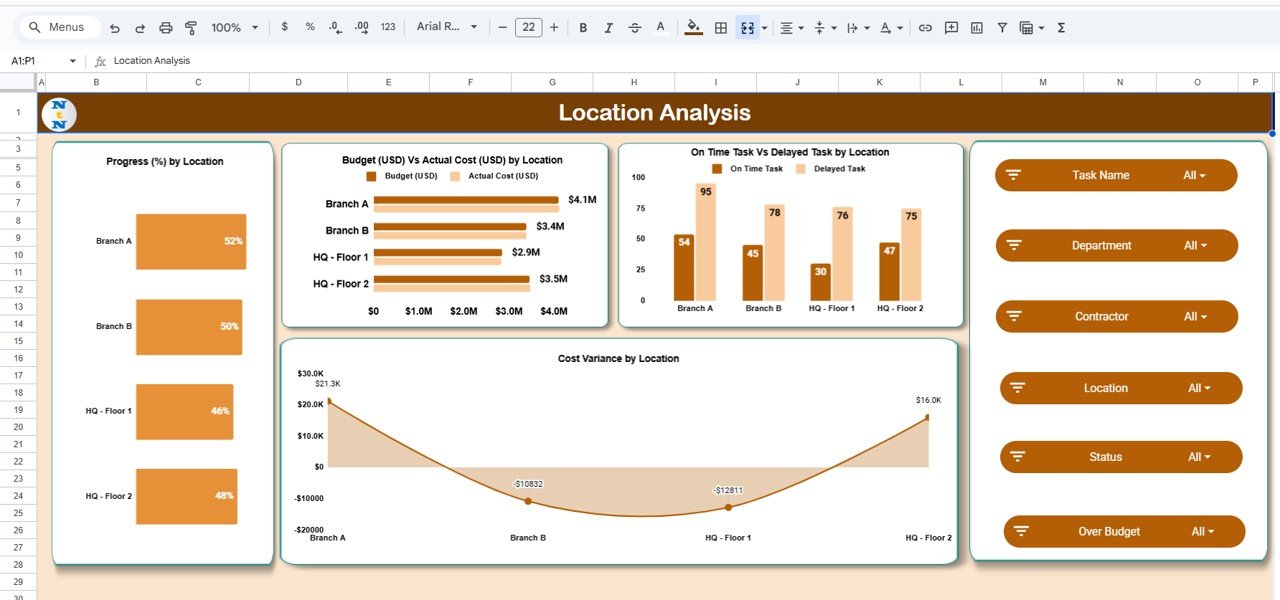
Location Analysis Sheet Tab
This tab breaks down project performance by geographical or site location.
Charts Included:
-
Progress (%) by Location – Tracks task completion by site.
-
Budget vs Actual Cost by Location – Analyzes financial efficiency per location.
-
On-Time Task vs Delayed Task by Location – Reveals timeliness at each project site.
-
Cost Variance by Location – Highlights cost efficiency or overruns by region.
This level of detail ensures effective monitoring of decentralized projects and teams.
Click to Buy Project Task Management Dashboard in Google Sheets
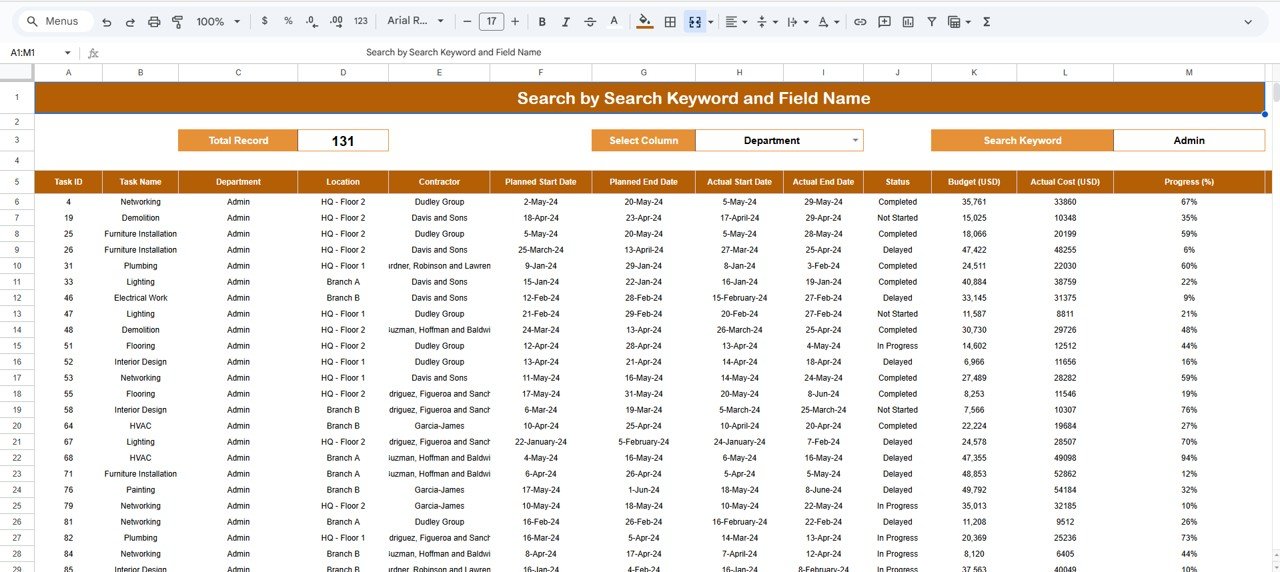
Search Sheet Tab
The Search Sheet allows users to locate specific tasks or projects using keywords or field names.
Examples:
-
Search “High Budget” → Lists tasks with large budgets.
-
Search “Contractor: Davis & Sons” → Filters all tasks assigned to that contractor.
-
Search “Department: IT” → Displays only IT department tasks.
This functionality improves navigation and reduces time spent searching through large datasets.
Click to Buy Project Task Management Dashboard in Google Sheets
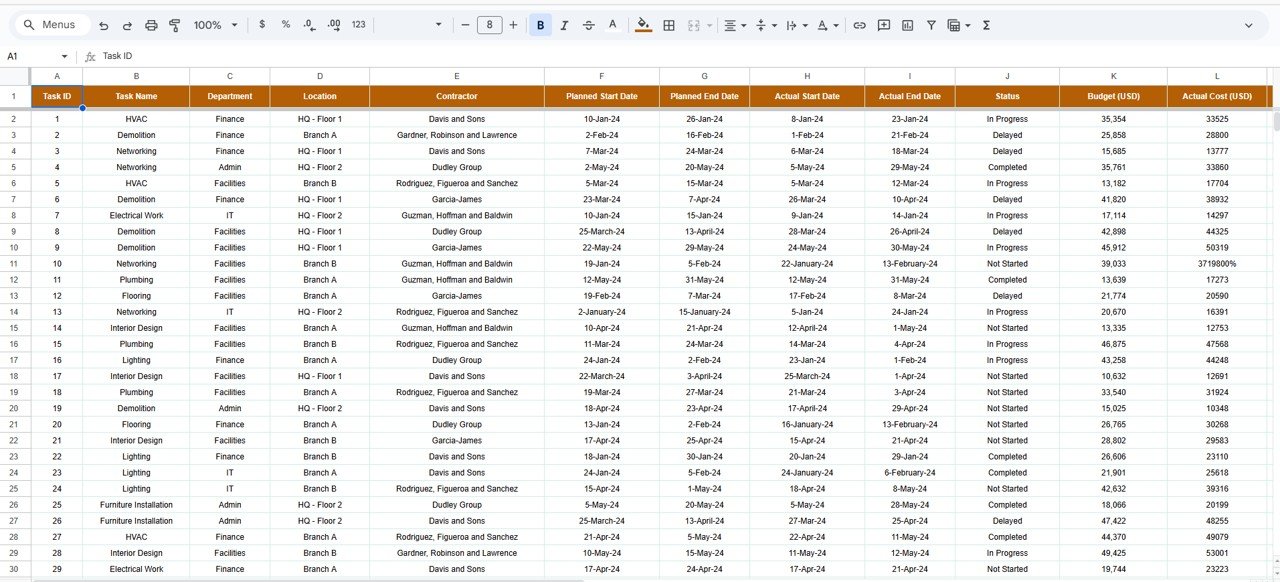
Data Sheet Tab
This sheet stores all the project and task data that powers the dashboard.
Advantages of the Dashboard
-
Centralized Task Tracking: Manage all project tasks in one interactive sheet.
-
Budget Control: Instantly monitor budget utilization and variances.
-
Visual Insights: Color-coded visuals simplify decision-making.
-
Performance Analysis: Track progress across departments, contractors, and locations.
-
Collaboration Ready: Cloud-based access allows multiple users to update data simultaneously.
-
No Coding Required: Fully automated within Google Sheets.
Opportunities for Improvement
Click to Buy Project Task Management Dashboard in Google Sheets
Enhance your dashboard with:
-
Google Forms Integration: Automate task data entry from project teams.
-
Alerts and Notifications: Use Google Apps Script to notify managers of delays or overruns.
-
Gantt Chart View: Add a visual timeline for each task.
-
Resource Utilization Metrics: Include workload and resource allocation KPIs.
-
Project Health Indicator: Add RAG (Red-Amber-Green) color status for quick health checks.
Best Practices
-
Update data regularly for accurate visuals.
-
Maintain consistent naming conventions for departments and contractors.
-
Protect formula and chart cells from edits.
-
Review cost variance and progress weekly.
-
Archive old tasks periodically to maintain performance.
Conclusion
Click to Buy Project Task Management Dashboard in Google Sheets
The Project Task Management Dashboard in Google Sheets is a comprehensive and user-friendly tool for managing project timelines, budgets, and performance.
It brings clarity to project management by combining task tracking, cost monitoring, and contractor evaluation — all in one dashboard.
Visit our YouTube channel to learn step-by-step video tutorials
Youtube.com/@NeotechNavigators
Watch the step-by-step video Demo:
Click to Buy Project Task Management Dashboard in Google Sheets