Efficient energy generation and resource management are essential for every utility provider and energy organization. The Energy Generation & Efficiency Dashboard in Google Sheets helps you monitor key metrics such as power output, facility status, emissions, and operational efficiency — all in one place.Energy Generation & Efficiency Dashboard in Google Sheets
This ready-to-use Google Sheets dashboard offers an interactive and data-driven platform that tracks month-to-date (MTD) and year-to-date (YTD) performance with instant visual insights.Energy Generation & Efficiency Dashboard in Google Sheets
What Is the Energy Generation & Efficiency Dashboard in Google Sheets?
The Energy Generation & Efficiency Dashboard is designed for energy producers, renewable energy firms, and power plant operators to measure performance and optimize facility operations.
It consolidates KPIs like output (MW), efficiency (%), downtime (hrs), and CO₂ emissions (tons), with charts that reveal patterns across energy source, facility type, and time period.
Using conditional formatting, arrows, and color-coded visuals, it instantly highlights areas that need attention, helping teams take corrective actions quickly.
Dashboard Structure
Click to Buy Energy Generation & Efficiency Dashboard in Google Sheets
The Energy Generation & Efficiency Dashboard in Google Sheets is organized into multiple worksheet tabs for clarity and usability:
Dashboard Sheet Tab
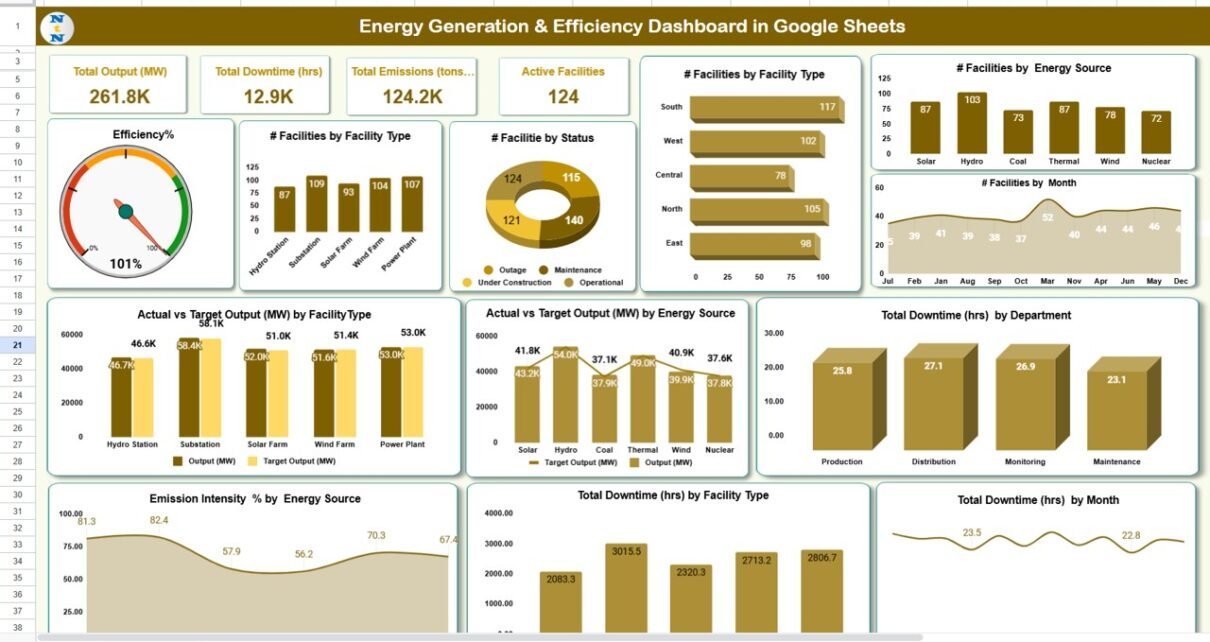
This is the main visualization page, where all KPIs are summarized through cards and charts.
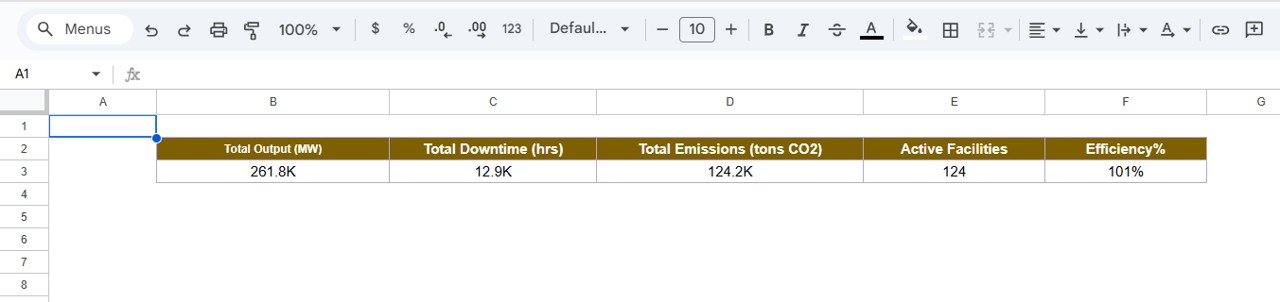
Cards Displayed:
-
⚡ Total Output (MW) — measures the total energy produced across all facilities.
-
⏱ Total Downtime (hrs) — total hours when generation was halted due to maintenance or failure.
-
🌍 Total Emissions (tons CO₂) — tracks overall carbon emissions.
-
🏭 Active Facilities — total number of plants currently operational.
-
🔋 Efficiency (%) — energy output compared to potential capacity.
Charts Displayed:
-
Efficiency %
-
of Facilities by Facility Type
-
of Facilities by Status
-
of Facilities by Energy Source
-
of Facilities by Month
-
Total Downtime (hrs) by Department
-
Actual vs. Target Output (MW) by Energy Source
-
Actual vs. Target Output (MW) by Facility Type
-
Emission Intensity % by Energy Source
-
Total Downtime (hrs) by Facility Type
-
Total Downtime (hrs) by Month
All visualizations update automatically when data is refreshed or a new month is selected from the month dropdown (cell D3).

Click to Buy Energy Generation & Efficiency Dashboard in Google Sheets
Search Sheet Tab
This tab enables users to quickly locate specific records.
Search using keyword and field name (e.g., “Status = Active” or “Department = Operations”) to retrieve relevant data entries instantly.

Click to Buy Energy Generation & Efficiency Dashboard in Google Sheets
Data Sheet Tab
The Data Sheet Tab is the foundation of the dashboard.
Here, users input raw data — including monthly metrics like facility name, energy source, status, emissions, and output.
The dashboard pulls and aggregates this data automatically.

Support Sheet Tab
This tab contains backend references such as dropdown values, formulas, color codes, and mapping tables for data validation.
Click to Buy Energy Generation & Efficiency Dashboard in Google Sheets
Advantages
-
Real-Time Visibility: Monitors generation efficiency and emissions instantly.
-
Facility-Level Insights: Tracks performance by type, department, and energy source.
-
Target Comparison: Highlights over/underperformance vs targets.
-
Automation: Built with dynamic formulas and auto-refresh charts.
-
Cloud-Based Collaboration: Accessible across teams for live updates.
Opportunities for Improvement
-
Add Google Apps Script for automated monthly summary emails.
-
Integrate emission factor databases for automatic CO₂ calculation.
-
Introduce cost-per-unit metrics for financial optimization.
-
Build a forecast sheet using historical output and trendline regression.
Best Practices
Click to Buy Energy Generation & Efficiency Dashboard in Google Sheets
-
Maintain accurate data entry each month.
-
Use consistent facility naming conventions.
-
Review downtime logs weekly to minimize losses.
-
Compare Emission Intensity regularly to benchmark performance.
-
Backup data monthly for historical tracking.
Conclusion
Click to Buy Energy Generation & Efficiency Dashboard in Google Sheets
The Energy Generation & Efficiency Dashboard in Google Sheets is a powerful, easy-to-use system for tracking performance across power generation, operations, and environmental impact.
With automated KPIs, target comparisons, and interactive visuals, it empowers energy leaders to achieve higher efficiency, reduce emissions, and make sustainable, data-driven decisions.
Visit our YouTube channel to learn step-by-step video tutorials
Youtube.com/@NeotechNavigators
Watch the step-by-step video Demo:
Click to Buy Energy Generation & Efficiency Dashboard in Google Sheets