Customer relationships do not end after a sale. In fact, they begin there. However, many businesses struggle to track service performance effectively. As a result, customer satisfaction drops, complaints increase, and retention suffers.
So, how can you monitor service quality, response time, resolution rate, and team efficiency in one centralized system?
You need an After-Sales Service KPI Dashboard in Google Sheets.
This powerful, ready-to-use dashboard helps you track key service metrics, compare performance against targets, and monitor trends month after month. Moreover, it gives real-time insights without complex software. Therefore, service managers make faster and better decisions.
What Is an After-Sales Service KPI Dashboard in Google Sheets?
Click to Buy After-Sales Service KPI Dashboard in Google Sheets
An After-Sales Service KPI Dashboard in Google Sheets is a structured performance tracking system designed to monitor service operations after product delivery.
Instead of using multiple files, you can:
- Track service requests
- Measure response times
- Monitor resolution rates
- Compare Target vs Actual
- Evaluate Month-to-Date (MTD) and Year-to-Date (YTD) performance
- Benchmark against previous year data
Because Google Sheets works online, teams collaborate easily. Additionally, managers view performance anytime from anywhere.
Why Do Businesses Need an After-Sales Service KPI Dashboard?
After-sales service directly impacts:
- Customer loyalty
- Brand reputation
- Repeat purchases
- Revenue growth
However, without proper tracking:
- Service tickets remain unresolved
- SLA breaches increase
- Customer complaints rise
- Performance reviews become unclear
On the other hand, when you use a KPI dashboard:
- You gain visibility
- You detect issues early
- You improve accountability
- You strengthen service quality
Therefore, structured KPI monitoring becomes essential.
What Are the Key Features of the After-Sales Service KPI Dashboard in Google Sheets?
Click to Buy After-Sales Service KPI Dashboard in Google Sheets
This dashboard contains 6 structured worksheets. Each sheet serves a specific function.
Let us understand each one clearly.
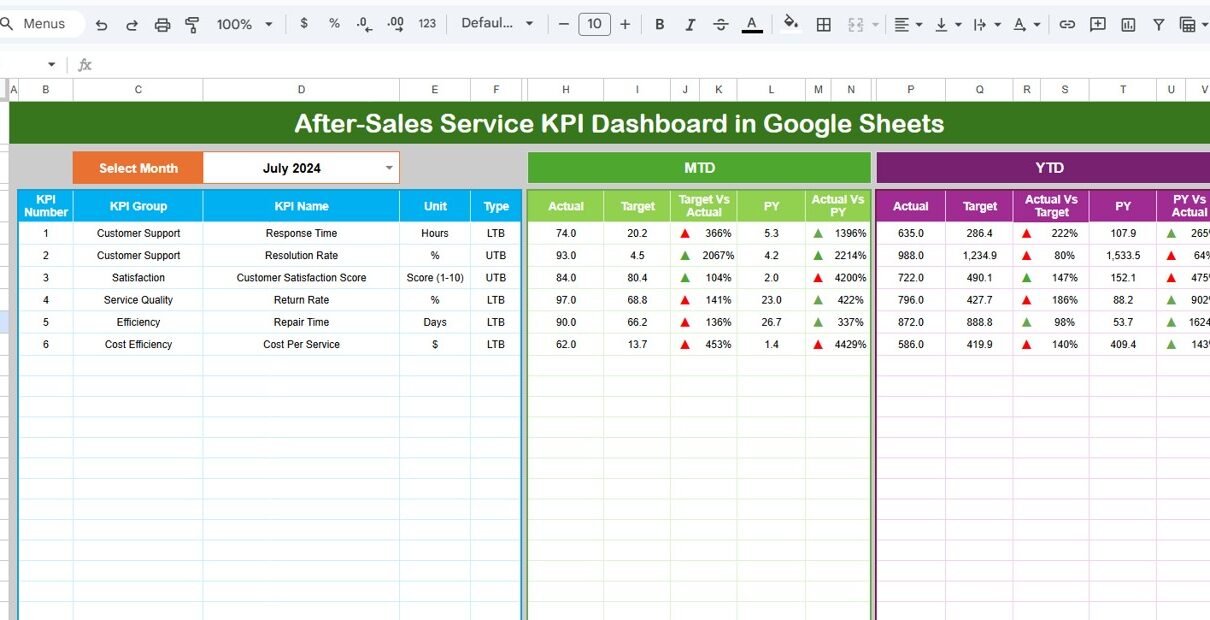
How Does the Dashboard Sheet Work?
The Dashboard Sheet Tab acts as the main performance view.
On Cell D3, you can select any month from a drop-down list. Immediately, the entire dashboard updates automatically.
The Dashboard Displays:
Month-to-Date (MTD) Metrics
- MTD Actual
- MTD Target
- MTD Previous Year
- Target vs Actual comparison
- Previous Year vs Actual comparison
- Conditional formatting with up/down arrows
Year-to-Date (YTD) Metrics
- YTD Actual
- YTD Target
- YTD Previous Year
- Target vs Actual
- Previous Year vs Actual
- Performance direction indicators
Because of these comparisons, managers quickly identify performance gaps.

Click to Buy After-Sales Service KPI Dashboard in Google Sheets
What Is the KPI Trend Sheet?
The KPI Trend Sheet Tab provides detailed analysis.
On Cell C3, you select a KPI from the drop-down list. Then, the sheet displays:
- KPI Group
- Unit of KPI
- KPI Type (Lower the Better or Upper the Better)
- Formula of the KPI
- Definition of the KPI
Additionally, it shows trend charts for:
- MTD Actual vs Target vs Previous Year
- YTD Actual vs Target vs Previous Year
Therefore, you visualize long-term service performance clearly.

Click to Buy After-Sales Service KPI Dashboard in Google Sheets
How Do You Use the Actual Number Sheet?
The Actual Number Sheet Tab stores real performance data.
You simply:
- Enter the first month of the year in Cell E1
- Input MTD and YTD values
- Update data monthly
Once you enter the data, the dashboard refreshes automatically.
This structured input ensures accuracy and consistency.

What Is the Purpose of the Target Sheet?
The Target Sheet Tab contains monthly and YTD goals.
Here, you enter:
- KPI targets for MTD
- KPI targets for YTD
Because of this structure, you compare performance against clear benchmarks.

Click to Buy After-Sales Service KPI Dashboard in Google Sheets
Why Is the Previous Year Sheet Important?
The Previous Year Number Sheet Tab helps measure improvement.
You enter last year’s data similar to the current year. Then, the dashboard compares:
- Current performance vs last year
- Growth percentage
- Service improvement trends
As a result, management sees whether performance improves over time.

What Is the KPI Definition Sheet?
The KPI Definition Sheet Tab standardizes performance measurement.
Here, you enter:
- KPI Name
- KPI Group
- Unit
- Formula
- KPI Definition
This sheet removes confusion and aligns the entire team

Click to Buy After-Sales Service KPI Dashboard in Google Sheets
How Does MTD and YTD Tracking Improve Service Management?
MTD tracking helps managers:
- Monitor current performance
- Identify immediate service delays
- Adjust workload distribution
Meanwhile, YTD tracking helps managers:
- Evaluate annual service performance
- Measure long-term improvement
- Analyze seasonal demand patterns
Therefore, combining both gives complete visibility.
Advantages of After-Sales Service KPI Dashboard in Google Sheets
Real-Time Performance Monitoring
You instantly track service quality.
Clear Target Comparison
You compare Actual vs Target clearly.
Improved Accountability
Team members understand measurable expectations.
Easy Customization
You adjust KPIs according to business needs.
Cost-Effective Solution
Google Sheets eliminates expensive software costs.
Cloud Accessibility
You access the dashboard anytime from anywhere.
Better Customer Retention
You improve service quality consistently.
Best Practices for the After-Sales Service KPI Dashboard
Click to Buy After-Sales Service KPI Dashboard in Google Sheets
To maximize benefits, follow these best practices:
Define Clear Service Goals
Align KPIs with customer satisfaction targets.
Update Data Monthly
Maintain data discipline.
Standardize KPI Definitions
Use the KPI Definition Sheet properly.
Conduct Monthly Review Meetings
Discuss dashboard insights with the team.
Focus on Actionable Metrics
Avoid unnecessary KPIs.
Automate Data Collection When Possible
Integrate ticketing systems with Sheets.
How Can This Dashboard Improve Customer Loyalty?
Click to Buy After-Sales Service KPI Dashboard in Google Sheets
When you track service metrics consistently:
- You reduce response time
- You improve resolution speed
- You increase satisfaction scores
- You decrease repeat complaints
Consequently, customers trust your brand more.
Conclusion
After-sales service determines whether customers return or leave.
However, manual tracking creates confusion. On the other hand, the After-Sales Service KPI Dashboard in Google Sheets provides structured, clear, and visual performance tracking.
Because it compares MTD, YTD, Target, and Previous Year data, it gives complete visibility. Moreover, it improves accountability and customer satisfaction.
If you want to strengthen service operations and build long-term customer relationships, this dashboard provides a simple yet powerful solution.
Frequently Asked Questions (FAQs)
Click to Buy After-Sales Service KPI Dashboard in Google Sheets
What is an After-Sales Service KPI Dashboard?
It is a performance tracking system that monitors service quality, response time, resolution rate, and customer satisfaction.
Can I customize the KPIs?
Yes. You can add or modify KPIs in the KPI Definition Sheet.
What does Lower the Better mean?
I means lower values indicate better performance, such as response time.
Why should I track Previous Year data?
It helps measure long-term improvement.
Do I need advanced skills to use this dashboard?
No. Basic Google Sheets knowledge is enough.
Visit our YouTube channel to learn step-by-step video tutorials
Youtube.com/@NeotechNavigators
Watch the step-by-step video tutorial:
Click to Buy After-Sales Service KPI Dashboard in Google Sheets