In today’s highly competitive automotive industry, data-driven decisions separate successful dealerships and service centers from the rest. However, many automotive businesses still rely on scattered spreadsheets and manual reporting. As a result, leaders struggle to monitor performance in real time.
Therefore, companies need a structured and interactive performance monitoring system. More importantly, they need instant visibility into their most critical KPIs.
That is exactly where the Automotive KPI Scorecard in Google Sheets becomes a powerful solution.
This ready-to-use template helps automotive managers, dealership owners, and analysts track key performance indicators in one centralized dashboard. Moreover, it converts raw operational data into clear, actionable insights.
In this comprehensive guide, you will learn everything about the Automotive KPI Scorecard in Google Sheets, including its structure, features, advantages, best practices, and frequently asked questions.
What Is an Automotive KPI Scorecard in Google Sheets?
Click to Buy Automotive KPI Scorecard In Google Sheets
An Automotive KPI Scorecard in Google Sheets is an interactive performance tracking tool designed specifically for automotive businesses. It monitors operational, sales, and service KPIs in a single dynamic interface.
Instead of reviewing multiple reports, you can evaluate all critical metrics in one place. Consequently, your team saves time and improves decision-making.
This scorecard tracks 10 carefully selected KPIs, each supported by:
- Unit of measurement
- Aggregation formula
- KPI definition
- KPI type (Lower the Better or Upper the Better)
Because of this structured approach, businesses gain complete clarity over performance trends.
Why Do Automotive Businesses Need a KPI Scorecard?
Automotive operations generate large volumes of data every day. However, without proper tracking, that data does not support strategic decisions.
When you implement a KPI scorecard, you can:
- Monitor dealership performance
- Track service efficiency
- Measure sales productivity
- Improve customer satisfaction
- Optimize operational costs
Therefore, a dedicated KPI scorecard becomes essential for modern automotive management.
Key Features of the Automotive KPI Scorecard in Google Sheets
Click to Buy Automotive KPI Scorecard In Google Sheets
How Many Worksheets Are Included in the Template?
The Automotive KPI Scorecard in Google Sheets contains several structured worksheets. Each tab plays a specific role in the reporting process.
Let us explore each one in detail.
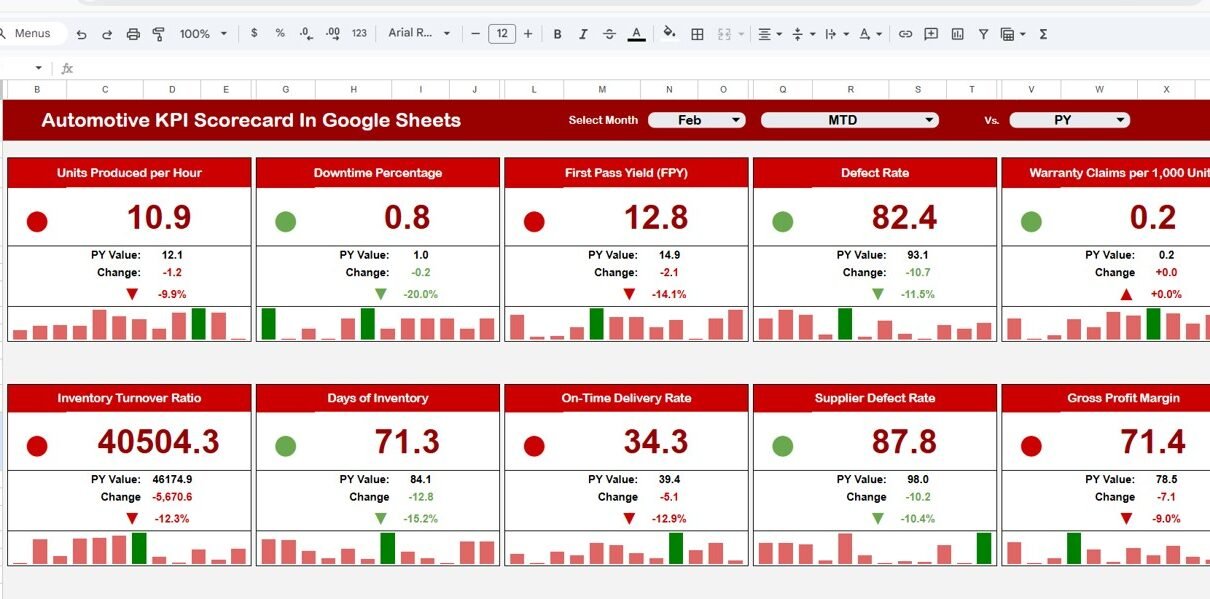
1. Scorecard Dashboard – The Main Performance View
The Scorecard sheet serves as the primary interface of the template. Here, users can monitor the performance of all 10 KPIs in one screen.
Key Functionalities
-
Month dropdown at the top
-
Automatic monthly refresh
-
Traffic light indicators
-
Percentage variance arrows
-
MTD and YTD toggle buttons
Because everything appears in one place, leadership teams can make faster decisions.

Click to Buy Automotive KPI Scorecard In Google Sheets
2. Trend Sheet Tab – Detailed KPI Intelligence
The Trend sheet provides deeper insight into individual KPIs.
How It Works
-
Select the KPI name from dropdown in cell C3
-
The sheet updates automatically
Information Displayed
This tab shows:
-
KPI Group
-
Unit of KPI
-
KPI Type (Lower the Better / Upper the Better)
-
KPI formula
-
KPI definition
Therefore, this sheet acts as both an analytical view and a KPI knowledge center.

3. KPI Definition Sheet Tab – The Foundation Layer
Click to Buy Automotive KPI Scorecard In Google Sheets
The KPI Definition sheet standardizes the entire scorecard.
Required Fields
In this tab, you must enter:
-
KPI Name
-
KPI Group
-
Unit
-
Formula
-
KPI Definition
-
KPI Type (LTB or UTB)
Because this structure ensures consistency, the dashboard maintains accuracy across all reports.

Click to Buy Automotive KPI Scorecard In Google Sheets
4. Data Input Sheet Tab – Where Performance Data Lives
The Data Input sheet serves as the main data entry area.
How to Use It
You simply input the raw KPI numbers for each month. After that, the dashboard calculates everything automatically.
Data You Should Enter
-
Monthly actual values
-
Target values
-
Historical numbers (if applicable)
Because of this structured input method, the template remains easy to maintain.

Click to Buy Automotive KPI Scorecard In Google Sheets
5. Colour Settings Sheet – Visual Control Center
The Colour Settings sheet controls the visual behavior of the scorecard.
What You Can Configure
-
Traffic light thresholds
-
Performance color rules
-
Arrow formatting logic
Therefore, you can customize the dashboard’s visual language according to your business standards.

Click to Buy Automotive KPI Scorecard In Google Sheets
How Does This Scorecard Improve Decision-Making?
This template does more than display numbers. Instead, it drives strategic clarity.
Key Decision Benefits
- Identify underperforming departments quickly
- Monitor monthly progress
- Improve service efficiency
- Optimize sales performance
- Support data-driven planning
As a result, automotive businesses can move from reactive management to proactive leadership.
Advantages of Automotive KPI Scorecard in Google Sheets
Click to Buy Automotive KPI Scorecard In Google Sheets
Implementing this scorecard delivers several business benefits.
Centralized Performance Monitoring
-
View all KPIs in one place
-
Reduce reporting time
-
Improve executive visibility
Faster Performance Reviews
-
Instant traffic light signals
-
Automatic variance analysis
-
Real-time monthly updates
Improved Accountability
-
Clear target tracking
-
Transparent KPI ownership
-
Measurable outcomes
Flexible and Customizable
-
Easy to modify KPIs
-
Adjustable thresholds
-
Scalable structure
Cost-Effective Solution
-
No expensive BI tools required
-
Works fully in Google Sheets
-
Easy to maintain
Best Practices for the Automotive KPI Scorecard in Google Sheets
Click to Buy Automotive KPI Scorecard In Google Sheets
To maximize the effectiveness of this scorecard, follow these proven best practices.
Standardize KPI Definitions
Always maintain clear formulas and definitions. Otherwise, teams may interpret metrics differently.
Update Data Regularly
Enter monthly data consistently. Because timely updates improve accuracy, your insights remain reliable.
Focus on Actionable Metrics
Avoid vanity KPIs. Instead, track metrics that influence revenue and efficiency.
Review Performance Monthly
Schedule monthly scorecard reviews. As a result, your team can take corrective action quickly.
Maintain Clean Source Data
Remove duplicates and errors from the Data Input sheet. Clean data ensures trustworthy insights.
Align Targets With Business Goals
Set realistic but challenging targets. Therefore, the scorecard drives meaningful improvement.
Conclusion
Click to Buy Automotive KPI Scorecard In Google Sheets
The automotive industry moves fast. Therefore, businesses must monitor performance continuously to stay competitive.
The Automotive KPI Scorecard in Google Sheets provides a centralized, intelligent, and highly visual way to track key metrics. Moreover, it empowers teams to identify trends, compare targets, and improve operational efficiency with confidence.
Because the template combines automation, clarity, and flexibility, it becomes an essential tool for modern automotive management.
If you want faster insights and smarter decisions, this scorecard offers the perfect starting point.
Frequently Asked Questions (FAQs)
Click to Buy Automotive KPI Scorecard In Google Sheets
What is the purpose of the Automotive KPI Scorecard?
The scorecard helps automotive businesses track and evaluate key performance indicators in a centralized Google Sheets dashboard.
How many KPIs does this template track?
The template tracks 10 automotive KPIs, although you can customize them based on your business needs.
What do LTB and UTB mean?
-
LTB (Lower the Better): Lower values indicate better performance
-
UTB (Upper the Better): Higher values indicate better performance
Can I customize the traffic light colors?
Yes. You can modify thresholds and colors in the Colour Settings sheet.
How often should I update the data?
You should update the Data Input sheet monthly. However, more frequent updates can provide deeper insights.
Does this scorecard support both monthly and yearly analysis?
Yes. You can switch between MTD and YTD views for complete performance visibility.
Visit our YouTube channel to learn step-by-step video tutorials
Youtube.com/@NeotechNavigators
Watch the step-by-step video tutorial: