Hello, spreadsheet wizards! Have you ever found yourself sifting through heaps of data, wishing there was a simpler way to calculate averages for specific groups? Well, you’re in luck! Today, we’re diving into the AVERAGEIF Formula In Google Sheets. This handy tool is perfect for zeroing in on the data that really matters, making your analysis quicker and more targeted.
Getting to Know Your Data
Let’s start with our dataset, which stretches from A3 to D13 in Google Sheet
s. We’ve got several important columns like Name, City, Department, and Sales, but today, we’re particularly interested in averaging the sales figures for specific cities.
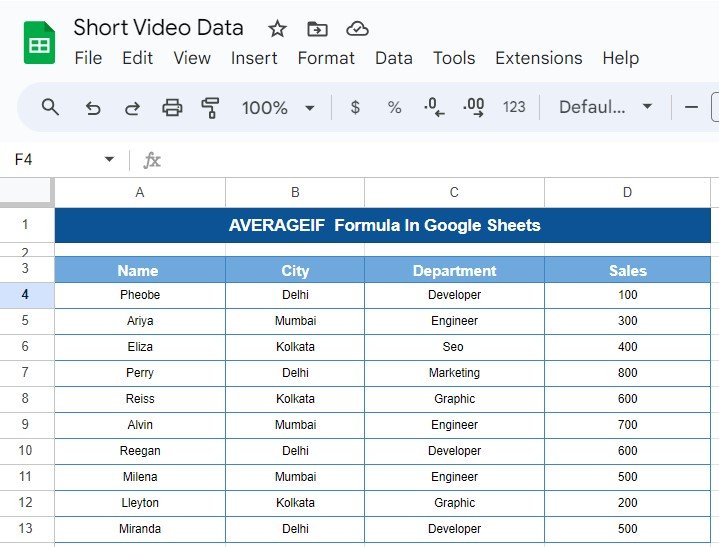
Here’s What Our Data Looks Like
Check out a snippet of the dataset we’re analyzing:
Mastering AVERAGEIF
Now, onto the star of the show—the AVERAGEIF function. This formula is a powerhouse when it comes to calculating averages from subsets of data based on specific criteria.
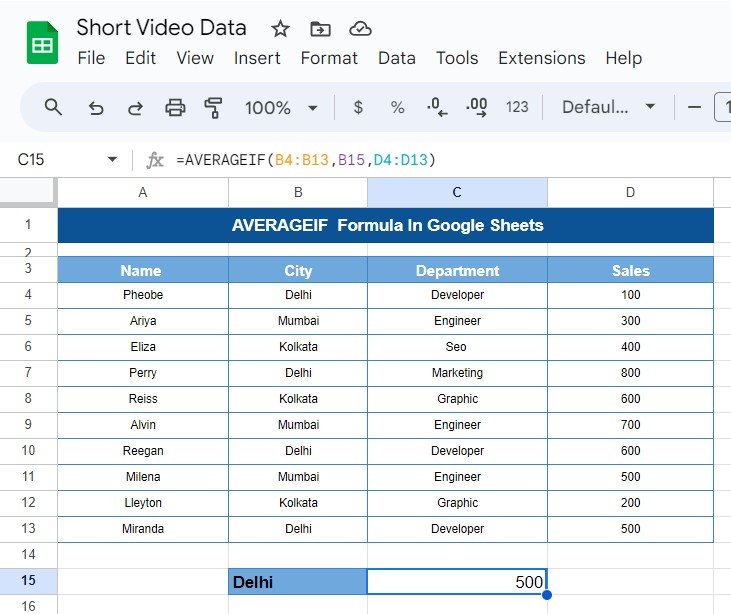
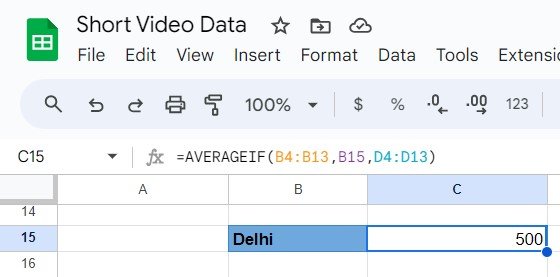
=AVERAGEIF(B4:B13, "Delhi", D4:D13)
Let’s Break It Down
AVERAGEIF(B4, "Delhi", D4)
This formula scans through the City column (B4 to B13), looking for “Delhi.” For every match, it then takes the corresponding Sales figure from D4 to D13 and calculates the average.
What You’ll See
After you plug in the formula, Google Sheets does the math to provide the average sales for Delhi. Here’s what the result looks like:
City Average Sales
Delhi 500
Why This Formula Rocks
By using AVERAGEIF, not only do you streamline your data analysis, but you also unlock quicker insights. This function is particularly useful for sales teams, marketers, and anyone who needs to segment data for better decision-making.
Conclusion
With the AVERAGEIF function at your fingertips, you’re now equipped to slice through data with precision and ease in Google Sheets. Embrace this tool, apply it to your data sets, and experience how simple and enjoyable data analysis can be. Dive in, play around, and let the numbers reveal their stories!
Visit our YouTube channel to learn step-by-step video tutorials
Youtube.com/@NeotechNavigators
View this post on Instagram