Track Real-Time Sales Performance in Google Sheets in real time is crucial for any business. By having up-to-date information, companies can make informed decisions that improve profitability and efficiency. With Google Sheets, you can easily track sales, analyze trends, and visualize performance metrics. In this comprehensive tutorial, we’ll guide you through the process of setting […]
Tag: Sales Analysis
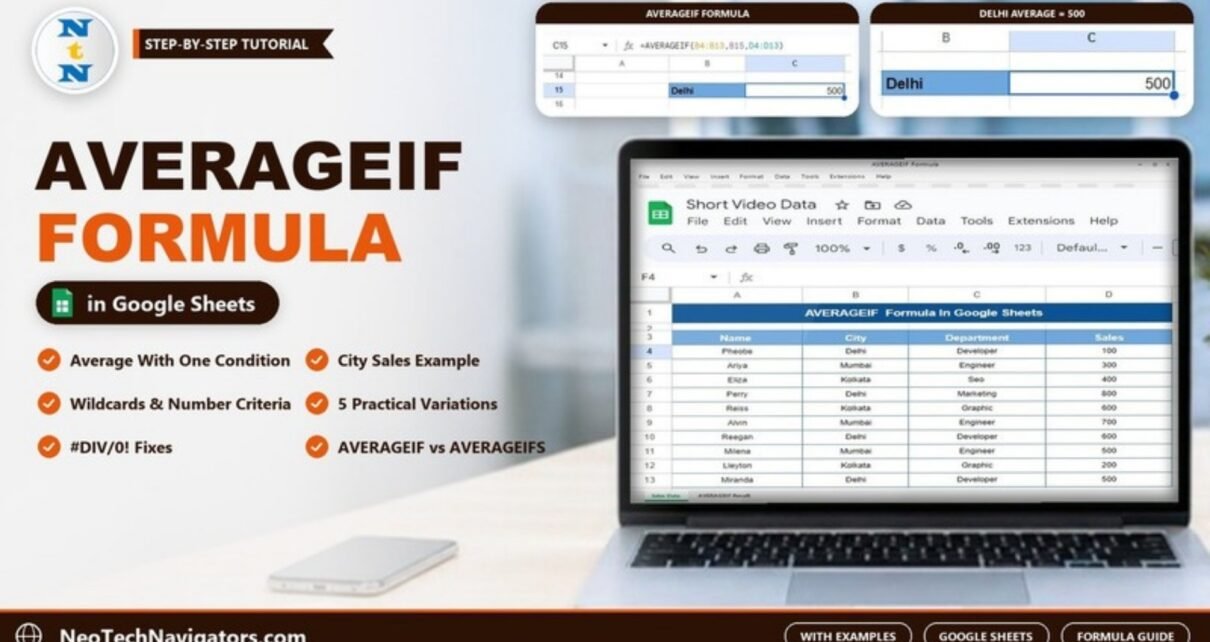
AVERAGEIF Formula in Google Sheets (With Examples)
Learn the AVERAGEIF formula in Google Sheets with a worked city sales example, five variations including wildcards and number conditions, error fixes and when to use AVERAGEIFS.
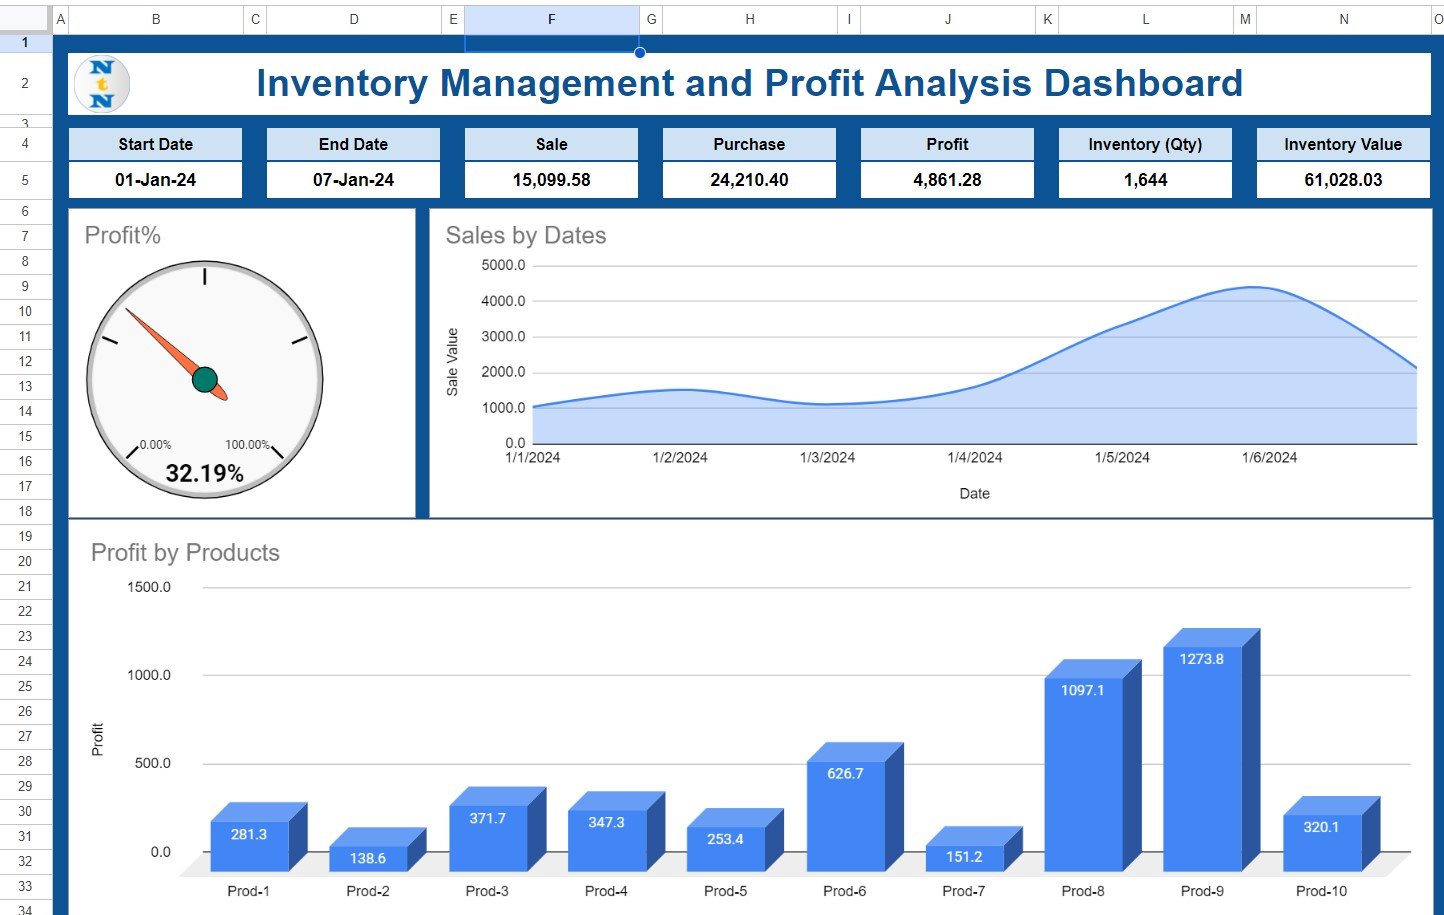
Inventory Management and Profit Analysis Dashboard in Google Sheets
A four-tab Google Sheets template that logs purchases and sales, looks up prices from a product master and shows sales, purchase, profit, Profit% and stock for any date range. See every tab, the formulas and a worked example.
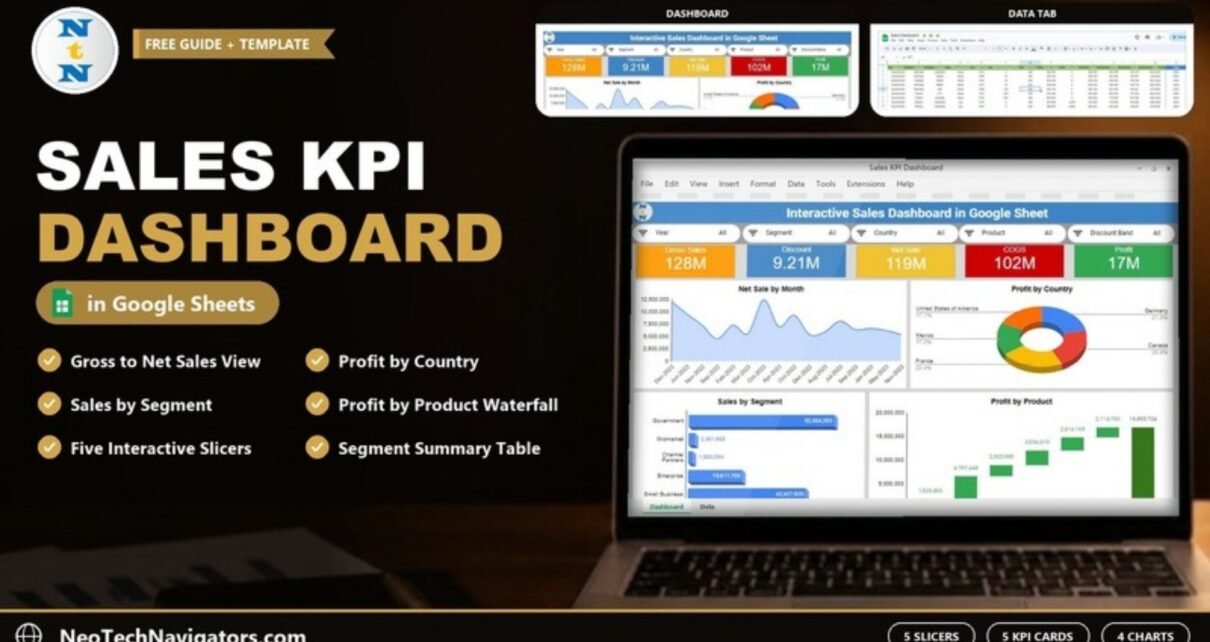
Sales KPI Dashboard in Google Sheets
A ready-made Sales KPI Dashboard in Google Sheets with five slicers, Gross Sales, Discount, Net Sale, COGS and Profit cards, and charts by month, country, segment and product. See how each part works and how to load your own data.