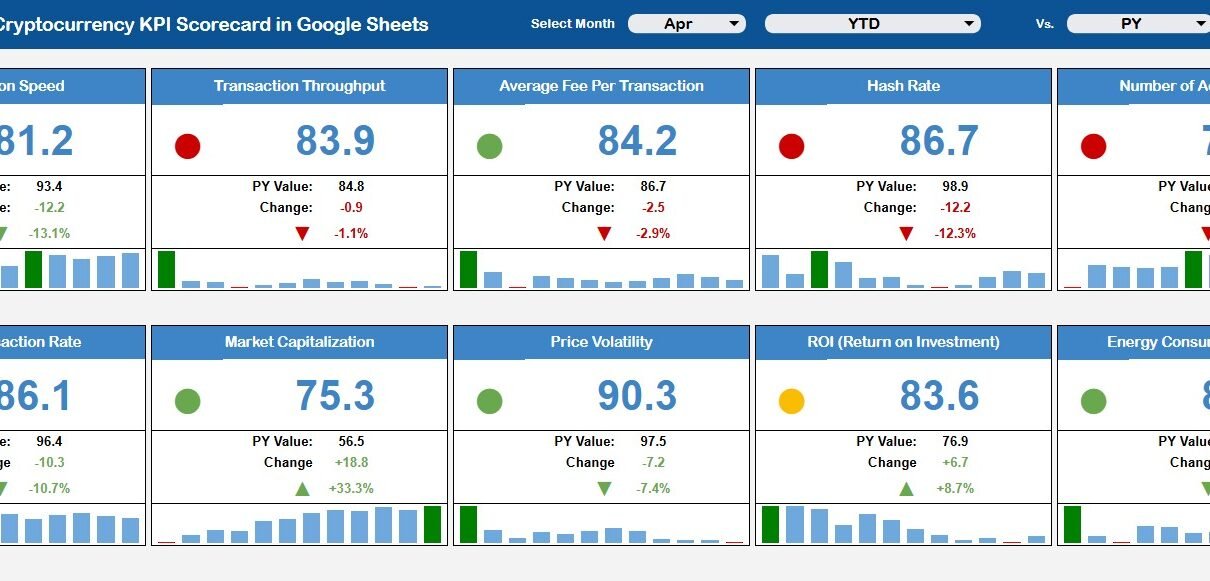
Blockchain and Cryptocurrency KPI Scorecard in Google Sheets helps crypto teams turn recurring metrics into a 5-page monthly review system. It includes 10 overview cards, 10 monthly charts, MTD and YTD comparisons, previous-year benchmarks, KPI definitions, and RAG threshold logic.
The template is built for scorecard reporting, not live trading. You enter or paste KPI values from your wallets, exchanges, block explorers, node tools, or internal exports, then review performance against target and prior-year values. Because it is built in Google Sheets, teams can share the file through Google Drive and manage view, comment, or edit access. Google explains those sharing controls in its Google Docs Editors Help.
Get the template: Blockchain and Cryptocurrency KPI Scorecard in Google Sheets.
Key Features of Blockchain and Cryptocurrency KPI Scorecard in Google Sheets
- 5 tabs: Overview, KPI Trend, KPI Data Sheet, KPI Definition Sheet, and RAG Support Table.
- 10 cards for transaction speed, throughput, fees, hash rate, nodes, failures, market cap, volatility, ROI, and energy use.
- MTD and YTD views for Actual, Target, and Previous Year values.
- RAG thresholds for Upper the Better and Lower the Better KPI types.
- Editable formulas, definitions, units, groups, and KPI direction.
- Google Sheets collaboration without macros or a paid BI license.
Dashboard Pages Explanation
1 – Overview Page
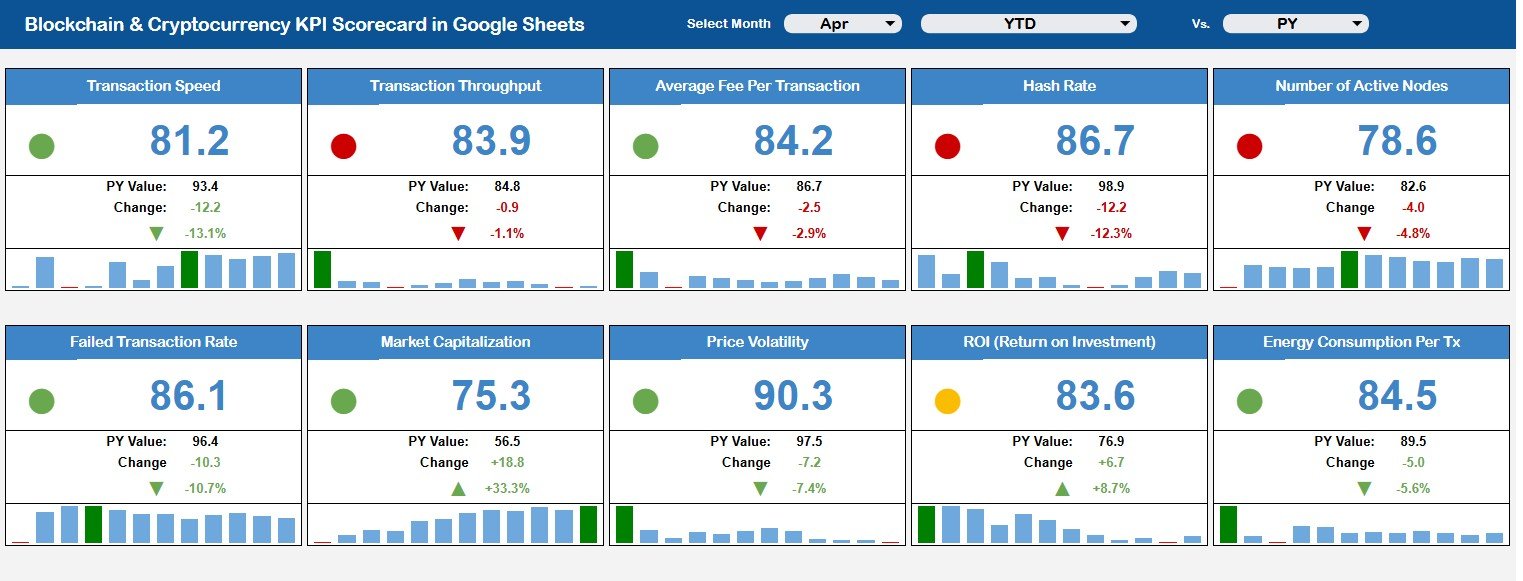
The Overview Page shows the main blockchain and cryptocurrency scorecard view. It includes high-level cards, monthly charts, and slicers for quick filtering.
Cards include Transaction Speed, Transaction Throughput, Average Fee Per Transaction, Hash Rate, Number of Active Nodes, Failed Transaction Rate, Market Capitalization, Price Volatility, ROI (Return on Investment), and Energy Consumption Per Tx.
Transaction Speed by Month
This chart shows whether transaction processing speed is improving or slowing over time. It helps identify congestion, infrastructure strain, or operational delays.
Transaction Throughput by Month
This chart tracks transaction volume by month. It helps teams compare network or platform activity against growth targets.
Average Fee Per Transaction by Month
This chart shows how transaction cost changes over time. It is useful for cost control, user experience review, and treasury planning.
Hash Rate by Month
This chart supports network security and infrastructure review. A stable or rising hash rate can signal stronger network participation.
Number of Active Nodes by Month
This chart tracks monthly active node count. It helps teams review decentralization, network health, and infrastructure reach.
Failed Transaction Rate by Month
This chart highlights the share of transactions that fail. A rising rate can point to wallet issues, smart contract problems, or network congestion.
Market Capitalization by Month
This chart tracks market value movement by month. It helps leadership compare market context with project or portfolio performance.
Price Volatility by Month
This chart shows how unpredictable price movement is becoming. It helps teams separate market risk from operating performance.
ROI by Month
This chart tracks return on investment across months. It supports treasury, portfolio, and project performance reviews.
Energy Consumption Per Tx by Month
This chart monitors energy use per transaction. It is useful for sustainability, infrastructure efficiency, and ESG conversations.
Blockchain and Cryptocurrency KPI Scorecard in Google Sheets
2 — KPI Trend
The KPI Trend tab gives a focused monthly view for selected KPI analysis. It is useful when a red or amber signal needs a clearer explanation.
Number of Active Nodes Target Vs Actual MTD by Month compares monthly performance with target. Number of Active Nodes Actual Vs PY MTD by Month adds prior-year context.
Number of Active Nodes Target Vs Actual YTD by Month shows cumulative progress against plan. Number of Active Nodes Actual Vs PY YTD by Month shows whether year-to-date network participation is ahead of last year.
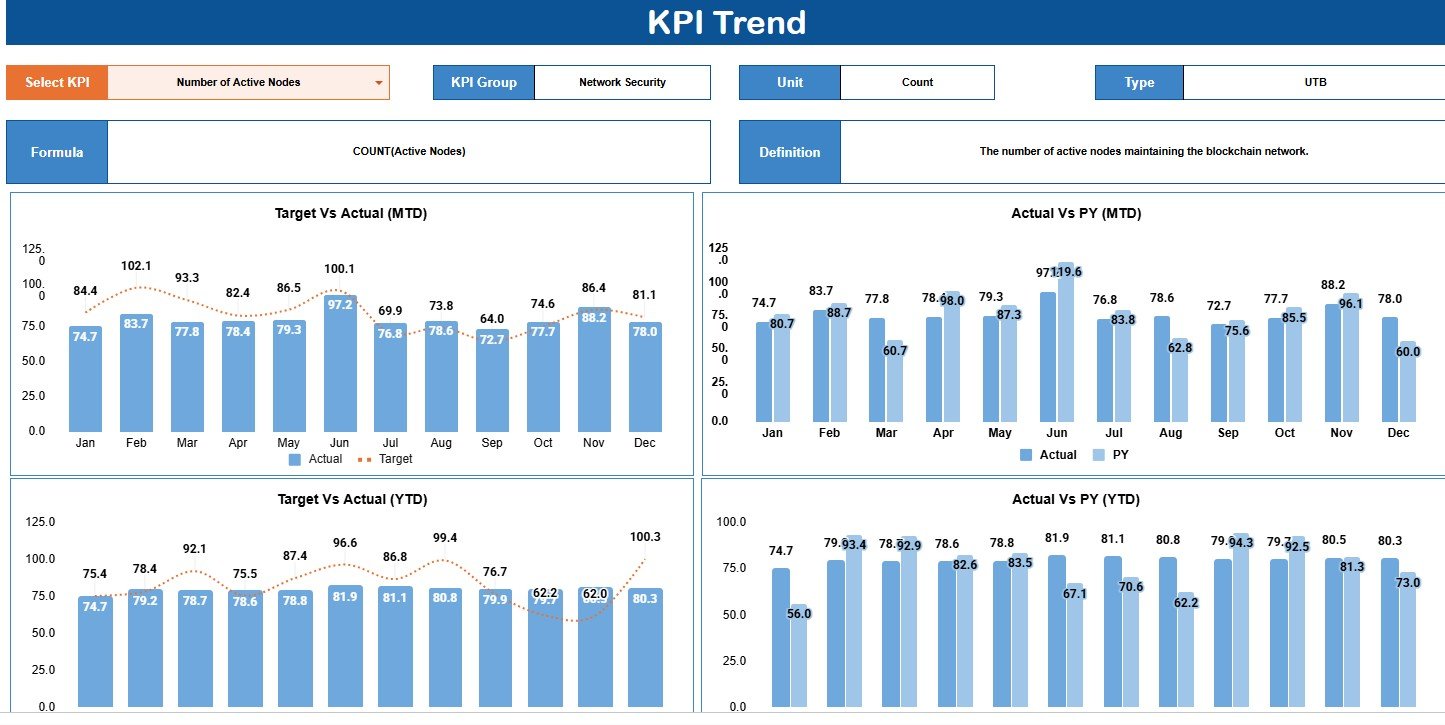
KPI Trend
3 — KPI Data Sheet
The KPI Data Sheet stores MTD Actual, MTD Target, MTD PY, YTD Actual, YTD Target, and YTD PY values by KPI Name and Month. This keeps the reporting model easy to audit because current, target, and prior-year values are separated.
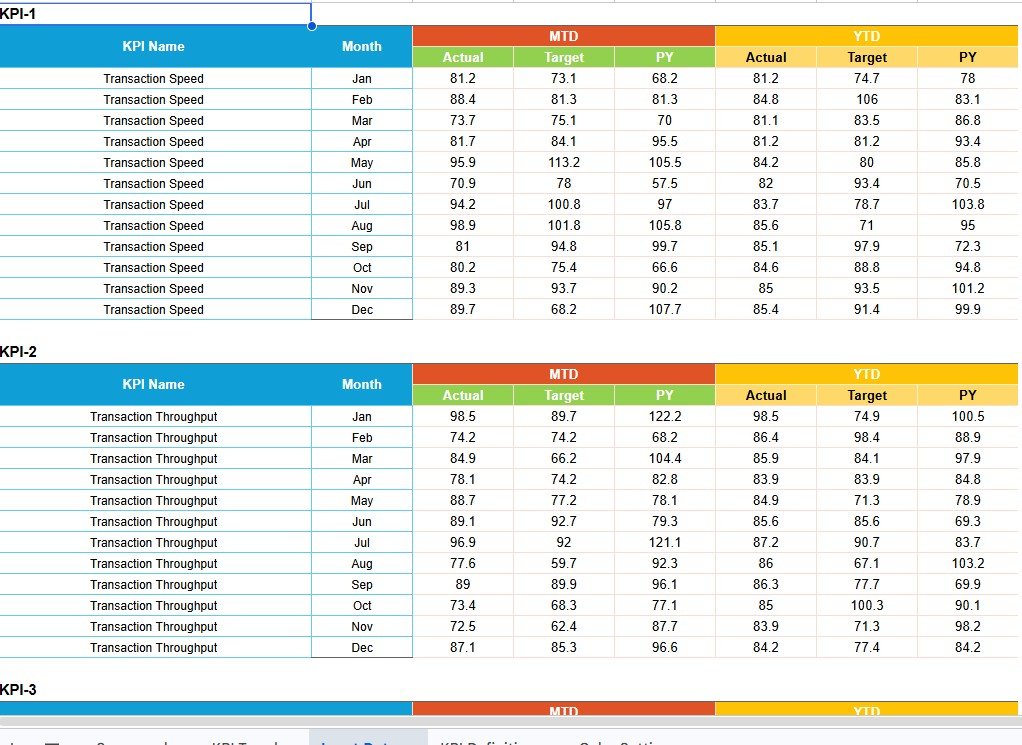
KPI Data Sheet
4 — KPI Definition Sheet
The KPI Definition Sheet documents KPI Group, Unit, Formula, Definition, and Type by KPI Name. This matters in crypto reporting because the same metric can be interpreted differently across chains, exchanges, wallets, and node providers.
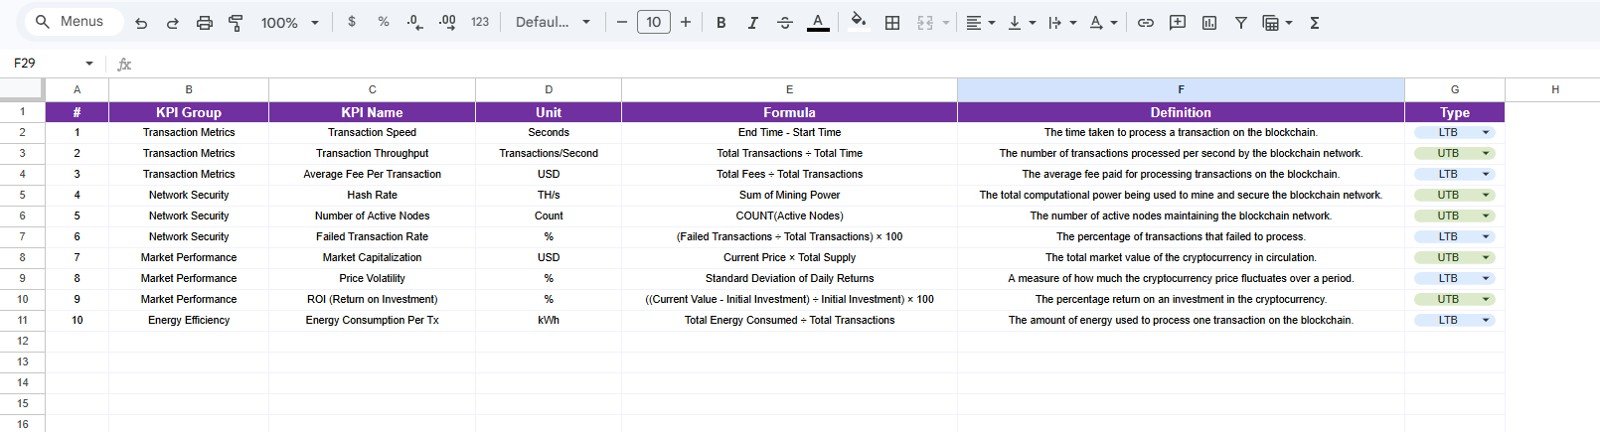
KPI Definition Sheet
5 — RAG Support Table
The RAG Support Table controls red, amber, and green status logic. Upper the Better rules can be used for throughput or active nodes, while Lower the Better rules can be used for fees, failed transactions, or energy consumption per transaction.
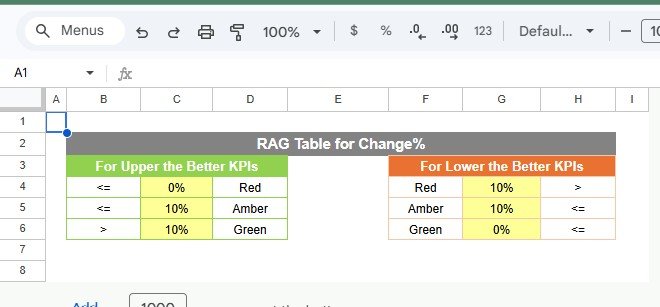
RAG Support Table
Blockchain and Cryptocurrency KPI Scorecard in Google Sheets vs. Microsoft Excel Dashboard vs. Paid CRM/SaaS – Feature Comparison
| Feature | Google Sheets KPI Scorecard | Microsoft Excel Dashboard | Paid Crypto SaaS |
|---|---|---|---|
| Cost | One-time template purchase | Excel license plus workbook setup | Recurring subscription |
| Platform | Google Sheets | Excel or Microsoft 365 | Vendor web platform |
| Setup time | Copy and update KPI values | Download and manage files | Configure users and sources |
| Collaboration | Native Drive sharing | Best through OneDrive | Plan dependent |
| Customization | Edit KPIs, formulas, targets, and thresholds | Highly editable | Limited by vendor |
| Best fit | Monthly scorecard review | Offline analysis | Live automated analytics |
Who Should Use This Template
This template is useful for crypto analysts, Web3 founders, blockchain operations teams, digital asset researchers, consultants, and finance teams that already have KPI data and need a shared reporting structure.
Real-World Use Cases
Crypto Operations Review
An operations analyst can review transaction speed, throughput, fees, failed transaction rate, and active nodes before a monthly network meeting.
Digital Asset Performance Review
A finance lead can track market capitalization, volatility, and ROI against target and previous-year values.
Blockchain Sustainability Reporting
An infrastructure team can monitor energy consumption per transaction alongside hash rate and active node trends.
Advantages of Blockchain and Cryptocurrency KPI Scorecard in Google Sheets
The main advantage is structure. Financial, network, operational, and sustainability metrics often come from different places, and this scorecard gives them one review home. It also keeps formulas, definitions, units, and thresholds visible, so teams can discuss assumptions instead of relying on a black-box report.
Opportunities for Improvement
The template does not connect automatically to exchanges, wallets, chains, or market APIs. Teams that need live data should connect their own data pipeline or use a paid analytics platform. You may also want to adapt KPI groups for your model, such as Layer 1 network, exchange, NFT platform, crypto fund, or Web3 app.
Best Practices
Start with the KPI Definition Sheet before entering data. Confirm each KPI owner, unit, formula, and type.
Set realistic targets, then review RAG thresholds before presenting the scorecard. Failed Transaction Rate and Energy Consumption Per Tx are usually Lower the Better, while Transaction Throughput and Number of Active Nodes are usually Upper the Better.
Keep a monthly close routine so Actual, Target, and Previous Year values are updated at the same cadence.
Explore Relevant Templates
Pair this scorecard with the Blockchain & Cryptocurrency KPI Dashboard in Google Sheets for a chart-led KPI view. For broader reporting, see the Blockchain and Cryptocurrency Dashboard in Google Sheets. Portfolio teams can review the Crypto Portfolio Dashboard in Google Sheets, while fintech teams may like the Fintech Dashboard in Google Sheets.
Browse more options in the Google Sheets template collection or the Google Sheets KPI Dashboard category.
Frequently Asked Questions
Is this scorecard ready to use?
Yes. Copy it into Google Drive and replace the sample data with your own KPI values.
What KPIs are included?
It includes transaction speed, throughput, fees, hash rate, active nodes, failed transactions, market capitalization, volatility, ROI, and energy use.
Does it include MTD and YTD reporting?
Yes. The KPI Data Sheet supports MTD and YTD Actual, Target, and Previous Year values.
Can I change RAG thresholds?
Yes. You can adjust red, amber, and green thresholds by KPI type.
Does it pull live crypto prices?
No. It is a KPI scorecard template, not a live market data connector.
Can I share it with my team?
Yes. Google Sheets supports Drive sharing with view, comment, or edit access.
About the Author
Built by PK – Microsoft Certified Professional with 15+ years of Excel, Google Sheets, and Power BI experience. Founder of NextGenTemplates, reaching 300K+ subscribers across YouTube channels. Every template is hand-built and tested before release.
Conclusion
The Blockchain and Cryptocurrency KPI Scorecard in Google Sheets gives crypto and Web3 teams a practical monthly review format. With 10 KPI cards, trend charts, MTD/YTD comparisons, KPI definitions, and RAG thresholds, it turns scattered metrics into a scorecard your team can discuss.
Use it for network performance review, crypto portfolio updates, Web3 operations meetings, digital asset reporting, or sustainability conversations. For more dashboard tutorials and Google Sheets templates, visit NeoTechNavigators on YouTube.
Last updated: August 15, 2026