Business growth does not happen by chance. It requires clear visibility into revenue, costs, profit, sales channels, and customer behavior. However, many businesses still rely on scattered spreadsheets and manual reports. As a result, decision-making becomes slow and reactive.
Therefore, a Business Growth Dashboard in Google Sheets becomes an essential solution. It transforms raw business data into clear visuals, trends, and actionable insights. Moreover, it helps leadership teams monitor performance in real time without complex tools or high costs.
In this article, we explain what a Business Growth Dashboard in Google Sheets is, how it works, its structure, key metrics, advantages, best practices, and common questions. Additionally, you will understand how this ready-to-use dashboard supports smarter and faster business decisions.
What Is a Business Growth Dashboard in Google Sheets?
A Business Growth Dashboard in Google Sheets is a centralized reporting and analytics tool that tracks financial and operational performance in one interactive file. Instead of reviewing multiple reports, users can analyze revenue, profit, costs, and units sold from a single dashboard.
Moreover, Google Sheets makes this dashboard accessible from anywhere. Teams can collaborate in real time, apply filters instantly, and analyze performance across different dimensions such as region, category, sales channel, product, and time.
As a result, businesses gain clarity on what drives growth and what limits profitability.
Why Use a Business Growth Dashboard?
Click to Buy Business Growth Dashboard in Google sheets
Many businesses face common challenges such as delayed reporting, data silos, and unclear performance indicators. A Business Growth Dashboard solves these issues effectively.
Key Reasons to Use This Dashboard
-
It provides real-time visibility into business performance
-
It highlights growth trends and profit drivers
-
It reduces manual reporting effort
-
It supports data-driven strategic decisions
-
It improves cross-team alignment
Therefore, this dashboard becomes a powerful decision-support system for owners, managers, and analysts.
Structure of the Business Growth Dashboard in Google Sheets
This is a ready-to-use dashboard designed with multiple analysis pages. Each sheet focuses on a specific growth dimension while remaining fully interactive.
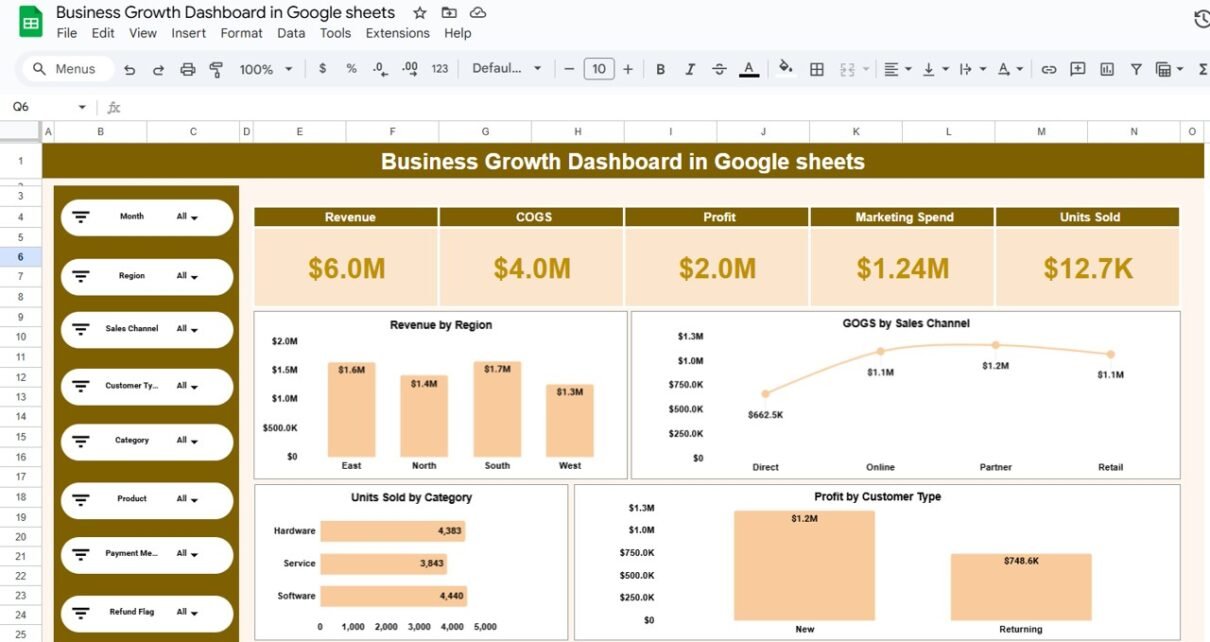
Overview Sheet Tab
The Overview sheet is the main control center of the dashboard. It summarizes business performance at a glance.
Key KPI Cards
The top section displays high-level KPIs:
-
Revenue
-
COGS (Cost of Goods Sold)
-
Profit
-
Marketing Spend
-
Units Sold
These KPIs update automatically based on selected filters.
Key Charts on Overview Page
-
Revenue by Region – Identifies top-performing regions
-
COGS by Sales Channel – Highlights cost efficiency
-
Units Sold by Category – Shows demand distribution
-
Profit by Customer Type – Compares new vs. returning customers
Filters and Search Options
Users can filter data by:
- Month
- Region
- Sales Channel
- Customer Type
- Category
- Product
- Payment Method
- Refund Flag
As a result, users can drill down into specific performance scenarios instantly.

Click to Buy Business Growth Dashboard in Google sheets
Region Analysis Sheet
The Region Analysis sheet helps businesses understand geographical performance differences.
Charts Included
-
Revenue by Region
-
COGS by Region
-
Profit by Region
-
Units Sold by Region
This analysis helps identify high-growth regions, cost-heavy areas, and profit opportunities. Moreover, it supports regional expansion planning and resource allocation.

Click to Buy Business Growth Dashboard in Google sheets
Sales Channel Analysis Sheet
The Sales Channel Analysis sheet focuses on channel-wise performance.
Charts Included
-
Revenue by Sales Channel
-
COGS by Sales Channel
-
Profit by Sales Channel
-
Units Sold by Sales Channel
This sheet helps businesses evaluate whether Direct, Online, Partner, or Retail channels deliver better margins and scalability.

Click to Buy Business Growth Dashboard in Google sheets
Category Analysis Sheet
The Category Analysis sheet highlights performance by product or service category.
Charts Included
-
Revenue by Category
-
COGS by Category
-
Profit by Category
-
Units Sold by Category
This analysis helps decision-makers identify which categories drive growth and which require optimization or discontinuation.

Click to Buy Business Growth Dashboard in Google sheets
Monthly Trends Sheet
The Monthly Trends sheet tracks performance over time.
Charts Included
-
Revenue by Month
-
COGS by Month
-
Profit by Month
-
Units Sold by Month
This trend analysis supports seasonality identification, forecasting, and performance benchmarking.

Click to Buy Business Growth Dashboard in Google sheets
Key Metrics Tracked in the Dashboard
The dashboard tracks essential business growth KPIs such as:
- Revenue
- Cost of Goods Sold (COGS)
- Gross Profit
- Marketing Spend
- Units Sold
- Profit Margin (derived)
- Customer Type Performance
- Channel-wise Profitability
Each metric updates dynamically based on filters and selections.
How This Dashboard Supports Decision-Making
A Business Growth Dashboard does more than reporting. It enables smarter decisions.
Strategic Benefits
-
Identify high-profit regions and channels
-
Optimize marketing and operational costs
-
Improve pricing and product mix decisions
-
Track growth trends and risks early
-
Align teams around shared performance goals
As a result, leadership can act faster and with greater confidence.
Advantages of Business Growth Dashboard in Google Sheets
Click to Buy Business Growth Dashboard in Google sheets
-
Fully cloud-based and accessible anywhere
-
No coding or advanced BI tools required
-
Real-time collaboration
-
Interactive filters and visuals
-
Cost-effective and scalable
-
Easy customization for any business
Best Practices for Using This Dashboard
-
Keep input data clean and updated
-
Review trends monthly, not just totals
-
Compare profit, not only revenue
-
Use filters to identify hidden insights
-
Share access with stakeholders for transparency
Following these best practices ensures maximum value from the dashboard.
Who Can Use This Dashboard?
Click to Buy Business Growth Dashboard in Google sheets
This dashboard is ideal for:
-
Small and medium businesses
-
Startups and founders
-
Finance and operations teams
-
Sales and marketing managers
-
Business analysts
-
Consultants and advisors
Any organization focused on growth can benefit from this dashboard.
Frequently Asked Questions (FAQs)
Click to Buy Business Growth Dashboard in Google sheets
Is this dashboard fully ready to use?
Yes. It is a ready-to-use Google Sheets dashboard. You only need to connect or paste your data.
Can I customize KPIs and charts?
Yes. You can easily modify KPIs, charts, and layouts based on your business needs.
Does this dashboard support real-time collaboration?
Yes. Google Sheets allows multiple users to work simultaneously.
Can this dashboard handle large datasets?
Yes. It can handle thousands of rows efficiently with proper data structure.
Is this suitable for startups?
Absolutely. It is cost-effective, flexible, and ideal for early-stage growth tracking.
Conclusion
A Business Growth Dashboard in Google Sheets is a powerful tool for tracking performance, understanding trends, and driving smarter decisions. It replaces scattered reports with one clear, interactive view of your business.
Visit our YouTube channel to learn step-by-step video tutorials
Youtube.com/@NeotechNavigators
Watch the step-by-step video tutorial: