The cannabis industry is rapidly evolving, with businesses needing to track operations, sales, production, and regulatory compliance efficiently. The Cannabis Industry KPI Dashboard in Google Sheets is a ready-to-use solution for monitoring critical key performance indicators (KPIs) to make data-driven decisions.Cannabis Industry KPI Dashboard in Google Sheets
This dashboard helps managers, executives, and operations teams visualize monthly and yearly performance, compare targets with actuals, and track trends across all critical KPIs.Cannabis Industry KPI Dashboard in Google Sheets
What Is a Cannabis Industry KPI Dashboard in Google Sheets?
A Cannabis Industry KPI Dashboard is an interactive Google Sheets tool designed to consolidate performance metrics in one place. It allows cannabis businesses to monitor key operations, including:
-
Cultivation and production efficiency
-
Sales and revenue metrics
-
Compliance and regulatory KPIs
-
Inventory management
-
Marketing and customer engagement
With this dashboard, businesses can track MTD (Month-to-Date) and YTD (Year-to-Date) performance, compare with previous year data, and identify growth opportunities.
Key Features of the Cannabis Industry KPI Dashboard in Google Sheets
Click to Buy Cannabis Industry KPI Dashboard in Google Sheets
This dashboard is structured with 6 worksheets, each serving a unique purpose:
1. Dashboard Sheet Tab
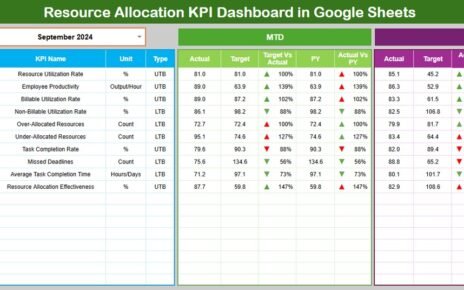
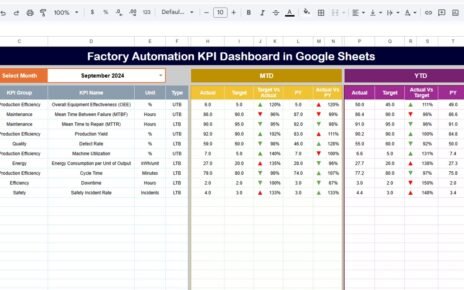
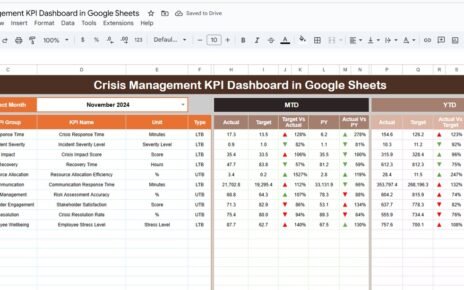
The Dashboard Sheet is the main page displaying all KPIs at a glance.
Key Features:
-
Month Selection Dropdown (Range D3): Updates all metrics for the selected month
-
MTD Metrics: Actual, Target, and Previous Year values with conditional formatting arrows
-
YTD Metrics: Tracks cumulative performance with target vs actual and PY vs actual comparisons
This sheet allows quick visualization of business performance across multiple KPIs.

Click to Buy Cannabis Industry KPI Dashboard in Google Sheets
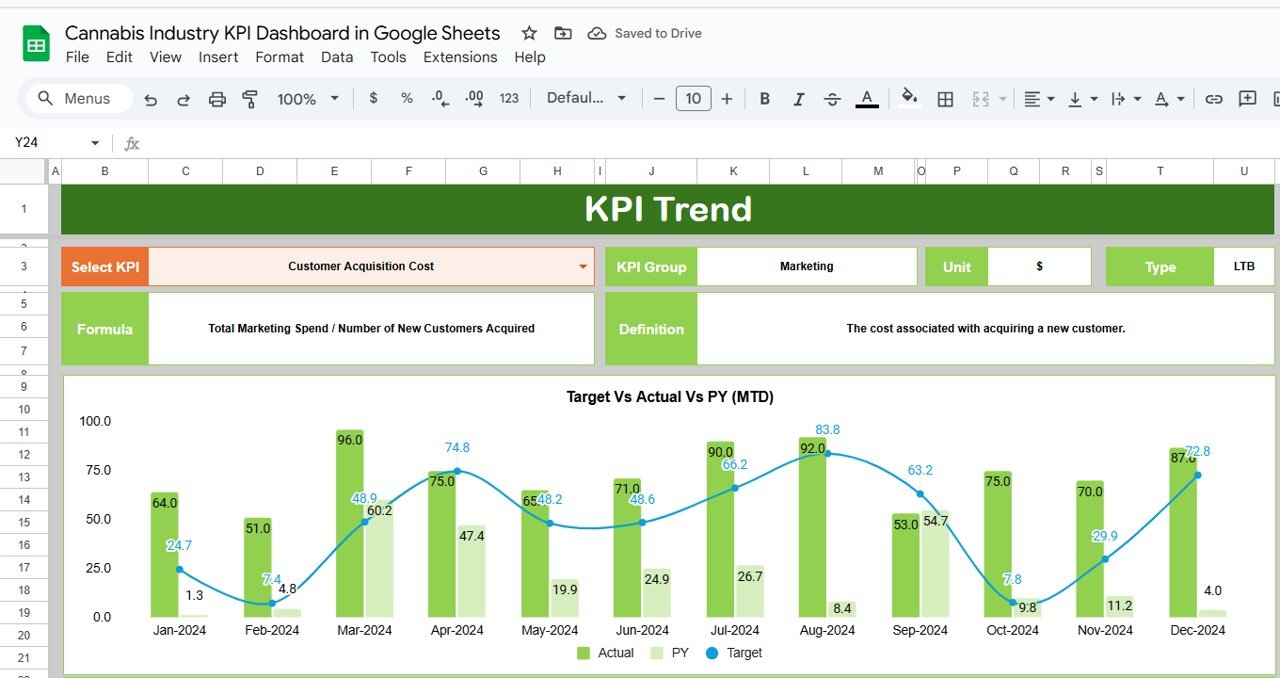
2. KPI Trend Sheet Tab
The KPI Trend Sheet provides detailed analysis for each KPI:
-
Select a KPI from the dropdown in Range C3
-
Displays KPI Group, Unit, and Type (Upper-the-Better or Lower-the-Better)
-
Shows KPI Formula and Definition
-
Tracks trends over time for performance monitoring
This sheet is ideal for identifying underperforming areas and monitoring improvement initiatives.
3. Actual Numbers Sheet Tab
-
Enter MTD and YTD actuals for each KPI
-
Update the month in Range E1 to adjust calculations for the year
Accurate data input ensures the dashboard reflects true performance.

Click to Buy Cannabis Industry KPI Dashboard in Google Sheets
4. Target Sheet Tab
-
Enter MTD and YTD targets for all KPIs
-
Enables comparison between actual performance and planned goals
Tracking targets helps businesses stay aligned with strategic objectives.

5. Previous Year Numbers Sheet Tab
-
Input last year’s KPI numbers for comparison
-
Supports year-over-year analysis to identify trends and growth patterns
This sheet helps businesses understand seasonal variations and long-term improvements.

Click to Buy Cannabis Industry KPI Dashboard in Google Sheets
6. KPI Definition Sheet Tab
-
Document KPI Name, KPI Group, Unit, Formula, Definition, and Type (Upper-the-Better or Lower-the-Better)
-
Ensures consistent measurement and understanding of all KPIs
This sheet acts as a reference guide for executives, managers, and analysts.

Advantages of Using the Cannabis Industry KPI Dashboard
-
Centralized Tracking: Consolidate all cannabis business metrics in one sheet
-
Real-Time Insights: Update numbers and view performance immediately
-
Trend Analysis: Compare MTD, YTD, and previous year for all KPIs
-
Identify Growth Opportunities: Quickly spot underperforming areas
-
Decision-Making Support: Data-driven insights for managers and executives
-
Customizable: Add or remove KPIs to suit business objectives
Best Practices for Using the Dashboard
Click to Buy Cannabis Industry KPI Dashboard in Google Sheets
-
Update Data Promptly: Ensure actuals are entered monthly for accurate reporting
-
Define Clear Targets: Track performance against achievable and measurable goals
-
Monitor KPI Trends: Use the KPI Trend sheet to analyze long-term patterns
-
Segment KPIs by Operations: Track cultivation, sales, compliance, and marketing separately
-
Leverage Conditional Formatting: Use arrows and color codes to identify KPI performance quickly
-
Review Year-over-Year Data: Understand growth, seasonality, and operational improvements
How This Dashboard Helps Cannabis Businesses
-
Optimize Production: Track yield and cultivation efficiency
-
Increase Sales: Monitor revenue, average order value, and conversion rates
-
Ensure Compliance: Track incidents and regulatory adherence
-
Improve Marketing: Evaluate campaign ROI and lead conversion
-
Support Strategic Decisions: Allocate resources based on KPI trends
Frequently Asked Questions (FAQs)
Click to Buy Cannabis Industry KPI Dashboard in Google Sheets
Q1: Can I customize the KPIs in this dashboard?
Yes, you can add or remove KPIs, adjust formulas, and modify the dashboard to fit your cannabis business.
Q2: How often should data be updated?
Monthly updates are recommended, but critical metrics can be updated weekly for real-time insights.
Q3: Can I track both cultivation and sales KPIs?
Absolutely. You can categorize KPIs for cultivation, sales, marketing, compliance, and operations.
Q4: Does the dashboard show trends over time?
Yes, the KPI Trend sheet tracks monthly and YTD trends, as well as previous year comparisons.
Q5: Is this dashboard suitable for multi-location businesses?
Yes, you can include location-based KPIs for multi-location cannabis operations.
Conclusion
The Cannabis Industry KPI Dashboard in Google Sheets is a comprehensive tool for monitoring, analyzing, and improving business performance. With MTD, YTD, and year-over-year comparisons, it helps cannabis businesses track operations efficiently, identify growth opportunities, and make data-driven decisions to optimize profitability and compliance.
Visit our YouTube channel to learn step-by-step video tutorials
Youtube.com/@NeotechNavigators
Watch the step-by-step video Demo:
Click to Buy Cannabis Industry KPI Dashboard in Google Sheets