Most carpentry workshops already know their turnover. Far fewer can say, without digging, whether sheet waste crept up last quarter, how many hours the panel saw and the CNC actually stood idle, or what share of fitted jobs pulled a joiner back for a snag visit. Those answers live in cut lists, job folders, machine log books and somebody’s memory – not on a page you can put in front of a foreman.Carpentry Workshop KPI Scorecard in Google Sheets
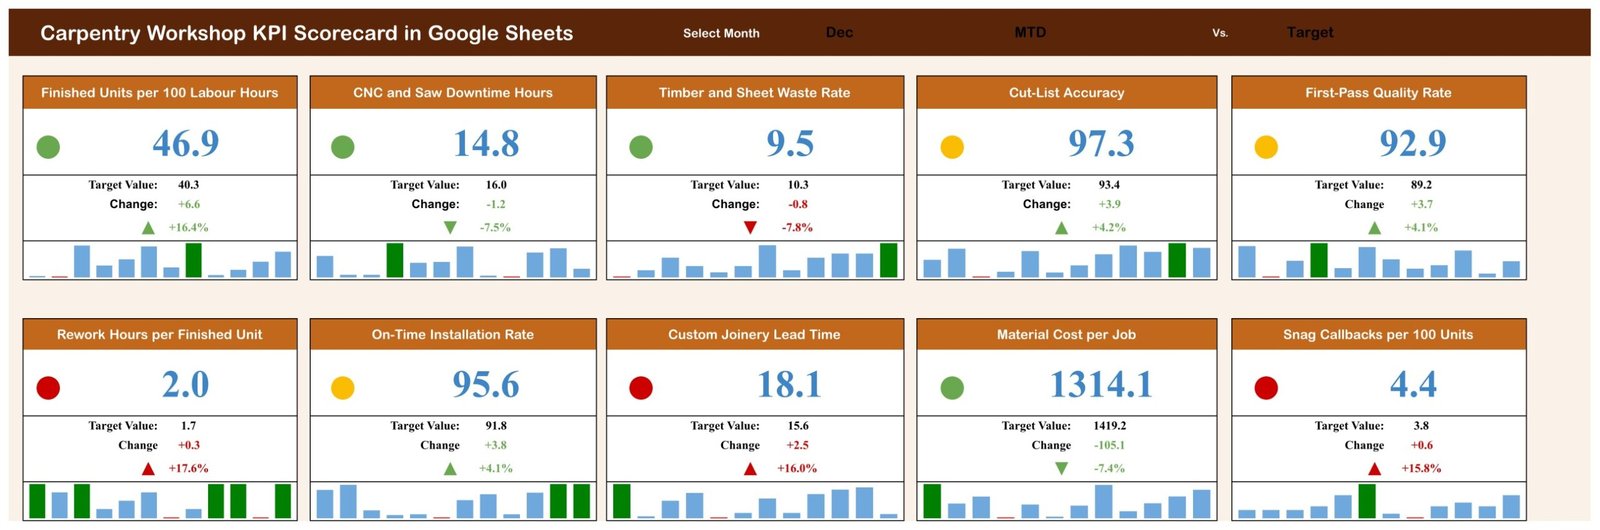
The Carpentry Workshop KPI Scorecard in Google Sheets is that page. Ten joinery KPIs, grouped five ways, each scored green, amber or red against that month’s target. In the sample December built into the file, four KPIs land green, three amber and three red: Finished Units per 100 Labour Hours at 46.9 against a target of 40.3, Cut-List Accuracy at 97.3 against 93.4, and Custom Joinery Lead Time at 18.1 days against a target of 15.6. Change the month in one dropdown and all ten cards, all ten arrows and all ten mini charts redraw.Carpentry Workshop KPI Scorecard in Google Sheets
Get the Carpentry Workshop KPI Scorecard in Google Sheets
Key Features of the Carpentry Workshop KPI Scorecard in Google Sheets
- 10 KPIs in 5 groups. Production & Throughput (Finished Units per 100 Labour Hours, CNC and Saw Downtime Hours), Cutting & Material Yield (Timber and Sheet Waste Rate, Cut-List Accuracy), Quality & Rework (First-Pass Quality Rate, Rework Hours per Finished Unit), Delivery & Scheduling (On-Time Installation Rate, Custom Joinery Lead Time) and Cost & Aftercare (Material Cost per Job, Snag Callbacks per 100 Units).
- A single month picker. One Select Month control drives the whole board.
- A comparison switch. The banner also sets the basis – MTD or YTD – and theCarpentry Workshop KPI Scorecard in Google Sheets benchmark – Target or PY – so the same ten cards can be read four ways.
- Direction-aware traffic lights. Every KPI is tagged UTB (upper-the-better) or LTB (lower-the-better), so a rising Custom Joinery Lead Time is scored as a slip while a rising Cut-List Accuracy is scored as a win.Carpentry Workshop KPI Scorecard in Google Sheets
- Target, change and percentage move on every card, with a coloured up or down arrow – Rework Hours per Finished Unit at +17.6% does not look like Cut-List Accuracy at +4.2%.Carpentry Workshop KPI Scorecard in Google Sheets
- A twelve-month mini bar chart inside each card, with the selected month picked out, so you see the year’s shape without leaving the page.Carpentry Workshop KPI Scorecard in Google Sheets
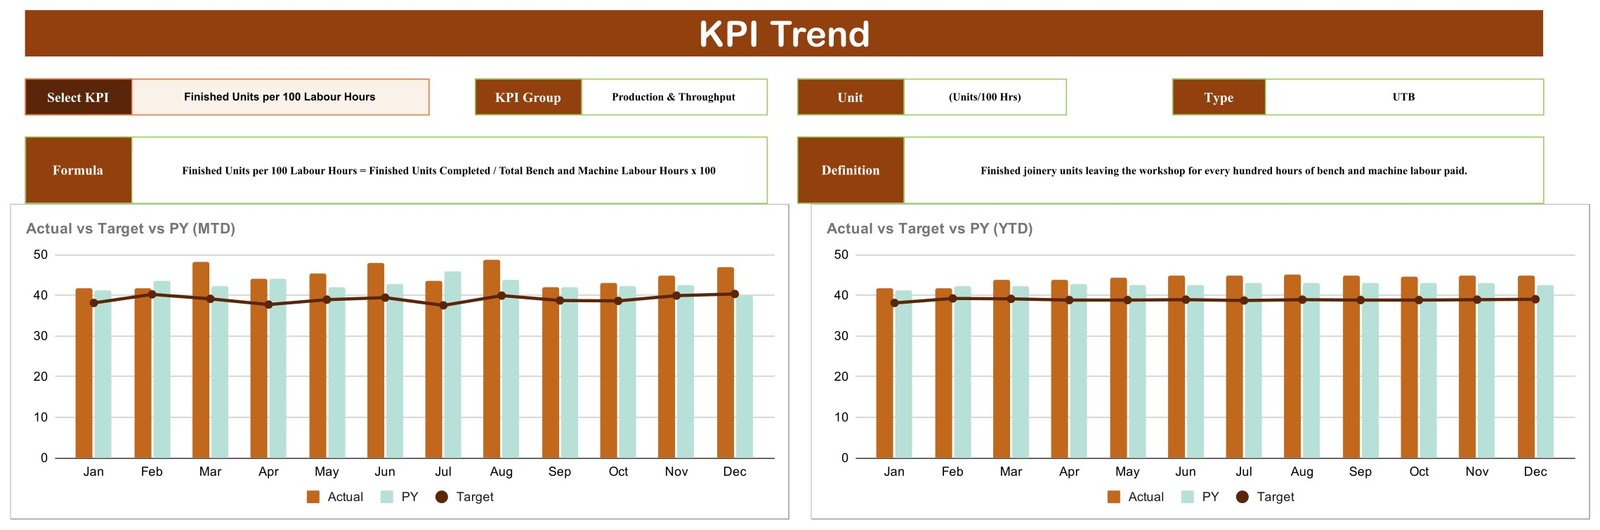
- A KPI Trend page that prints the chosen KPI’s group, unit, type, exact formula and plain-English definition above Actual vs Target vs PY charts on both an MTD and a YTD basis.Carpentry Workshop KPI Scorecard in Google Sheets
- A KPI Analysis page – the full reference table of all ten KPIs with number, group, name, unit, formula, definition and UTB/LTB direction.Carpentry Workshop KPI Scorecard in Google Sheets
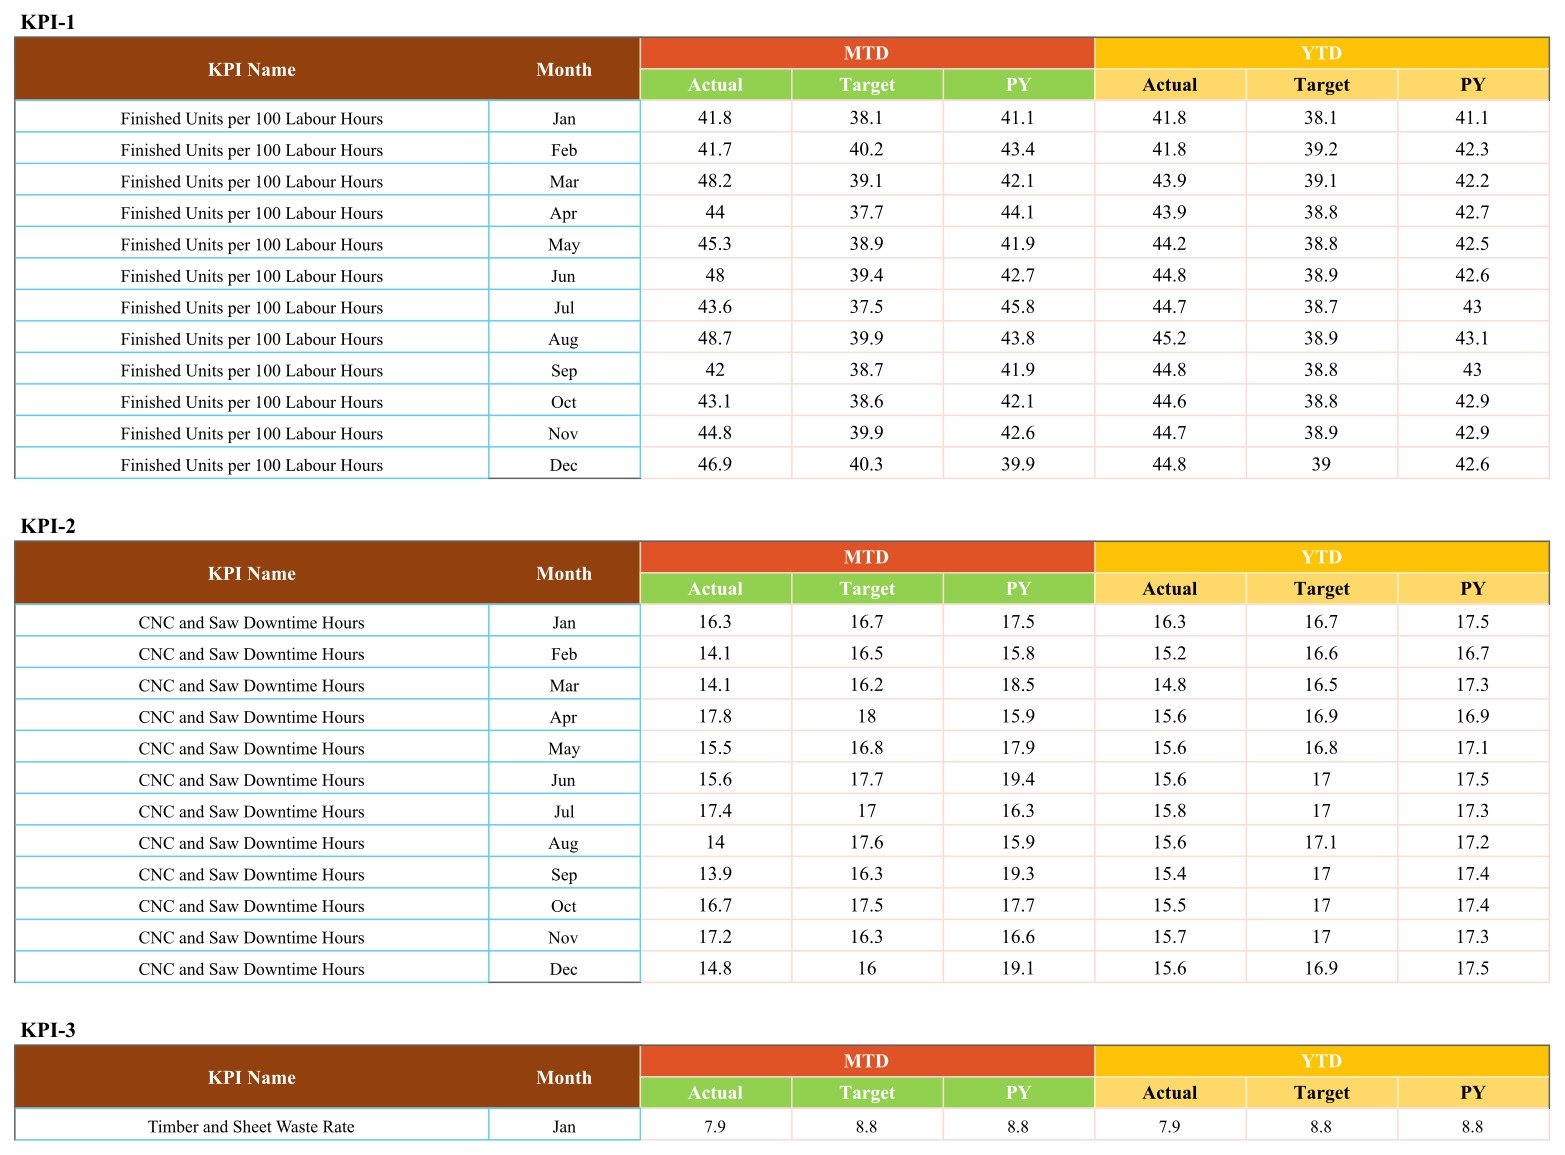
- One Data sheet holding twelve months per KPI: MTD Actual, Target and PY plus the YTD Actual, Target and PY.Carpentry Workshop KPI Scorecard in Google Sheets
- No add-ons, macros or scripts. A free Google account and any browser is the whole requirement.Carpentry Workshop KPI Scorecard in Google Sheets
Dashboard Pages Explanation
1. KPI Scorecard
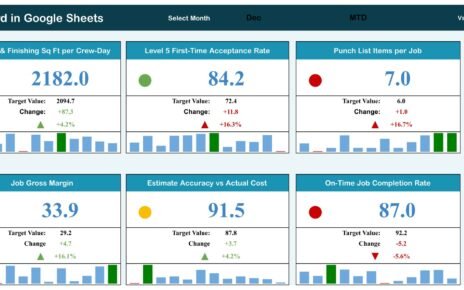
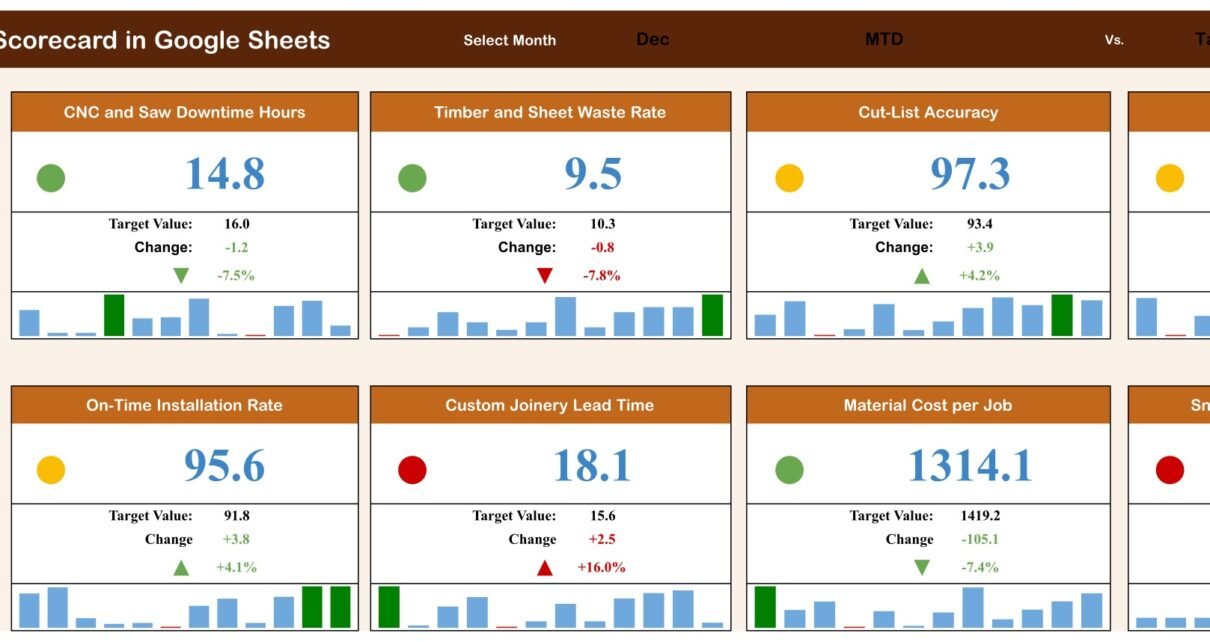
The board itself: a brown title banner carrying the month picker, the MTD/YTD basis and the Target/PY benchmark, then ten cards in two rows of five. Each card shows the KPI name, its traffic light, the value for the selected month, the target value, the absolute change, the percentage move with a coloured arrow, and a twelve-month bar strip. In the sample December, Finished Units per 100 Labour Hours reads 46.9 against 40.3 (+6.6, +16.4%, green), CNC and Saw Downtime Hours 14.8 against 16.0 (-1.2, -7.5%, green), Timber and Sheet Waste Rate 9.5 against 10.3 (green), Material Cost per Job 1,314.1 against 1,419.2 (-105.1, -7.4%, green), while Rework Hours per Finished Unit at 2.0 against 1.7, Custom Joinery Lead Time at 18.1 against 15.6 and Snag Callbacks per 100 Units at 4.4 against 3.8 all sit red.Carpentry Workshop KPI Scorecard in Google Sheets
2. KPI Trend
Pick one KPI from the Select KPI dropdown and the page fills in the rest: KPI Group, Unit, Type, the exact formula and a one-line definition. Underneath sit two charts – Actual vs Target vs PY (MTD) and Actual vs Target vs PY (YTD) – each running January to December with Actual as a bar, PY as a second bar and Target as a line. Selecting Finished Units per 100 Labour Hours, for example, prints the formula Finished Units Completed / Total Bench and Machine Labour Hours x 100, the group Production & Throughput, the unit (Units/100 Hrs) and the type UTB.Carpentry Workshop KPI Scorecard in Google Sheets
3. KPI Analysis
One reference table covering all ten KPIs: number, KPI Group, KPI Name, Unit, Formula, Definition and Type. It is the page to hand a new machinist or bench joiner, because it settles what each measure means – “Snag Callbacks per 100 Units = Post-Installation Snag Visits / Units Installed x 100”, “return visits raised for sticking doors, proud joints or finish defects after handover”.Carpentry Workshop KPI Scorecard in Google Sheets

4. Data
Ten blocks, one per KPI, twelve rows each. Every row carries the month plus MTD Actual, MTD Target, MTD PY, YTD Actual, YTD Target and YTD PY. This is the only sheet anyone types into; the scorecard and both trend charts read from it.
Carpentry Workshop KPI Scorecard vs. an Excel Scorecard vs. Paid Shop-Floor SaaS – Feature Comparison
| This Google Sheets scorecard | An Excel KPI scorecard | Paid job-costing / shop-floor SaaS | |
|---|---|---|---|
| Cost model | One-time purchase | One-time purchase | Per-user subscription |
| Platform | Any browser, free Google account | Microsoft Excel desktop | Vendor web and mobile app |
| Time to first scored month | Copy the file, type one month – under an hour | Open the workbook, replace the sample data | Onboarding and workshop training |
| Collaboration | Native Sheets sharing, view or edit | Shared drive or Microsoft 365 | Built in |
| Editable KPI list | Rename, redefine and re-target all ten | Yes | Only the fields the vendor exposes |
| Traffic lights against target | Yes, direction-aware on every KPI | Yes | Usually, on reporting plans |
| Data capture | Manual, twelve rows per KPI per year | Manual | Captured from job and machine entries |
| Cost at five users, year one | The purchase price, once | The purchase price, once | Five seats cost five times one |
Who Should Use This Template
Bespoke joinery shops, cabinet makers, shopfitters and small furniture workshops – anywhere a handful of benches, a panel saw, a CNC router and a planer turn timber and sheet stock into fitted units. It suits an owner who reviews the month with a shop foreman, a production lead reporting to partners, and any workshop that has been asked for “a KPI report” and does not want to build one from scratch.Carpentry Workshop KPI Scorecard in Google Sheets
It is not for you if you need live shop-floor data. Nothing here connects to a CNC controller, an accounting package or a job-management system; there is no import, no alerting and no scheduling. Somebody types twelve numbers per KPI per year. That is also its strength – it works whatever software and machinery you already run.
Real-World Use Cases
A nine-bench bespoke joinery shop. The monthly review used to be a stack of snag sheets. Now the owner opens the scorecard, sees Rework Hours per Finished Unit at 2.0 against a 1.7 target in red while First-Pass Quality Rate sits amber at 92.9, and spends the meeting on jointing and sizing rather than guessing.
A shopfitting workshop reporting to partners. Finished Units per 100 Labour Hours and Material Cost per Job sit on the same page with twelve-month bar strips under each, so the productivity story and the cost story are read together instead of in two separate spreadsheets.
A cabinet-making business handed to the next generation. The KPI Analysis page becomes the definition sheet for the machinists, so “snag callback” and “rework” mean the same thing to everybody, and targets get set one KPI at a time on the Data sheet.
Advantages of the Carpentry Workshop KPI Scorecard
- One page, one verdict. Ten measures, ten coloured dots, no scrolling and no pivot tables.
- Direction is built in. LTB KPIs such as Timber and Sheet Waste Rate and CNC and Saw Downtime Hours are scored in reverse, so a fall is correctly a win.
- Trend without extra work. The mini bar strip on each card and the two KPI Trend charts come from the same twelve rows you already typed.
- Four readings of the same board. MTD or YTD, against Target or against last year, from one banner.
- Cheap to share. Send a view-only link to the foreman; no licence, no seat count, no install.
- Fully editable. Every KPI name, formula text, unit, target and direction type is yours to change.
Opportunities for Improvement
- Manual entry. Twelve months x ten KPIs of MTD and YTD figures is a monthly habit somebody has to keep.
- No alerts. A KPI turning red is visible the next time the sheet is opened; nothing emails or notifies.
- Monthly grain. The file reports months, not jobs, weeks or shifts – it will not tell you which job blew the material budget.
- Ten slots. Adding an eleventh KPI means extending the Data sheet and the card layout by hand.
- Sample data is demonstration data. The twelve months shipped in the file exist so the charts and lights have something to draw.
Best Practices
- Set targets before the first month. A traffic light is only as honest as the target behind it – agree the ten targets with the foreman first.
- Fix the definitions early. Edit the KPI Analysis page so each formula matches how your workshop actually counts finished units, rework hours and callbacks.
- Enter the month on the same day each month. Tie it to the point when jobs are closed out, so YTD figures stay comparable.
- Read the red ones on the Trend page. The twelve-month chart usually shows whether a red card is one bad month or a slow drift.
- Share view-only. Give machinists and fitters the link without edit rights so nobody nudges a target.
- Start a fresh copy each January rather than overwriting, so last year’s board stays readable.
Explore Relevant Templates
The same scorecard engine ships for other trades – see the Masonry Contractor KPI Scorecard in Google Sheets, the Welding Shop KPI Scorecard in Google Sheets, the Flooring Installation KPI Scorecard in Google Sheets and the Painting Contractor KPI Scorecard in Google Sheets.
For the wider wood business rather than the monthly scorecard, the Wood and Furniture Manufacturing Dashboard in Excel and the Wood & Furniture Manufacturing KPI Dashboard in Power BI are the natural companions.
If you would like to learn how reporting like this is built, the Excel Pivot Tables & Dashboards course on NextGenTemplates Academy is a good place to start, with practice files included.
Get the Carpentry Workshop KPI Scorecard in Google Sheets
Frequently Asked Questions
Is this the KPI Scorecard or the KPI Dashboard?
The KPI Scorecard. It is a month picker, ten KPI cards with traffic lights, a KPI Trend page, a KPI Analysis page and one monthly data sheet. The KPI Dashboard line and the analytical Dashboard line are different templates with different layouts, and several carry similar names.
Does it connect to my CNC, accounting or job-management software?
No. There is no connector and no automatic import. You enter the monthly figures yourself, which is why it works regardless of what software you already run.
Can I change the KPIs?
Yes – rename any KPI, edit its formula and definition text, set your own targets, and switch it between upper-the-better and lower-the-better so the traffic light scores it correctly.
Does it send alerts when something goes red?
No. Nothing emails, notifies or reminds. The card colour changes the next time you open the sheet.
Do I need a paid Google Workspace plan?
No. A free Google account is enough, and there are no add-ons or macros to enable.
Is the sample data real?
No – the twelve months in the file are demonstration figures so the charts and traffic lights have something to draw. Replace them with your own.
Can I use a currency other than USD?
Yes. Material Cost per Job is a plain number with a USD label on the KPI Analysis page; change the unit text and enter your own figures.
About the Author
Built by PK – Microsoft Certified Professional with 15+ years of Excel, Google Sheets, and Power BI experience. Founder of NextGenTemplates, reaching 300K+ subscribers across YouTube channels. Every template is hand-built and tested before release.
Conclusion
A carpentry workshop rarely fails because nobody looked at turnover. It leaks – through sheet stock that ends up as offcuts, machines idle for a blade change nobody logged, units that go back to the bench for re-sanding, and fitted jobs that pull a joiner back a fortnight later. The Carpentry Workshop KPI Scorecard in Google Sheets puts those ten leaks on one page and colours them against a target you set, month by month.
Get the Carpentry Workshop KPI Scorecard in Google Sheets – it is a one-time purchase, opens in any browser, and needs one month of numbers before it starts earning its keep.